

Key Insights
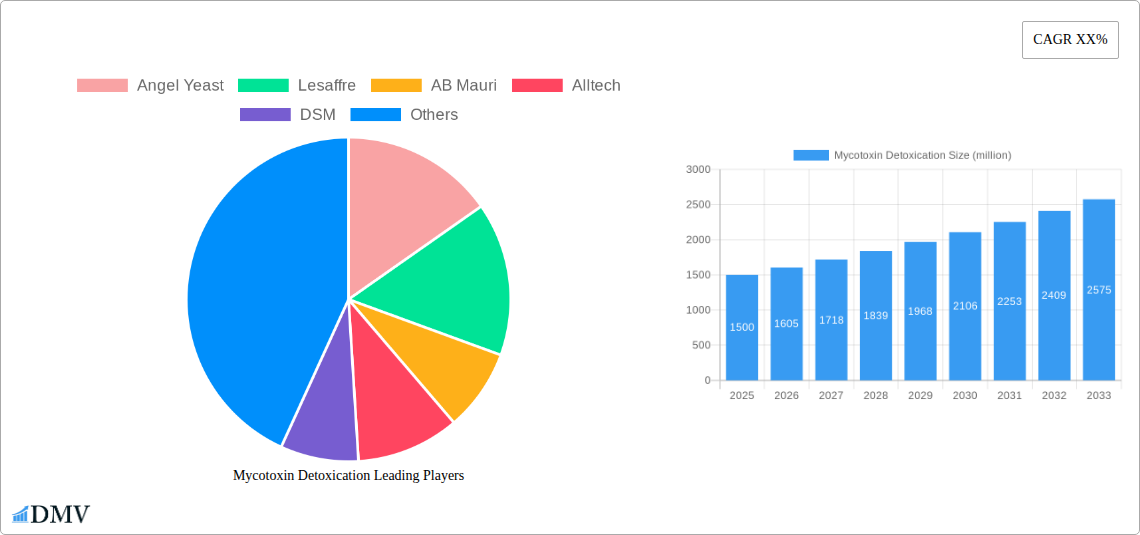
The global mycotoxin detoxification market is experiencing robust growth, driven by increasing awareness of mycotoxin contamination in animal feed and its detrimental effects on animal health and productivity. The market's expansion is fueled by stringent regulatory frameworks mandating mycotoxin control, escalating demand for safe and high-quality animal products, and the rising adoption of preventative measures within the animal agriculture sector. Technological advancements in detoxification methods, such as the development of more effective and efficient adsorbents and biotransformation techniques, are further contributing to market expansion. Major players like Angel Yeast, Lesaffre, and Cargill are actively investing in research and development, expanding their product portfolios, and strategically acquiring smaller companies to strengthen their market positions. This competitive landscape fosters innovation and the development of novel solutions to address the ever-evolving challenges posed by mycotoxins. We estimate the market size in 2025 to be approximately $1.5 billion, projecting a Compound Annual Growth Rate (CAGR) of 7% from 2025 to 2033, indicating substantial future growth potential.
The market segmentation reveals a significant share held by the feed additives segment, due to its widespread application in poultry, swine, and ruminant farming. Geographic growth is expected to be particularly strong in regions like Asia-Pacific, driven by the expanding livestock industry and increasing awareness of mycotoxin risks. However, factors such as the high cost of detoxification products and inconsistent regulatory frameworks across different regions are posing challenges to market growth. Furthermore, the emergence of mycotoxin-resistant strains of fungi is an ongoing concern that necessitates continuous innovation in detoxification strategies. Despite these challenges, the long-term outlook remains positive, fueled by increasing consumer demand for safe food, a growing global population, and the consistent need for effective solutions to safeguard animal health and food security.
Mycotoxin Detoxication Market Report: A Comprehensive Analysis (2019-2033)
This insightful report provides a comprehensive analysis of the global mycotoxin detoxification market, projecting a market valuation exceeding $XX million by 2033. The study covers the historical period (2019-2024), the base year (2025), and forecasts until 2033, offering crucial insights for stakeholders across the value chain. Key players like Angel Yeast, Lesaffre, AB Mauri, Alltech, DSM, Kemin Industries, Nutriad, Novus, and Cargill are analyzed in detail. This report is invaluable for businesses seeking to navigate the complexities and capitalize on the growth opportunities within this vital sector.
Mycotoxin Detoxication Market Composition & Trends
The global mycotoxin detoxification market exhibits a moderately concentrated structure, with the top five players commanding approximately XX% market share in 2025. Innovation is driven primarily by the need for more effective, cost-efficient, and environmentally friendly detoxification solutions. Stringent regulatory frameworks, particularly concerning food safety and animal feed, significantly shape market dynamics. Substitute products, including physical methods and alternative feed sources, present moderate competitive pressure. The primary end-users are the animal feed, food processing, and agricultural industries. M&A activity has been moderate, with a total deal value exceeding $XX million in the past five years, characterized mainly by smaller acquisitions aimed at expanding product portfolios and geographic reach.
- Market Share Distribution (2025): Top 5 players - XX%, Others - XX%.
- M&A Deal Value (2019-2024): $XX million.
- Key M&A Drivers: Portfolio expansion, geographic reach, technological integration.
Mycotoxin Detoxication Industry Evolution
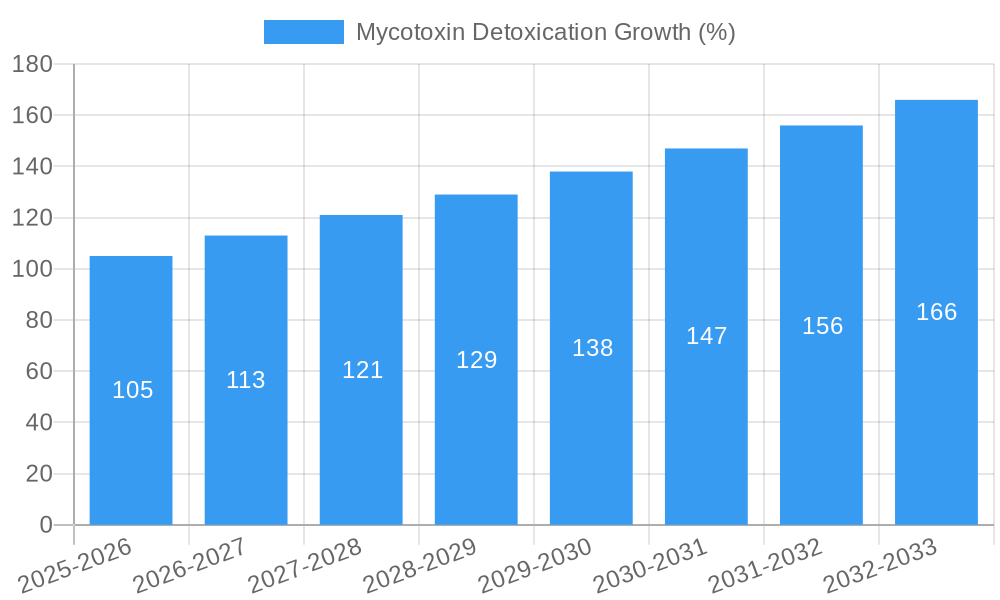
The mycotoxin detoxification market has witnessed robust growth, expanding at a CAGR of XX% during the historical period (2019-2024). This growth is fueled by increasing awareness of mycotoxin risks to human and animal health, stringent regulatory requirements globally, and a rising demand for safe and high-quality food and feed products. Technological advancements, such as the development of novel detoxification agents and improved analytical techniques, have significantly enhanced the efficacy and efficiency of mycotoxin management. Consumer demand for naturally sourced, toxin-free products is driving the adoption of premium, bio-based detoxification solutions. The market is further evolving towards integrated solutions that combine various detoxification approaches for optimal results. Projected growth for the forecast period (2025-2033) is estimated at a CAGR of XX%, driven by increasing production of animal feed, stricter regulatory compliance, and growing consumer consciousness.
Leading Regions, Countries, or Segments in Mycotoxin Detoxication
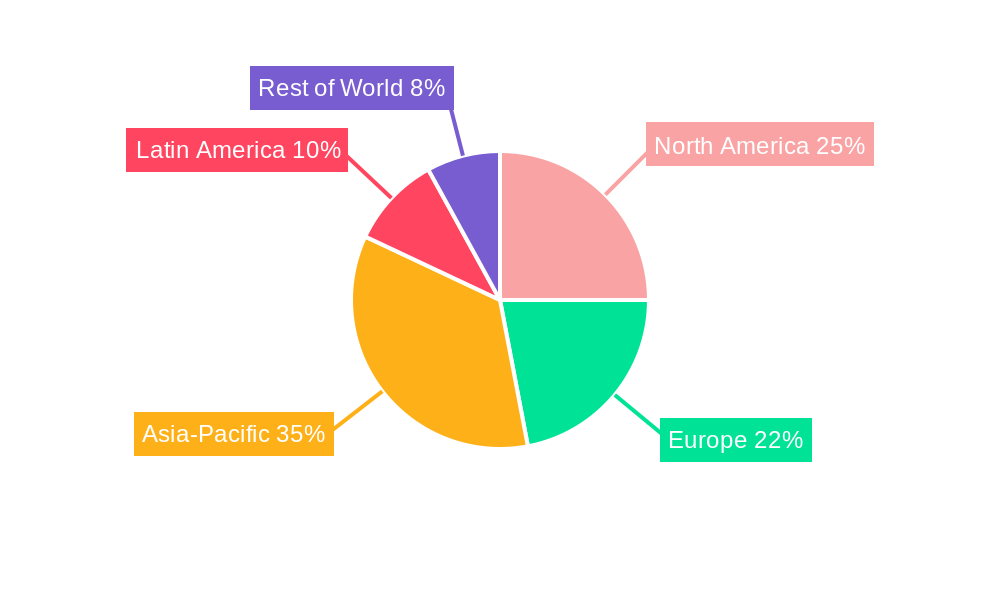
The Asia-Pacific region is projected to dominate the global mycotoxin detoxification market in 2025 and beyond, fueled by a large animal feed production industry, rapid economic growth, and rising consumer awareness of food safety.
- Key Drivers for Asia-Pacific Dominance:
- High animal feed production and consumption
- Growing demand for safe and high-quality food products
- Increased government investments in food safety infrastructure
- Stringent regulatory measures promoting mycotoxin control.
Europe and North America follow as significant regions due to high regulatory standards and advanced agricultural practices. However, the Asia-Pacific region is experiencing faster growth due to its expanding agricultural sector and increasing adoption of advanced technologies.
Mycotoxin Detoxication Product Innovations
Recent innovations focus on developing more effective and environmentally friendly detoxification agents, including the application of enzyme-based solutions and advanced adsorbent materials with enhanced binding capabilities. These innovations offer improved performance metrics, such as higher mycotoxin removal rates and reduced environmental impact. Unique selling propositions include enhanced efficacy, lower application rates, and broader spectrum activity against various mycotoxins. Technological advancements center around targeted delivery systems and improved analytical tools for real-time mycotoxin monitoring.
Propelling Factors for Mycotoxin Detoxication Growth
The market's growth is driven by several key factors, notably stricter regulations regarding mycotoxin levels in food and animal feed, increased consumer demand for safe food, technological advances leading to more effective and efficient detoxification solutions, and the expanding global animal feed industry. The rising prevalence of mycotoxin contamination in agricultural products further fuels market expansion. Economic factors, like increased disposable income and the rising middle class, also contribute to this growth.
Obstacles in the Mycotoxin Detoxication Market
Significant obstacles include the high cost of advanced detoxification technologies, which can limit adoption, especially in developing countries. Supply chain disruptions and fluctuating raw material prices pose considerable challenges. The intense competition among established players and emerging entrants creates significant price pressures. Furthermore, regulatory changes and stringent approval processes can delay product launches and increase development costs. The lack of standardized testing methods and diverse mycotoxin profiles in different regions present considerable challenges for effective control and management.
Future Opportunities in Mycotoxin Detoxication
Emerging opportunities lie in the development of novel, bio-based detoxification agents, improved diagnostic tools for early detection of mycotoxins, and the integration of mycotoxin management strategies into precision agriculture. Expanding into developing markets with stringent regulations and increasing consumer demand represents a significant avenue for growth. The incorporation of AI and machine learning for prediction and monitoring of mycotoxin contamination presents promising opportunities for advanced solutions.
Major Players in the Mycotoxin Detoxication Ecosystem
Key Developments in Mycotoxin Detoxication Industry
- 2022-Q4: Launch of a new enzyme-based mycotoxin detoxification product by DSM.
- 2023-Q1: Acquisition of a smaller competitor by Alltech, expanding its product portfolio.
- 2023-Q2: Introduction of a novel adsorbent material with enhanced mycotoxin binding capabilities by Kemin Industries.
- 2024-Q3: Angel Yeast announces a significant investment in R&D for mycotoxin detection technologies.
- (Further developments to be added based on actual data)
Strategic Mycotoxin Detoxication Market Forecast
The mycotoxin detoxification market is poised for significant growth, driven by ongoing technological advancements, stricter regulations, and increasing consumer demand for safe food and feed. Future opportunities lie in the development of innovative and sustainable solutions targeting specific mycotoxins and addressing the challenges of diverse contamination profiles. The market’s expansion will be further fueled by the growing global animal feed industry and increased awareness of mycotoxin risks across diverse regions. The forecast period (2025-2033) indicates strong market expansion, with the potential for substantial market valuation growth exceeding initial projections.
Mycotoxin Detoxication Segmentation
-
1. Application
- 1.1. Hydrated Aluminosilicates
- 1.2. Bentonite
- 1.3. Yeast Cell Wall Extract
- 1.4. Enzyme Detoxifier
- 1.5. Other
-
2. Types
- 2.1. Hydrated Aluminosilicates
- 2.2. Bentonite
- 2.3. Yeast Cell Wall Extract
- 2.4. Enzyme Detoxifier
- 2.5. Other
Mycotoxin Detoxication Segmentation By Geography
-
1. North America
- 1.1. United States
- 1.2. Canada
- 1.3. Mexico
-
2. South America
- 2.1. Brazil
- 2.2. Argentina
- 2.3. Rest of South America
-
3. Europe
- 3.1. United Kingdom
- 3.2. Germany
- 3.3. France
- 3.4. Italy
- 3.5. Spain
- 3.6. Russia
- 3.7. Benelux
- 3.8. Nordics
- 3.9. Rest of Europe
-
4. Middle East & Africa
- 4.1. Turkey
- 4.2. Israel
- 4.3. GCC
- 4.4. North Africa
- 4.5. South Africa
- 4.6. Rest of Middle East & Africa
-
5. Asia Pacific
- 5.1. China
- 5.2. India
- 5.3. Japan
- 5.4. South Korea
- 5.5. ASEAN
- 5.6. Oceania
- 5.7. Rest of Asia Pacific
Mycotoxin Detoxication REPORT HIGHLIGHTS
| Aspects | Details |
|---|---|
| Study Period | 2019-2033 |
| Base Year | 2024 |
| Estimated Year | 2025 |
| Forecast Period | 2025-2033 |
| Historical Period | 2019-2024 |
| Growth Rate | CAGR of XX% from 2019-2033 |
| Segmentation |
|
Table of Contents
- 1. Introduction
- 1.1. Research Scope
- 1.2. Market Segmentation
- 1.3. Research Methodology
- 1.4. Definitions and Assumptions
- 2. Executive Summary
- 2.1. Introduction
- 3. Market Dynamics
- 3.1. Introduction
- 3.2. Market Drivers
- 3.3. Market Restrains
- 3.4. Market Trends
- 4. Market Factor Analysis
- 4.1. Porters Five Forces
- 4.2. Supply/Value Chain
- 4.3. PESTEL analysis
- 4.4. Market Entropy
- 4.5. Patent/Trademark Analysis
- 5. Global Mycotoxin Detoxication Analysis, Insights and Forecast, 2019-2031
- 5.1. Market Analysis, Insights and Forecast - by Application
- 5.1.1. Hydrated Aluminosilicates
- 5.1.2. Bentonite
- 5.1.3. Yeast Cell Wall Extract
- 5.1.4. Enzyme Detoxifier
- 5.1.5. Other
- 5.2. Market Analysis, Insights and Forecast - by Types
- 5.2.1. Hydrated Aluminosilicates
- 5.2.2. Bentonite
- 5.2.3. Yeast Cell Wall Extract
- 5.2.4. Enzyme Detoxifier
- 5.2.5. Other
- 5.3. Market Analysis, Insights and Forecast - by Region
- 5.3.1. North America
- 5.3.2. South America
- 5.3.3. Europe
- 5.3.4. Middle East & Africa
- 5.3.5. Asia Pacific
- 5.1. Market Analysis, Insights and Forecast - by Application
- 6. North America Mycotoxin Detoxication Analysis, Insights and Forecast, 2019-2031
- 6.1. Market Analysis, Insights and Forecast - by Application
- 6.1.1. Hydrated Aluminosilicates
- 6.1.2. Bentonite
- 6.1.3. Yeast Cell Wall Extract
- 6.1.4. Enzyme Detoxifier
- 6.1.5. Other
- 6.2. Market Analysis, Insights and Forecast - by Types
- 6.2.1. Hydrated Aluminosilicates
- 6.2.2. Bentonite
- 6.2.3. Yeast Cell Wall Extract
- 6.2.4. Enzyme Detoxifier
- 6.2.5. Other
- 6.1. Market Analysis, Insights and Forecast - by Application
- 7. South America Mycotoxin Detoxication Analysis, Insights and Forecast, 2019-2031
- 7.1. Market Analysis, Insights and Forecast - by Application
- 7.1.1. Hydrated Aluminosilicates
- 7.1.2. Bentonite
- 7.1.3. Yeast Cell Wall Extract
- 7.1.4. Enzyme Detoxifier
- 7.1.5. Other
- 7.2. Market Analysis, Insights and Forecast - by Types
- 7.2.1. Hydrated Aluminosilicates
- 7.2.2. Bentonite
- 7.2.3. Yeast Cell Wall Extract
- 7.2.4. Enzyme Detoxifier
- 7.2.5. Other
- 7.1. Market Analysis, Insights and Forecast - by Application
- 8. Europe Mycotoxin Detoxication Analysis, Insights and Forecast, 2019-2031
- 8.1. Market Analysis, Insights and Forecast - by Application
- 8.1.1. Hydrated Aluminosilicates
- 8.1.2. Bentonite
- 8.1.3. Yeast Cell Wall Extract
- 8.1.4. Enzyme Detoxifier
- 8.1.5. Other
- 8.2. Market Analysis, Insights and Forecast - by Types
- 8.2.1. Hydrated Aluminosilicates
- 8.2.2. Bentonite
- 8.2.3. Yeast Cell Wall Extract
- 8.2.4. Enzyme Detoxifier
- 8.2.5. Other
- 8.1. Market Analysis, Insights and Forecast - by Application
- 9. Middle East & Africa Mycotoxin Detoxication Analysis, Insights and Forecast, 2019-2031
- 9.1. Market Analysis, Insights and Forecast - by Application
- 9.1.1. Hydrated Aluminosilicates
- 9.1.2. Bentonite
- 9.1.3. Yeast Cell Wall Extract
- 9.1.4. Enzyme Detoxifier
- 9.1.5. Other
- 9.2. Market Analysis, Insights and Forecast - by Types
- 9.2.1. Hydrated Aluminosilicates
- 9.2.2. Bentonite
- 9.2.3. Yeast Cell Wall Extract
- 9.2.4. Enzyme Detoxifier
- 9.2.5. Other
- 9.1. Market Analysis, Insights and Forecast - by Application
- 10. Asia Pacific Mycotoxin Detoxication Analysis, Insights and Forecast, 2019-2031
- 10.1. Market Analysis, Insights and Forecast - by Application
- 10.1.1. Hydrated Aluminosilicates
- 10.1.2. Bentonite
- 10.1.3. Yeast Cell Wall Extract
- 10.1.4. Enzyme Detoxifier
- 10.1.5. Other
- 10.2. Market Analysis, Insights and Forecast - by Types
- 10.2.1. Hydrated Aluminosilicates
- 10.2.2. Bentonite
- 10.2.3. Yeast Cell Wall Extract
- 10.2.4. Enzyme Detoxifier
- 10.2.5. Other
- 10.1. Market Analysis, Insights and Forecast - by Application
- 11. Competitive Analysis
- 11.1. Global Market Share Analysis 2024
- 11.2. Company Profiles
- 11.2.1 Angel Yeast
- 11.2.1.1. Overview
- 11.2.1.2. Products
- 11.2.1.3. SWOT Analysis
- 11.2.1.4. Recent Developments
- 11.2.1.5. Financials (Based on Availability)
- 11.2.2 Lesaffre
- 11.2.2.1. Overview
- 11.2.2.2. Products
- 11.2.2.3. SWOT Analysis
- 11.2.2.4. Recent Developments
- 11.2.2.5. Financials (Based on Availability)
- 11.2.3 AB Mauri
- 11.2.3.1. Overview
- 11.2.3.2. Products
- 11.2.3.3. SWOT Analysis
- 11.2.3.4. Recent Developments
- 11.2.3.5. Financials (Based on Availability)
- 11.2.4 Alltech
- 11.2.4.1. Overview
- 11.2.4.2. Products
- 11.2.4.3. SWOT Analysis
- 11.2.4.4. Recent Developments
- 11.2.4.5. Financials (Based on Availability)
- 11.2.5 DSM
- 11.2.5.1. Overview
- 11.2.5.2. Products
- 11.2.5.3. SWOT Analysis
- 11.2.5.4. Recent Developments
- 11.2.5.5. Financials (Based on Availability)
- 11.2.6 Kemin Industries
- 11.2.6.1. Overview
- 11.2.6.2. Products
- 11.2.6.3. SWOT Analysis
- 11.2.6.4. Recent Developments
- 11.2.6.5. Financials (Based on Availability)
- 11.2.7 Nutriad
- 11.2.7.1. Overview
- 11.2.7.2. Products
- 11.2.7.3. SWOT Analysis
- 11.2.7.4. Recent Developments
- 11.2.7.5. Financials (Based on Availability)
- 11.2.8 Novus
- 11.2.8.1. Overview
- 11.2.8.2. Products
- 11.2.8.3. SWOT Analysis
- 11.2.8.4. Recent Developments
- 11.2.8.5. Financials (Based on Availability)
- 11.2.9 Cargill
- 11.2.9.1. Overview
- 11.2.9.2. Products
- 11.2.9.3. SWOT Analysis
- 11.2.9.4. Recent Developments
- 11.2.9.5. Financials (Based on Availability)
- 11.2.1 Angel Yeast
List of Figures
- Figure 1: Global Mycotoxin Detoxication Revenue Breakdown (million, %) by Region 2024 & 2032
- Figure 2: Global Mycotoxin Detoxication Volume Breakdown (K, %) by Region 2024 & 2032
- Figure 3: North America Mycotoxin Detoxication Revenue (million), by Application 2024 & 2032
- Figure 4: North America Mycotoxin Detoxication Volume (K), by Application 2024 & 2032
- Figure 5: North America Mycotoxin Detoxication Revenue Share (%), by Application 2024 & 2032
- Figure 6: North America Mycotoxin Detoxication Volume Share (%), by Application 2024 & 2032
- Figure 7: North America Mycotoxin Detoxication Revenue (million), by Types 2024 & 2032
- Figure 8: North America Mycotoxin Detoxication Volume (K), by Types 2024 & 2032
- Figure 9: North America Mycotoxin Detoxication Revenue Share (%), by Types 2024 & 2032
- Figure 10: North America Mycotoxin Detoxication Volume Share (%), by Types 2024 & 2032
- Figure 11: North America Mycotoxin Detoxication Revenue (million), by Country 2024 & 2032
- Figure 12: North America Mycotoxin Detoxication Volume (K), by Country 2024 & 2032
- Figure 13: North America Mycotoxin Detoxication Revenue Share (%), by Country 2024 & 2032
- Figure 14: North America Mycotoxin Detoxication Volume Share (%), by Country 2024 & 2032
- Figure 15: South America Mycotoxin Detoxication Revenue (million), by Application 2024 & 2032
- Figure 16: South America Mycotoxin Detoxication Volume (K), by Application 2024 & 2032
- Figure 17: South America Mycotoxin Detoxication Revenue Share (%), by Application 2024 & 2032
- Figure 18: South America Mycotoxin Detoxication Volume Share (%), by Application 2024 & 2032
- Figure 19: South America Mycotoxin Detoxication Revenue (million), by Types 2024 & 2032
- Figure 20: South America Mycotoxin Detoxication Volume (K), by Types 2024 & 2032
- Figure 21: South America Mycotoxin Detoxication Revenue Share (%), by Types 2024 & 2032
- Figure 22: South America Mycotoxin Detoxication Volume Share (%), by Types 2024 & 2032
- Figure 23: South America Mycotoxin Detoxication Revenue (million), by Country 2024 & 2032
- Figure 24: South America Mycotoxin Detoxication Volume (K), by Country 2024 & 2032
- Figure 25: South America Mycotoxin Detoxication Revenue Share (%), by Country 2024 & 2032
- Figure 26: South America Mycotoxin Detoxication Volume Share (%), by Country 2024 & 2032
- Figure 27: Europe Mycotoxin Detoxication Revenue (million), by Application 2024 & 2032
- Figure 28: Europe Mycotoxin Detoxication Volume (K), by Application 2024 & 2032
- Figure 29: Europe Mycotoxin Detoxication Revenue Share (%), by Application 2024 & 2032
- Figure 30: Europe Mycotoxin Detoxication Volume Share (%), by Application 2024 & 2032
- Figure 31: Europe Mycotoxin Detoxication Revenue (million), by Types 2024 & 2032
- Figure 32: Europe Mycotoxin Detoxication Volume (K), by Types 2024 & 2032
- Figure 33: Europe Mycotoxin Detoxication Revenue Share (%), by Types 2024 & 2032
- Figure 34: Europe Mycotoxin Detoxication Volume Share (%), by Types 2024 & 2032
- Figure 35: Europe Mycotoxin Detoxication Revenue (million), by Country 2024 & 2032
- Figure 36: Europe Mycotoxin Detoxication Volume (K), by Country 2024 & 2032
- Figure 37: Europe Mycotoxin Detoxication Revenue Share (%), by Country 2024 & 2032
- Figure 38: Europe Mycotoxin Detoxication Volume Share (%), by Country 2024 & 2032
- Figure 39: Middle East & Africa Mycotoxin Detoxication Revenue (million), by Application 2024 & 2032
- Figure 40: Middle East & Africa Mycotoxin Detoxication Volume (K), by Application 2024 & 2032
- Figure 41: Middle East & Africa Mycotoxin Detoxication Revenue Share (%), by Application 2024 & 2032
- Figure 42: Middle East & Africa Mycotoxin Detoxication Volume Share (%), by Application 2024 & 2032
- Figure 43: Middle East & Africa Mycotoxin Detoxication Revenue (million), by Types 2024 & 2032
- Figure 44: Middle East & Africa Mycotoxin Detoxication Volume (K), by Types 2024 & 2032
- Figure 45: Middle East & Africa Mycotoxin Detoxication Revenue Share (%), by Types 2024 & 2032
- Figure 46: Middle East & Africa Mycotoxin Detoxication Volume Share (%), by Types 2024 & 2032
- Figure 47: Middle East & Africa Mycotoxin Detoxication Revenue (million), by Country 2024 & 2032
- Figure 48: Middle East & Africa Mycotoxin Detoxication Volume (K), by Country 2024 & 2032
- Figure 49: Middle East & Africa Mycotoxin Detoxication Revenue Share (%), by Country 2024 & 2032
- Figure 50: Middle East & Africa Mycotoxin Detoxication Volume Share (%), by Country 2024 & 2032
- Figure 51: Asia Pacific Mycotoxin Detoxication Revenue (million), by Application 2024 & 2032
- Figure 52: Asia Pacific Mycotoxin Detoxication Volume (K), by Application 2024 & 2032
- Figure 53: Asia Pacific Mycotoxin Detoxication Revenue Share (%), by Application 2024 & 2032
- Figure 54: Asia Pacific Mycotoxin Detoxication Volume Share (%), by Application 2024 & 2032
- Figure 55: Asia Pacific Mycotoxin Detoxication Revenue (million), by Types 2024 & 2032
- Figure 56: Asia Pacific Mycotoxin Detoxication Volume (K), by Types 2024 & 2032
- Figure 57: Asia Pacific Mycotoxin Detoxication Revenue Share (%), by Types 2024 & 2032
- Figure 58: Asia Pacific Mycotoxin Detoxication Volume Share (%), by Types 2024 & 2032
- Figure 59: Asia Pacific Mycotoxin Detoxication Revenue (million), by Country 2024 & 2032
- Figure 60: Asia Pacific Mycotoxin Detoxication Volume (K), by Country 2024 & 2032
- Figure 61: Asia Pacific Mycotoxin Detoxication Revenue Share (%), by Country 2024 & 2032
- Figure 62: Asia Pacific Mycotoxin Detoxication Volume Share (%), by Country 2024 & 2032
List of Tables
- Table 1: Global Mycotoxin Detoxication Revenue million Forecast, by Region 2019 & 2032
- Table 2: Global Mycotoxin Detoxication Volume K Forecast, by Region 2019 & 2032
- Table 3: Global Mycotoxin Detoxication Revenue million Forecast, by Application 2019 & 2032
- Table 4: Global Mycotoxin Detoxication Volume K Forecast, by Application 2019 & 2032
- Table 5: Global Mycotoxin Detoxication Revenue million Forecast, by Types 2019 & 2032
- Table 6: Global Mycotoxin Detoxication Volume K Forecast, by Types 2019 & 2032
- Table 7: Global Mycotoxin Detoxication Revenue million Forecast, by Region 2019 & 2032
- Table 8: Global Mycotoxin Detoxication Volume K Forecast, by Region 2019 & 2032
- Table 9: Global Mycotoxin Detoxication Revenue million Forecast, by Application 2019 & 2032
- Table 10: Global Mycotoxin Detoxication Volume K Forecast, by Application 2019 & 2032
- Table 11: Global Mycotoxin Detoxication Revenue million Forecast, by Types 2019 & 2032
- Table 12: Global Mycotoxin Detoxication Volume K Forecast, by Types 2019 & 2032
- Table 13: Global Mycotoxin Detoxication Revenue million Forecast, by Country 2019 & 2032
- Table 14: Global Mycotoxin Detoxication Volume K Forecast, by Country 2019 & 2032
- Table 15: United States Mycotoxin Detoxication Revenue (million) Forecast, by Application 2019 & 2032
- Table 16: United States Mycotoxin Detoxication Volume (K) Forecast, by Application 2019 & 2032
- Table 17: Canada Mycotoxin Detoxication Revenue (million) Forecast, by Application 2019 & 2032
- Table 18: Canada Mycotoxin Detoxication Volume (K) Forecast, by Application 2019 & 2032
- Table 19: Mexico Mycotoxin Detoxication Revenue (million) Forecast, by Application 2019 & 2032
- Table 20: Mexico Mycotoxin Detoxication Volume (K) Forecast, by Application 2019 & 2032
- Table 21: Global Mycotoxin Detoxication Revenue million Forecast, by Application 2019 & 2032
- Table 22: Global Mycotoxin Detoxication Volume K Forecast, by Application 2019 & 2032
- Table 23: Global Mycotoxin Detoxication Revenue million Forecast, by Types 2019 & 2032
- Table 24: Global Mycotoxin Detoxication Volume K Forecast, by Types 2019 & 2032
- Table 25: Global Mycotoxin Detoxication Revenue million Forecast, by Country 2019 & 2032
- Table 26: Global Mycotoxin Detoxication Volume K Forecast, by Country 2019 & 2032
- Table 27: Brazil Mycotoxin Detoxication Revenue (million) Forecast, by Application 2019 & 2032
- Table 28: Brazil Mycotoxin Detoxication Volume (K) Forecast, by Application 2019 & 2032
- Table 29: Argentina Mycotoxin Detoxication Revenue (million) Forecast, by Application 2019 & 2032
- Table 30: Argentina Mycotoxin Detoxication Volume (K) Forecast, by Application 2019 & 2032
- Table 31: Rest of South America Mycotoxin Detoxication Revenue (million) Forecast, by Application 2019 & 2032
- Table 32: Rest of South America Mycotoxin Detoxication Volume (K) Forecast, by Application 2019 & 2032
- Table 33: Global Mycotoxin Detoxication Revenue million Forecast, by Application 2019 & 2032
- Table 34: Global Mycotoxin Detoxication Volume K Forecast, by Application 2019 & 2032
- Table 35: Global Mycotoxin Detoxication Revenue million Forecast, by Types 2019 & 2032
- Table 36: Global Mycotoxin Detoxication Volume K Forecast, by Types 2019 & 2032
- Table 37: Global Mycotoxin Detoxication Revenue million Forecast, by Country 2019 & 2032
- Table 38: Global Mycotoxin Detoxication Volume K Forecast, by Country 2019 & 2032
- Table 39: United Kingdom Mycotoxin Detoxication Revenue (million) Forecast, by Application 2019 & 2032
- Table 40: United Kingdom Mycotoxin Detoxication Volume (K) Forecast, by Application 2019 & 2032
- Table 41: Germany Mycotoxin Detoxication Revenue (million) Forecast, by Application 2019 & 2032
- Table 42: Germany Mycotoxin Detoxication Volume (K) Forecast, by Application 2019 & 2032
- Table 43: France Mycotoxin Detoxication Revenue (million) Forecast, by Application 2019 & 2032
- Table 44: France Mycotoxin Detoxication Volume (K) Forecast, by Application 2019 & 2032
- Table 45: Italy Mycotoxin Detoxication Revenue (million) Forecast, by Application 2019 & 2032
- Table 46: Italy Mycotoxin Detoxication Volume (K) Forecast, by Application 2019 & 2032
- Table 47: Spain Mycotoxin Detoxication Revenue (million) Forecast, by Application 2019 & 2032
- Table 48: Spain Mycotoxin Detoxication Volume (K) Forecast, by Application 2019 & 2032
- Table 49: Russia Mycotoxin Detoxication Revenue (million) Forecast, by Application 2019 & 2032
- Table 50: Russia Mycotoxin Detoxication Volume (K) Forecast, by Application 2019 & 2032
- Table 51: Benelux Mycotoxin Detoxication Revenue (million) Forecast, by Application 2019 & 2032
- Table 52: Benelux Mycotoxin Detoxication Volume (K) Forecast, by Application 2019 & 2032
- Table 53: Nordics Mycotoxin Detoxication Revenue (million) Forecast, by Application 2019 & 2032
- Table 54: Nordics Mycotoxin Detoxication Volume (K) Forecast, by Application 2019 & 2032
- Table 55: Rest of Europe Mycotoxin Detoxication Revenue (million) Forecast, by Application 2019 & 2032
- Table 56: Rest of Europe Mycotoxin Detoxication Volume (K) Forecast, by Application 2019 & 2032
- Table 57: Global Mycotoxin Detoxication Revenue million Forecast, by Application 2019 & 2032
- Table 58: Global Mycotoxin Detoxication Volume K Forecast, by Application 2019 & 2032
- Table 59: Global Mycotoxin Detoxication Revenue million Forecast, by Types 2019 & 2032
- Table 60: Global Mycotoxin Detoxication Volume K Forecast, by Types 2019 & 2032
- Table 61: Global Mycotoxin Detoxication Revenue million Forecast, by Country 2019 & 2032
- Table 62: Global Mycotoxin Detoxication Volume K Forecast, by Country 2019 & 2032
- Table 63: Turkey Mycotoxin Detoxication Revenue (million) Forecast, by Application 2019 & 2032
- Table 64: Turkey Mycotoxin Detoxication Volume (K) Forecast, by Application 2019 & 2032
- Table 65: Israel Mycotoxin Detoxication Revenue (million) Forecast, by Application 2019 & 2032
- Table 66: Israel Mycotoxin Detoxication Volume (K) Forecast, by Application 2019 & 2032
- Table 67: GCC Mycotoxin Detoxication Revenue (million) Forecast, by Application 2019 & 2032
- Table 68: GCC Mycotoxin Detoxication Volume (K) Forecast, by Application 2019 & 2032
- Table 69: North Africa Mycotoxin Detoxication Revenue (million) Forecast, by Application 2019 & 2032
- Table 70: North Africa Mycotoxin Detoxication Volume (K) Forecast, by Application 2019 & 2032
- Table 71: South Africa Mycotoxin Detoxication Revenue (million) Forecast, by Application 2019 & 2032
- Table 72: South Africa Mycotoxin Detoxication Volume (K) Forecast, by Application 2019 & 2032
- Table 73: Rest of Middle East & Africa Mycotoxin Detoxication Revenue (million) Forecast, by Application 2019 & 2032
- Table 74: Rest of Middle East & Africa Mycotoxin Detoxication Volume (K) Forecast, by Application 2019 & 2032
- Table 75: Global Mycotoxin Detoxication Revenue million Forecast, by Application 2019 & 2032
- Table 76: Global Mycotoxin Detoxication Volume K Forecast, by Application 2019 & 2032
- Table 77: Global Mycotoxin Detoxication Revenue million Forecast, by Types 2019 & 2032
- Table 78: Global Mycotoxin Detoxication Volume K Forecast, by Types 2019 & 2032
- Table 79: Global Mycotoxin Detoxication Revenue million Forecast, by Country 2019 & 2032
- Table 80: Global Mycotoxin Detoxication Volume K Forecast, by Country 2019 & 2032
- Table 81: China Mycotoxin Detoxication Revenue (million) Forecast, by Application 2019 & 2032
- Table 82: China Mycotoxin Detoxication Volume (K) Forecast, by Application 2019 & 2032
- Table 83: India Mycotoxin Detoxication Revenue (million) Forecast, by Application 2019 & 2032
- Table 84: India Mycotoxin Detoxication Volume (K) Forecast, by Application 2019 & 2032
- Table 85: Japan Mycotoxin Detoxication Revenue (million) Forecast, by Application 2019 & 2032
- Table 86: Japan Mycotoxin Detoxication Volume (K) Forecast, by Application 2019 & 2032
- Table 87: South Korea Mycotoxin Detoxication Revenue (million) Forecast, by Application 2019 & 2032
- Table 88: South Korea Mycotoxin Detoxication Volume (K) Forecast, by Application 2019 & 2032
- Table 89: ASEAN Mycotoxin Detoxication Revenue (million) Forecast, by Application 2019 & 2032
- Table 90: ASEAN Mycotoxin Detoxication Volume (K) Forecast, by Application 2019 & 2032
- Table 91: Oceania Mycotoxin Detoxication Revenue (million) Forecast, by Application 2019 & 2032
- Table 92: Oceania Mycotoxin Detoxication Volume (K) Forecast, by Application 2019 & 2032
- Table 93: Rest of Asia Pacific Mycotoxin Detoxication Revenue (million) Forecast, by Application 2019 & 2032
- Table 94: Rest of Asia Pacific Mycotoxin Detoxication Volume (K) Forecast, by Application 2019 & 2032
Frequently Asked Questions
1. What is the projected Compound Annual Growth Rate (CAGR) of the Mycotoxin Detoxication?
The projected CAGR is approximately XX%.
2. Which companies are prominent players in the Mycotoxin Detoxication?
Key companies in the market include Angel Yeast, Lesaffre, AB Mauri, Alltech, DSM, Kemin Industries, Nutriad, Novus, Cargill.
3. What are the main segments of the Mycotoxin Detoxication?
The market segments include Application, Types.
4. Can you provide details about the market size?
The market size is estimated to be USD XXX million as of 2022.
5. What are some drivers contributing to market growth?
N/A
6. What are the notable trends driving market growth?
N/A
7. Are there any restraints impacting market growth?
N/A
8. Can you provide examples of recent developments in the market?
N/A
9. What pricing options are available for accessing the report?
Pricing options include single-user, multi-user, and enterprise licenses priced at USD 3950.00, USD 5925.00, and USD 7900.00 respectively.
10. Is the market size provided in terms of value or volume?
The market size is provided in terms of value, measured in million and volume, measured in K.
11. Are there any specific market keywords associated with the report?
Yes, the market keyword associated with the report is "Mycotoxin Detoxication," which aids in identifying and referencing the specific market segment covered.
12. How do I determine which pricing option suits my needs best?
The pricing options vary based on user requirements and access needs. Individual users may opt for single-user licenses, while businesses requiring broader access may choose multi-user or enterprise licenses for cost-effective access to the report.
13. Are there any additional resources or data provided in the Mycotoxin Detoxication report?
While the report offers comprehensive insights, it's advisable to review the specific contents or supplementary materials provided to ascertain if additional resources or data are available.
14. How can I stay updated on further developments or reports in the Mycotoxin Detoxication?
To stay informed about further developments, trends, and reports in the Mycotoxin Detoxication, consider subscribing to industry newsletters, following relevant companies and organizations, or regularly checking reputable industry news sources and publications.
Methodology
Step 1 - Identification of Relevant Samples Size from Population Database


Step 2 - Approaches for Defining Global Market Size (Value, Volume* & Price*)

Note*: In applicable scenarios
Step 3 - Data Sources
Primary Research
- Web Analytics
- Survey Reports
- Research Institute
- Latest Research Reports
- Opinion Leaders
Secondary Research
- Annual Reports
- White Paper
- Latest Press Release
- Industry Association
- Paid Database
- Investor Presentations

Step 4 - Data Triangulation
Involves using different sources of information in order to increase the validity of a study
These sources are likely to be stakeholders in a program - participants, other researchers, program staff, other community members, and so on.
Then we put all data in single framework & apply various statistical tools to find out the dynamic on the market.
During the analysis stage, feedback from the stakeholder groups would be compared to determine areas of agreement as well as areas of divergence
