

Key Insights
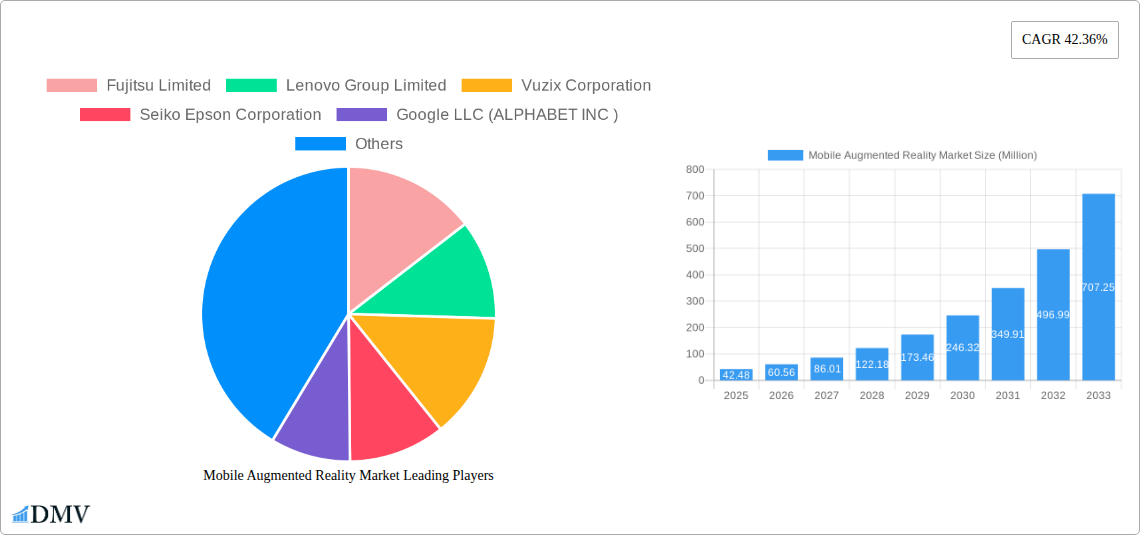
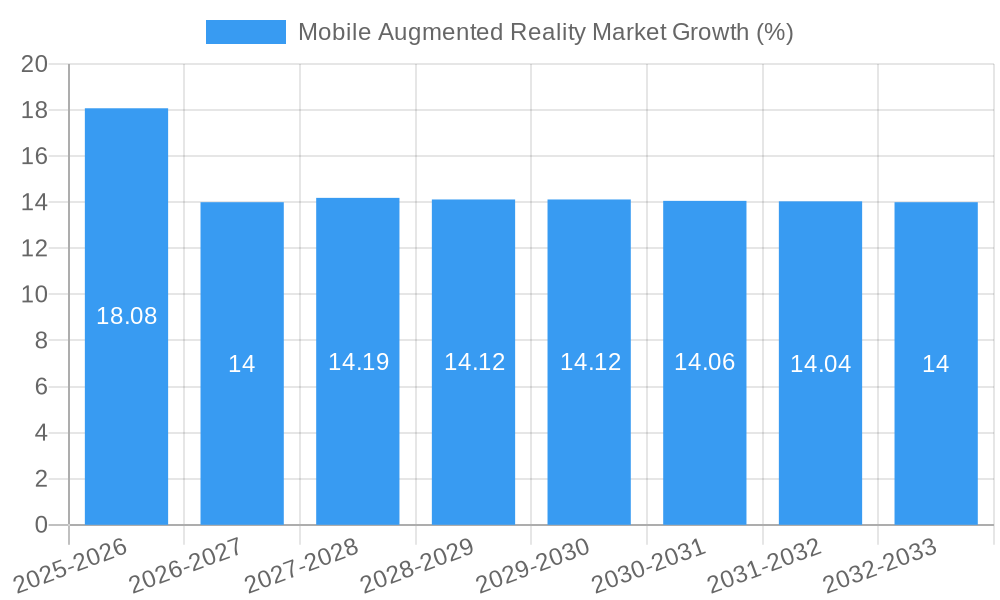
The mobile augmented reality (MAR) market is experiencing explosive growth, projected to reach a market size of $42.48 million in 2025 and exhibiting a remarkable Compound Annual Growth Rate (CAGR) of 42.36%. This surge is driven by several key factors. The increasing affordability and accessibility of smartphones coupled with advancements in processing power and camera technology are making MAR applications more viable and user-friendly. Furthermore, the expanding adoption of 5G networks is providing the necessary bandwidth for seamless and high-quality MAR experiences. Significant growth is fueled by the gaming industry, which leverages MAR for immersive gameplay and enhanced user engagement. The education sector is also embracing MAR for interactive learning tools and simulations, while healthcare is exploring its potential for improved diagnostics, surgical planning, and patient education. Retail and marketing are utilizing MAR for virtual try-ons, product visualizations, and interactive advertising campaigns. Finally, the automotive, military, and defense sectors are employing MAR for navigation, training simulations, and maintenance support. The market is segmented by hardware (such as smartphones and AR glasses) and software, with software likely representing a larger and faster-growing segment due to its lower barrier to entry and scalability.
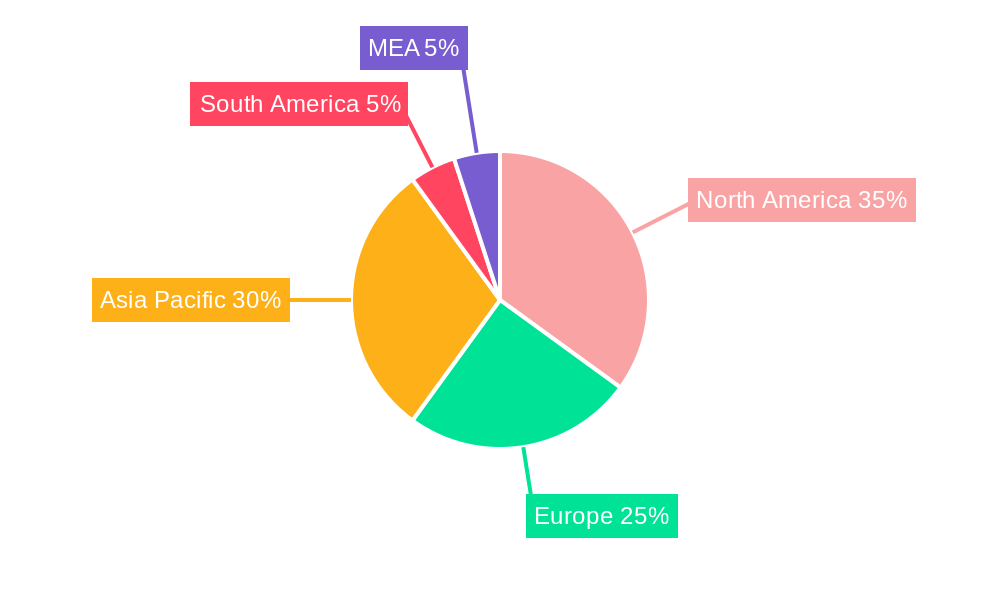
Looking ahead, the continued refinement of MAR technology, including advancements in computer vision, sensor technology, and user interface design, will further fuel market expansion. The integration of Artificial Intelligence (AI) to enhance the contextual understanding and responsiveness of MAR applications will also contribute to future growth. Challenges remain, such as the need for improved battery life in mobile devices to support extended AR experiences, and overcoming concerns about data privacy and security related to the collection and use of user data. Nevertheless, the positive market dynamics and the increasing adoption across diverse sectors indicate a strong and sustained trajectory for the mobile augmented reality market throughout the forecast period (2025-2033). Geographical growth is expected across all regions, with North America and Asia-Pacific anticipated to lead due to early adoption and technological innovation within these markets.
Mobile Augmented Reality Market: A Comprehensive Report (2019-2033)
This insightful report provides a detailed analysis of the Mobile Augmented Reality (AR) market, offering a comprehensive overview of its current state, future trajectory, and key players. With a study period spanning 2019-2033, a base year of 2025, and a forecast period of 2025-2033, this report is an invaluable resource for stakeholders seeking to understand and capitalize on the burgeoning opportunities within this dynamic market. The market is projected to reach xx Million by 2033, showcasing significant growth potential.
Mobile Augmented Reality Market Market Composition & Trends
This section delves into the intricate composition of the mobile augmented reality market, examining market concentration, innovation drivers, regulatory landscapes, substitute products, end-user profiles, and merger and acquisition (M&A) activities. We analyze market share distribution across key players like Fujitsu Limited, Lenovo Group Limited, Vuzix Corporation, Seiko Epson Corporation, Google LLC (Alphabet Inc.), Realwear Inc, Kopin Corporation, Optinvent, Daqri, and Dynabook Europe GmbH. The report also quantifies M&A deal values in the sector, revealing the strategic shifts and investment trends influencing market consolidation. The competitive landscape is further analyzed considering the emergence of substitute technologies and their potential impact. Detailed end-user profiles across various sectors—including Gaming, Education, Healthcare, Retail & Marketing, Automotive, Military & Defense, and Other End-user Verticals—provide a granular understanding of market demand.
- Market Concentration: Analysis of market share held by top 5 players (xx%), with a focus on identifying dominant players and their strategies.
- Innovation Catalysts: Identification of key technological advancements driving market growth, including advancements in processing power, display technology, and sensor integration.
- Regulatory Landscape: Assessment of existing and emerging regulations impacting market development across key regions.
- Substitute Products: Evaluation of competing technologies and their potential to disrupt the mobile AR market.
- End-User Profiles: Detailed analysis of end-user needs and preferences across key verticals.
- M&A Activities: Review of significant mergers, acquisitions, and partnerships, including deal values and strategic implications (e.g., xx Million deal between Company A and Company B).
Mobile Augmented Reality Market Industry Evolution
This section provides a thorough examination of the mobile augmented reality market's evolution, tracing its growth trajectory from 2019 to the projected future. We analyze technological advancements, including improvements in hardware, software, and user interfaces, alongside evolving consumer demands and their impact on market dynamics. The analysis incorporates specific data points such as compound annual growth rates (CAGRs) and adoption metrics across various segments. We also highlight the shift towards more immersive and interactive AR experiences, driven by the increasing power of mobile devices and the development of advanced software platforms. Specific examples of technological advancements are highlighted, such as improvements in sensor accuracy and the integration of artificial intelligence for enhanced object recognition and tracking. Growth rates and adoption metrics are presented with specific data points, for instance, the expected adoption rate in the gaming sector may be xx% by 2033.
Leading Regions, Countries, or Segments in Mobile Augmented Reality Market
This section pinpoints the leading regions, countries, and segments within the mobile augmented reality market. We analyze the dominance of specific end-user verticals (Gaming, Education, Healthcare, Retail & Marketing, Automotive, Military & Defense, and Others) and product types (Hardware, Screenless Viewer, Software) through a comprehensive evaluation of key drivers. This includes examining investment trends, regulatory support, and market size in each segment. The report identifies the dominant region based on market size and growth potential, with a deep dive into the factors driving its success.
- Key Drivers for Dominant Segments:
- Gaming: High consumer demand, technological advancements in game development, and widespread smartphone penetration.
- Retail & Marketing: Increased adoption of AR for enhanced shopping experiences, brand engagement, and advertising campaigns.
- Hardware: Growing adoption of mobile AR devices and accessories.
- Regional Analysis: Detailed examination of market performance across various regions, focusing on factors influencing their leadership (e.g., infrastructure, consumer behavior, and government policies).
Mobile Augmented Reality Market Product Innovations
This section details groundbreaking product innovations in the mobile augmented reality space. We showcase the latest applications of AR technology, emphasizing their unique selling propositions and technological advancements. We present key performance metrics demonstrating the enhanced capabilities and improved user experiences provided by these innovations, including improvements in field-of-view, latency reduction, and tracking accuracy. Examples include advancements in spatial computing, improved depth sensing, and the integration of artificial intelligence for more contextual and personalized experiences.
Propelling Factors for Mobile Augmented Reality Market Growth
Several factors are driving significant growth in the mobile augmented reality market. Technological advancements, such as the development of more powerful mobile processors and improved AR software, are playing a crucial role. The increasing affordability of AR-enabled smartphones and other devices is expanding market accessibility. Furthermore, supportive government regulations and increased investment in AR research and development are fostering innovation and market expansion. Specific examples include government initiatives to promote AR technology adoption in education and healthcare.
Obstacles in the Mobile Augmented Reality Market Market
Despite the significant growth potential, several obstacles hinder the widespread adoption of mobile augmented reality. Regulatory hurdles, such as data privacy concerns and the need for standardization, create uncertainty and stifle innovation. Supply chain disruptions and the challenges of securing consistent access to essential components can impact the production and distribution of mobile AR devices. Furthermore, intense competition among established technology companies and new entrants creates pressure on margins and profitability. Quantifiable impacts of these challenges are highlighted throughout the report, for example, supply chain issues are estimated to have reduced production by xx% in 2024.
Future Opportunities in Mobile Augmented Reality Market
The future of the mobile augmented reality market holds immense potential. The emergence of new markets, such as industrial applications and augmented reality in healthcare diagnostics, represents significant opportunities for growth. Advancements in technologies such as 5G connectivity and improved battery life promise to enhance the user experience and broaden the adoption of mobile AR devices. Furthermore, evolving consumer preferences and the increasing demand for immersive experiences continue to drive innovation and market expansion.
Major Players in the Mobile Augmented Reality Market Ecosystem
- Fujitsu Limited
- Lenovo Group Limited
- Vuzix Corporation
- Seiko Epson Corporation
- Google LLC (Alphabet Inc.) [Google]
- Realwear Inc
- Kopin Corporation
- Optinvent
- Daqri
- Dynabook Europe GmbH
Key Developments in Mobile Augmented Reality Market Industry
- January 2022: Qualcomm and Microsoft announced a partnership to advance and accelerate augmented reality and open up new portals to the metaverse. This collaboration focuses on the development of unique AR chips and integrated software platforms, significantly impacting the hardware and software sectors of the mobile AR ecosystem.
- September 2022: Blippar integrated its WebAR SDK into Unity, simplifying AR experience creation and distribution for Unity developers. This development lowered the barrier to entry for developers, potentially accelerating the creation of new AR applications and experiences.
Strategic Mobile Augmented Reality Market Market Forecast
The mobile augmented reality market is poised for substantial growth in the coming years, driven by technological advancements, increasing consumer adoption, and expanding application areas. The forecast period (2025-2033) anticipates strong growth across various segments, with particular potential in the gaming, retail and marketing, and healthcare sectors. The market's continued expansion is expected to be fueled by ongoing technological innovation and the emergence of new use cases. This will lead to significant market opportunities for companies involved in the development, manufacturing, and distribution of mobile AR hardware, software, and services.
Mobile Augmented Reality Market Segmentation
-
1. Type
- 1.1. Standalone
- 1.2. Tethered
- 1.3. Screenless Viewer
-
2. End User
- 2.1. Gaming
- 2.2. Education
- 2.3. Healthcare
- 2.4. Retail and Marketing
- 2.5. Automotive
- 2.6. Military and Defense
- 2.7. Other End-user Verticals
-
3. Software
- 3.1. Object Tracking
- 3.2. Image Recognition
- 3.3. Data Analytics
Mobile Augmented Reality Market Segmentation By Geography
-
1. North America
- 1.1. US
- 1.2. Canada
-
2. Europe
- 2.1. Germany
- 2.2. UK
- 2.3. France
- 2.4. Italy
- 2.5. Rest of Europe
-
3. Asia Pacific
- 3.1. India
- 3.2. China
- 3.3. Japan
- 3.4. Rest of Asia Pacific
- 4. Rest of the World
Mobile Augmented Reality Market REPORT HIGHLIGHTS
| Aspects | Details |
|---|---|
| Study Period | 2019-2033 |
| Base Year | 2024 |
| Estimated Year | 2025 |
| Forecast Period | 2025-2033 |
| Historical Period | 2019-2024 |
| Growth Rate | CAGR of 42.36% from 2019-2033 |
| Segmentation |
|
Table of Contents
- 1. Introduction
- 1.1. Research Scope
- 1.2. Market Segmentation
- 1.3. Research Methodology
- 1.4. Definitions and Assumptions
- 2. Executive Summary
- 2.1. Introduction
- 3. Market Dynamics
- 3.1. Introduction
- 3.2. Market Drivers
- 3.2.1. Increasing Applications of Augmented Reality; High Demand for Mobile-based Augmented Reality
- 3.3. Market Restrains
- 3.3.1. Security Issues Associated with Mobile Payments
- 3.4. Market Trends
- 3.4.1. Hardware to Exhibit Higher Growth
- 4. Market Factor Analysis
- 4.1. Porters Five Forces
- 4.2. Supply/Value Chain
- 4.3. PESTEL analysis
- 4.4. Market Entropy
- 4.5. Patent/Trademark Analysis
- 5. Global Mobile Augmented Reality Market Analysis, Insights and Forecast, 2019-2031
- 5.1. Market Analysis, Insights and Forecast - by Type
- 5.1.1. Standalone
- 5.1.2. Tethered
- 5.1.3. Screenless Viewer
- 5.2. Market Analysis, Insights and Forecast - by End User
- 5.2.1. Gaming
- 5.2.2. Education
- 5.2.3. Healthcare
- 5.2.4. Retail and Marketing
- 5.2.5. Automotive
- 5.2.6. Military and Defense
- 5.2.7. Other End-user Verticals
- 5.3. Market Analysis, Insights and Forecast - by Software
- 5.3.1. Object Tracking
- 5.3.2. Image Recognition
- 5.3.3. Data Analytics
- 5.4. Market Analysis, Insights and Forecast - by Region
- 5.4.1. North America
- 5.4.2. Europe
- 5.4.3. Asia Pacific
- 5.4.4. Rest of the World
- 5.1. Market Analysis, Insights and Forecast - by Type
- 6. North America Mobile Augmented Reality Market Analysis, Insights and Forecast, 2019-2031
- 6.1. Market Analysis, Insights and Forecast - by Type
- 6.1.1. Standalone
- 6.1.2. Tethered
- 6.1.3. Screenless Viewer
- 6.2. Market Analysis, Insights and Forecast - by End User
- 6.2.1. Gaming
- 6.2.2. Education
- 6.2.3. Healthcare
- 6.2.4. Retail and Marketing
- 6.2.5. Automotive
- 6.2.6. Military and Defense
- 6.2.7. Other End-user Verticals
- 6.3. Market Analysis, Insights and Forecast - by Software
- 6.3.1. Object Tracking
- 6.3.2. Image Recognition
- 6.3.3. Data Analytics
- 6.1. Market Analysis, Insights and Forecast - by Type
- 7. Europe Mobile Augmented Reality Market Analysis, Insights and Forecast, 2019-2031
- 7.1. Market Analysis, Insights and Forecast - by Type
- 7.1.1. Standalone
- 7.1.2. Tethered
- 7.1.3. Screenless Viewer
- 7.2. Market Analysis, Insights and Forecast - by End User
- 7.2.1. Gaming
- 7.2.2. Education
- 7.2.3. Healthcare
- 7.2.4. Retail and Marketing
- 7.2.5. Automotive
- 7.2.6. Military and Defense
- 7.2.7. Other End-user Verticals
- 7.3. Market Analysis, Insights and Forecast - by Software
- 7.3.1. Object Tracking
- 7.3.2. Image Recognition
- 7.3.3. Data Analytics
- 7.1. Market Analysis, Insights and Forecast - by Type
- 8. Asia Pacific Mobile Augmented Reality Market Analysis, Insights and Forecast, 2019-2031
- 8.1. Market Analysis, Insights and Forecast - by Type
- 8.1.1. Standalone
- 8.1.2. Tethered
- 8.1.3. Screenless Viewer
- 8.2. Market Analysis, Insights and Forecast - by End User
- 8.2.1. Gaming
- 8.2.2. Education
- 8.2.3. Healthcare
- 8.2.4. Retail and Marketing
- 8.2.5. Automotive
- 8.2.6. Military and Defense
- 8.2.7. Other End-user Verticals
- 8.3. Market Analysis, Insights and Forecast - by Software
- 8.3.1. Object Tracking
- 8.3.2. Image Recognition
- 8.3.3. Data Analytics
- 8.1. Market Analysis, Insights and Forecast - by Type
- 9. Rest of the World Mobile Augmented Reality Market Analysis, Insights and Forecast, 2019-2031
- 9.1. Market Analysis, Insights and Forecast - by Type
- 9.1.1. Standalone
- 9.1.2. Tethered
- 9.1.3. Screenless Viewer
- 9.2. Market Analysis, Insights and Forecast - by End User
- 9.2.1. Gaming
- 9.2.2. Education
- 9.2.3. Healthcare
- 9.2.4. Retail and Marketing
- 9.2.5. Automotive
- 9.2.6. Military and Defense
- 9.2.7. Other End-user Verticals
- 9.3. Market Analysis, Insights and Forecast - by Software
- 9.3.1. Object Tracking
- 9.3.2. Image Recognition
- 9.3.3. Data Analytics
- 9.1. Market Analysis, Insights and Forecast - by Type
- 10. North America Mobile Augmented Reality Market Analysis, Insights and Forecast, 2019-2031
- 10.1. Market Analysis, Insights and Forecast - By Country/Sub-region
- 10.1.1 United States
- 10.1.2 Canada
- 10.1.3 Mexico
- 11. Europe Mobile Augmented Reality Market Analysis, Insights and Forecast, 2019-2031
- 11.1. Market Analysis, Insights and Forecast - By Country/Sub-region
- 11.1.1 Germany
- 11.1.2 United Kingdom
- 11.1.3 France
- 11.1.4 Spain
- 11.1.5 Italy
- 11.1.6 Spain
- 11.1.7 Belgium
- 11.1.8 Netherland
- 11.1.9 Nordics
- 11.1.10 Rest of Europe
- 12. Asia Pacific Mobile Augmented Reality Market Analysis, Insights and Forecast, 2019-2031
- 12.1. Market Analysis, Insights and Forecast - By Country/Sub-region
- 12.1.1 China
- 12.1.2 Japan
- 12.1.3 India
- 12.1.4 South Korea
- 12.1.5 Southeast Asia
- 12.1.6 Australia
- 12.1.7 Indonesia
- 12.1.8 Phillipes
- 12.1.9 Singapore
- 12.1.10 Thailandc
- 12.1.11 Rest of Asia Pacific
- 13. South America Mobile Augmented Reality Market Analysis, Insights and Forecast, 2019-2031
- 13.1. Market Analysis, Insights and Forecast - By Country/Sub-region
- 13.1.1 Brazil
- 13.1.2 Argentina
- 13.1.3 Peru
- 13.1.4 Chile
- 13.1.5 Colombia
- 13.1.6 Ecuador
- 13.1.7 Venezuela
- 13.1.8 Rest of South America
- 14. North America Mobile Augmented Reality Market Analysis, Insights and Forecast, 2019-2031
- 14.1. Market Analysis, Insights and Forecast - By Country/Sub-region
- 14.1.1 United States
- 14.1.2 Canada
- 14.1.3 Mexico
- 15. MEA Mobile Augmented Reality Market Analysis, Insights and Forecast, 2019-2031
- 15.1. Market Analysis, Insights and Forecast - By Country/Sub-region
- 15.1.1 United Arab Emirates
- 15.1.2 Saudi Arabia
- 15.1.3 South Africa
- 15.1.4 Rest of Middle East and Africa
- 16. Competitive Analysis
- 16.1. Global Market Share Analysis 2024
- 16.2. Company Profiles
- 16.2.1 Fujitsu Limited
- 16.2.1.1. Overview
- 16.2.1.2. Products
- 16.2.1.3. SWOT Analysis
- 16.2.1.4. Recent Developments
- 16.2.1.5. Financials (Based on Availability)
- 16.2.2 Lenovo Group Limited
- 16.2.2.1. Overview
- 16.2.2.2. Products
- 16.2.2.3. SWOT Analysis
- 16.2.2.4. Recent Developments
- 16.2.2.5. Financials (Based on Availability)
- 16.2.3 Vuzix Corporation
- 16.2.3.1. Overview
- 16.2.3.2. Products
- 16.2.3.3. SWOT Analysis
- 16.2.3.4. Recent Developments
- 16.2.3.5. Financials (Based on Availability)
- 16.2.4 Seiko Epson Corporation
- 16.2.4.1. Overview
- 16.2.4.2. Products
- 16.2.4.3. SWOT Analysis
- 16.2.4.4. Recent Developments
- 16.2.4.5. Financials (Based on Availability)
- 16.2.5 Google LLC (ALPHABET INC )
- 16.2.5.1. Overview
- 16.2.5.2. Products
- 16.2.5.3. SWOT Analysis
- 16.2.5.4. Recent Developments
- 16.2.5.5. Financials (Based on Availability)
- 16.2.6 Realwear Inc
- 16.2.6.1. Overview
- 16.2.6.2. Products
- 16.2.6.3. SWOT Analysis
- 16.2.6.4. Recent Developments
- 16.2.6.5. Financials (Based on Availability)
- 16.2.7 Kopin Corporation
- 16.2.7.1. Overview
- 16.2.7.2. Products
- 16.2.7.3. SWOT Analysis
- 16.2.7.4. Recent Developments
- 16.2.7.5. Financials (Based on Availability)
- 16.2.8 Optinvent
- 16.2.8.1. Overview
- 16.2.8.2. Products
- 16.2.8.3. SWOT Analysis
- 16.2.8.4. Recent Developments
- 16.2.8.5. Financials (Based on Availability)
- 16.2.9 Daqri
- 16.2.9.1. Overview
- 16.2.9.2. Products
- 16.2.9.3. SWOT Analysis
- 16.2.9.4. Recent Developments
- 16.2.9.5. Financials (Based on Availability)
- 16.2.10 Dynabook Europe GmbH
- 16.2.10.1. Overview
- 16.2.10.2. Products
- 16.2.10.3. SWOT Analysis
- 16.2.10.4. Recent Developments
- 16.2.10.5. Financials (Based on Availability)
- 16.2.1 Fujitsu Limited
List of Figures
- Figure 1: Global Mobile Augmented Reality Market Revenue Breakdown (Million, %) by Region 2024 & 2032
- Figure 2: Global Mobile Augmented Reality Market Volume Breakdown (K Unit, %) by Region 2024 & 2032
- Figure 3: North America Mobile Augmented Reality Market Revenue (Million), by Country 2024 & 2032
- Figure 4: North America Mobile Augmented Reality Market Volume (K Unit), by Country 2024 & 2032
- Figure 5: North America Mobile Augmented Reality Market Revenue Share (%), by Country 2024 & 2032
- Figure 6: North America Mobile Augmented Reality Market Volume Share (%), by Country 2024 & 2032
- Figure 7: Europe Mobile Augmented Reality Market Revenue (Million), by Country 2024 & 2032
- Figure 8: Europe Mobile Augmented Reality Market Volume (K Unit), by Country 2024 & 2032
- Figure 9: Europe Mobile Augmented Reality Market Revenue Share (%), by Country 2024 & 2032
- Figure 10: Europe Mobile Augmented Reality Market Volume Share (%), by Country 2024 & 2032
- Figure 11: Asia Pacific Mobile Augmented Reality Market Revenue (Million), by Country 2024 & 2032
- Figure 12: Asia Pacific Mobile Augmented Reality Market Volume (K Unit), by Country 2024 & 2032
- Figure 13: Asia Pacific Mobile Augmented Reality Market Revenue Share (%), by Country 2024 & 2032
- Figure 14: Asia Pacific Mobile Augmented Reality Market Volume Share (%), by Country 2024 & 2032
- Figure 15: South America Mobile Augmented Reality Market Revenue (Million), by Country 2024 & 2032
- Figure 16: South America Mobile Augmented Reality Market Volume (K Unit), by Country 2024 & 2032
- Figure 17: South America Mobile Augmented Reality Market Revenue Share (%), by Country 2024 & 2032
- Figure 18: South America Mobile Augmented Reality Market Volume Share (%), by Country 2024 & 2032
- Figure 19: North America Mobile Augmented Reality Market Revenue (Million), by Country 2024 & 2032
- Figure 20: North America Mobile Augmented Reality Market Volume (K Unit), by Country 2024 & 2032
- Figure 21: North America Mobile Augmented Reality Market Revenue Share (%), by Country 2024 & 2032
- Figure 22: North America Mobile Augmented Reality Market Volume Share (%), by Country 2024 & 2032
- Figure 23: MEA Mobile Augmented Reality Market Revenue (Million), by Country 2024 & 2032
- Figure 24: MEA Mobile Augmented Reality Market Volume (K Unit), by Country 2024 & 2032
- Figure 25: MEA Mobile Augmented Reality Market Revenue Share (%), by Country 2024 & 2032
- Figure 26: MEA Mobile Augmented Reality Market Volume Share (%), by Country 2024 & 2032
- Figure 27: North America Mobile Augmented Reality Market Revenue (Million), by Type 2024 & 2032
- Figure 28: North America Mobile Augmented Reality Market Volume (K Unit), by Type 2024 & 2032
- Figure 29: North America Mobile Augmented Reality Market Revenue Share (%), by Type 2024 & 2032
- Figure 30: North America Mobile Augmented Reality Market Volume Share (%), by Type 2024 & 2032
- Figure 31: North America Mobile Augmented Reality Market Revenue (Million), by End User 2024 & 2032
- Figure 32: North America Mobile Augmented Reality Market Volume (K Unit), by End User 2024 & 2032
- Figure 33: North America Mobile Augmented Reality Market Revenue Share (%), by End User 2024 & 2032
- Figure 34: North America Mobile Augmented Reality Market Volume Share (%), by End User 2024 & 2032
- Figure 35: North America Mobile Augmented Reality Market Revenue (Million), by Software 2024 & 2032
- Figure 36: North America Mobile Augmented Reality Market Volume (K Unit), by Software 2024 & 2032
- Figure 37: North America Mobile Augmented Reality Market Revenue Share (%), by Software 2024 & 2032
- Figure 38: North America Mobile Augmented Reality Market Volume Share (%), by Software 2024 & 2032
- Figure 39: North America Mobile Augmented Reality Market Revenue (Million), by Country 2024 & 2032
- Figure 40: North America Mobile Augmented Reality Market Volume (K Unit), by Country 2024 & 2032
- Figure 41: North America Mobile Augmented Reality Market Revenue Share (%), by Country 2024 & 2032
- Figure 42: North America Mobile Augmented Reality Market Volume Share (%), by Country 2024 & 2032
- Figure 43: Europe Mobile Augmented Reality Market Revenue (Million), by Type 2024 & 2032
- Figure 44: Europe Mobile Augmented Reality Market Volume (K Unit), by Type 2024 & 2032
- Figure 45: Europe Mobile Augmented Reality Market Revenue Share (%), by Type 2024 & 2032
- Figure 46: Europe Mobile Augmented Reality Market Volume Share (%), by Type 2024 & 2032
- Figure 47: Europe Mobile Augmented Reality Market Revenue (Million), by End User 2024 & 2032
- Figure 48: Europe Mobile Augmented Reality Market Volume (K Unit), by End User 2024 & 2032
- Figure 49: Europe Mobile Augmented Reality Market Revenue Share (%), by End User 2024 & 2032
- Figure 50: Europe Mobile Augmented Reality Market Volume Share (%), by End User 2024 & 2032
- Figure 51: Europe Mobile Augmented Reality Market Revenue (Million), by Software 2024 & 2032
- Figure 52: Europe Mobile Augmented Reality Market Volume (K Unit), by Software 2024 & 2032
- Figure 53: Europe Mobile Augmented Reality Market Revenue Share (%), by Software 2024 & 2032
- Figure 54: Europe Mobile Augmented Reality Market Volume Share (%), by Software 2024 & 2032
- Figure 55: Europe Mobile Augmented Reality Market Revenue (Million), by Country 2024 & 2032
- Figure 56: Europe Mobile Augmented Reality Market Volume (K Unit), by Country 2024 & 2032
- Figure 57: Europe Mobile Augmented Reality Market Revenue Share (%), by Country 2024 & 2032
- Figure 58: Europe Mobile Augmented Reality Market Volume Share (%), by Country 2024 & 2032
- Figure 59: Asia Pacific Mobile Augmented Reality Market Revenue (Million), by Type 2024 & 2032
- Figure 60: Asia Pacific Mobile Augmented Reality Market Volume (K Unit), by Type 2024 & 2032
- Figure 61: Asia Pacific Mobile Augmented Reality Market Revenue Share (%), by Type 2024 & 2032
- Figure 62: Asia Pacific Mobile Augmented Reality Market Volume Share (%), by Type 2024 & 2032
- Figure 63: Asia Pacific Mobile Augmented Reality Market Revenue (Million), by End User 2024 & 2032
- Figure 64: Asia Pacific Mobile Augmented Reality Market Volume (K Unit), by End User 2024 & 2032
- Figure 65: Asia Pacific Mobile Augmented Reality Market Revenue Share (%), by End User 2024 & 2032
- Figure 66: Asia Pacific Mobile Augmented Reality Market Volume Share (%), by End User 2024 & 2032
- Figure 67: Asia Pacific Mobile Augmented Reality Market Revenue (Million), by Software 2024 & 2032
- Figure 68: Asia Pacific Mobile Augmented Reality Market Volume (K Unit), by Software 2024 & 2032
- Figure 69: Asia Pacific Mobile Augmented Reality Market Revenue Share (%), by Software 2024 & 2032
- Figure 70: Asia Pacific Mobile Augmented Reality Market Volume Share (%), by Software 2024 & 2032
- Figure 71: Asia Pacific Mobile Augmented Reality Market Revenue (Million), by Country 2024 & 2032
- Figure 72: Asia Pacific Mobile Augmented Reality Market Volume (K Unit), by Country 2024 & 2032
- Figure 73: Asia Pacific Mobile Augmented Reality Market Revenue Share (%), by Country 2024 & 2032
- Figure 74: Asia Pacific Mobile Augmented Reality Market Volume Share (%), by Country 2024 & 2032
- Figure 75: Rest of the World Mobile Augmented Reality Market Revenue (Million), by Type 2024 & 2032
- Figure 76: Rest of the World Mobile Augmented Reality Market Volume (K Unit), by Type 2024 & 2032
- Figure 77: Rest of the World Mobile Augmented Reality Market Revenue Share (%), by Type 2024 & 2032
- Figure 78: Rest of the World Mobile Augmented Reality Market Volume Share (%), by Type 2024 & 2032
- Figure 79: Rest of the World Mobile Augmented Reality Market Revenue (Million), by End User 2024 & 2032
- Figure 80: Rest of the World Mobile Augmented Reality Market Volume (K Unit), by End User 2024 & 2032
- Figure 81: Rest of the World Mobile Augmented Reality Market Revenue Share (%), by End User 2024 & 2032
- Figure 82: Rest of the World Mobile Augmented Reality Market Volume Share (%), by End User 2024 & 2032
- Figure 83: Rest of the World Mobile Augmented Reality Market Revenue (Million), by Software 2024 & 2032
- Figure 84: Rest of the World Mobile Augmented Reality Market Volume (K Unit), by Software 2024 & 2032
- Figure 85: Rest of the World Mobile Augmented Reality Market Revenue Share (%), by Software 2024 & 2032
- Figure 86: Rest of the World Mobile Augmented Reality Market Volume Share (%), by Software 2024 & 2032
- Figure 87: Rest of the World Mobile Augmented Reality Market Revenue (Million), by Country 2024 & 2032
- Figure 88: Rest of the World Mobile Augmented Reality Market Volume (K Unit), by Country 2024 & 2032
- Figure 89: Rest of the World Mobile Augmented Reality Market Revenue Share (%), by Country 2024 & 2032
- Figure 90: Rest of the World Mobile Augmented Reality Market Volume Share (%), by Country 2024 & 2032
List of Tables
- Table 1: Global Mobile Augmented Reality Market Revenue Million Forecast, by Region 2019 & 2032
- Table 2: Global Mobile Augmented Reality Market Volume K Unit Forecast, by Region 2019 & 2032
- Table 3: Global Mobile Augmented Reality Market Revenue Million Forecast, by Type 2019 & 2032
- Table 4: Global Mobile Augmented Reality Market Volume K Unit Forecast, by Type 2019 & 2032
- Table 5: Global Mobile Augmented Reality Market Revenue Million Forecast, by End User 2019 & 2032
- Table 6: Global Mobile Augmented Reality Market Volume K Unit Forecast, by End User 2019 & 2032
- Table 7: Global Mobile Augmented Reality Market Revenue Million Forecast, by Software 2019 & 2032
- Table 8: Global Mobile Augmented Reality Market Volume K Unit Forecast, by Software 2019 & 2032
- Table 9: Global Mobile Augmented Reality Market Revenue Million Forecast, by Region 2019 & 2032
- Table 10: Global Mobile Augmented Reality Market Volume K Unit Forecast, by Region 2019 & 2032
- Table 11: Global Mobile Augmented Reality Market Revenue Million Forecast, by Country 2019 & 2032
- Table 12: Global Mobile Augmented Reality Market Volume K Unit Forecast, by Country 2019 & 2032
- Table 13: United States Mobile Augmented Reality Market Revenue (Million) Forecast, by Application 2019 & 2032
- Table 14: United States Mobile Augmented Reality Market Volume (K Unit) Forecast, by Application 2019 & 2032
- Table 15: Canada Mobile Augmented Reality Market Revenue (Million) Forecast, by Application 2019 & 2032
- Table 16: Canada Mobile Augmented Reality Market Volume (K Unit) Forecast, by Application 2019 & 2032
- Table 17: Mexico Mobile Augmented Reality Market Revenue (Million) Forecast, by Application 2019 & 2032
- Table 18: Mexico Mobile Augmented Reality Market Volume (K Unit) Forecast, by Application 2019 & 2032
- Table 19: Global Mobile Augmented Reality Market Revenue Million Forecast, by Country 2019 & 2032
- Table 20: Global Mobile Augmented Reality Market Volume K Unit Forecast, by Country 2019 & 2032
- Table 21: Germany Mobile Augmented Reality Market Revenue (Million) Forecast, by Application 2019 & 2032
- Table 22: Germany Mobile Augmented Reality Market Volume (K Unit) Forecast, by Application 2019 & 2032
- Table 23: United Kingdom Mobile Augmented Reality Market Revenue (Million) Forecast, by Application 2019 & 2032
- Table 24: United Kingdom Mobile Augmented Reality Market Volume (K Unit) Forecast, by Application 2019 & 2032
- Table 25: France Mobile Augmented Reality Market Revenue (Million) Forecast, by Application 2019 & 2032
- Table 26: France Mobile Augmented Reality Market Volume (K Unit) Forecast, by Application 2019 & 2032
- Table 27: Spain Mobile Augmented Reality Market Revenue (Million) Forecast, by Application 2019 & 2032
- Table 28: Spain Mobile Augmented Reality Market Volume (K Unit) Forecast, by Application 2019 & 2032
- Table 29: Italy Mobile Augmented Reality Market Revenue (Million) Forecast, by Application 2019 & 2032
- Table 30: Italy Mobile Augmented Reality Market Volume (K Unit) Forecast, by Application 2019 & 2032
- Table 31: Spain Mobile Augmented Reality Market Revenue (Million) Forecast, by Application 2019 & 2032
- Table 32: Spain Mobile Augmented Reality Market Volume (K Unit) Forecast, by Application 2019 & 2032
- Table 33: Belgium Mobile Augmented Reality Market Revenue (Million) Forecast, by Application 2019 & 2032
- Table 34: Belgium Mobile Augmented Reality Market Volume (K Unit) Forecast, by Application 2019 & 2032
- Table 35: Netherland Mobile Augmented Reality Market Revenue (Million) Forecast, by Application 2019 & 2032
- Table 36: Netherland Mobile Augmented Reality Market Volume (K Unit) Forecast, by Application 2019 & 2032
- Table 37: Nordics Mobile Augmented Reality Market Revenue (Million) Forecast, by Application 2019 & 2032
- Table 38: Nordics Mobile Augmented Reality Market Volume (K Unit) Forecast, by Application 2019 & 2032
- Table 39: Rest of Europe Mobile Augmented Reality Market Revenue (Million) Forecast, by Application 2019 & 2032
- Table 40: Rest of Europe Mobile Augmented Reality Market Volume (K Unit) Forecast, by Application 2019 & 2032
- Table 41: Global Mobile Augmented Reality Market Revenue Million Forecast, by Country 2019 & 2032
- Table 42: Global Mobile Augmented Reality Market Volume K Unit Forecast, by Country 2019 & 2032
- Table 43: China Mobile Augmented Reality Market Revenue (Million) Forecast, by Application 2019 & 2032
- Table 44: China Mobile Augmented Reality Market Volume (K Unit) Forecast, by Application 2019 & 2032
- Table 45: Japan Mobile Augmented Reality Market Revenue (Million) Forecast, by Application 2019 & 2032
- Table 46: Japan Mobile Augmented Reality Market Volume (K Unit) Forecast, by Application 2019 & 2032
- Table 47: India Mobile Augmented Reality Market Revenue (Million) Forecast, by Application 2019 & 2032
- Table 48: India Mobile Augmented Reality Market Volume (K Unit) Forecast, by Application 2019 & 2032
- Table 49: South Korea Mobile Augmented Reality Market Revenue (Million) Forecast, by Application 2019 & 2032
- Table 50: South Korea Mobile Augmented Reality Market Volume (K Unit) Forecast, by Application 2019 & 2032
- Table 51: Southeast Asia Mobile Augmented Reality Market Revenue (Million) Forecast, by Application 2019 & 2032
- Table 52: Southeast Asia Mobile Augmented Reality Market Volume (K Unit) Forecast, by Application 2019 & 2032
- Table 53: Australia Mobile Augmented Reality Market Revenue (Million) Forecast, by Application 2019 & 2032
- Table 54: Australia Mobile Augmented Reality Market Volume (K Unit) Forecast, by Application 2019 & 2032
- Table 55: Indonesia Mobile Augmented Reality Market Revenue (Million) Forecast, by Application 2019 & 2032
- Table 56: Indonesia Mobile Augmented Reality Market Volume (K Unit) Forecast, by Application 2019 & 2032
- Table 57: Phillipes Mobile Augmented Reality Market Revenue (Million) Forecast, by Application 2019 & 2032
- Table 58: Phillipes Mobile Augmented Reality Market Volume (K Unit) Forecast, by Application 2019 & 2032
- Table 59: Singapore Mobile Augmented Reality Market Revenue (Million) Forecast, by Application 2019 & 2032
- Table 60: Singapore Mobile Augmented Reality Market Volume (K Unit) Forecast, by Application 2019 & 2032
- Table 61: Thailandc Mobile Augmented Reality Market Revenue (Million) Forecast, by Application 2019 & 2032
- Table 62: Thailandc Mobile Augmented Reality Market Volume (K Unit) Forecast, by Application 2019 & 2032
- Table 63: Rest of Asia Pacific Mobile Augmented Reality Market Revenue (Million) Forecast, by Application 2019 & 2032
- Table 64: Rest of Asia Pacific Mobile Augmented Reality Market Volume (K Unit) Forecast, by Application 2019 & 2032
- Table 65: Global Mobile Augmented Reality Market Revenue Million Forecast, by Country 2019 & 2032
- Table 66: Global Mobile Augmented Reality Market Volume K Unit Forecast, by Country 2019 & 2032
- Table 67: Brazil Mobile Augmented Reality Market Revenue (Million) Forecast, by Application 2019 & 2032
- Table 68: Brazil Mobile Augmented Reality Market Volume (K Unit) Forecast, by Application 2019 & 2032
- Table 69: Argentina Mobile Augmented Reality Market Revenue (Million) Forecast, by Application 2019 & 2032
- Table 70: Argentina Mobile Augmented Reality Market Volume (K Unit) Forecast, by Application 2019 & 2032
- Table 71: Peru Mobile Augmented Reality Market Revenue (Million) Forecast, by Application 2019 & 2032
- Table 72: Peru Mobile Augmented Reality Market Volume (K Unit) Forecast, by Application 2019 & 2032
- Table 73: Chile Mobile Augmented Reality Market Revenue (Million) Forecast, by Application 2019 & 2032
- Table 74: Chile Mobile Augmented Reality Market Volume (K Unit) Forecast, by Application 2019 & 2032
- Table 75: Colombia Mobile Augmented Reality Market Revenue (Million) Forecast, by Application 2019 & 2032
- Table 76: Colombia Mobile Augmented Reality Market Volume (K Unit) Forecast, by Application 2019 & 2032
- Table 77: Ecuador Mobile Augmented Reality Market Revenue (Million) Forecast, by Application 2019 & 2032
- Table 78: Ecuador Mobile Augmented Reality Market Volume (K Unit) Forecast, by Application 2019 & 2032
- Table 79: Venezuela Mobile Augmented Reality Market Revenue (Million) Forecast, by Application 2019 & 2032
- Table 80: Venezuela Mobile Augmented Reality Market Volume (K Unit) Forecast, by Application 2019 & 2032
- Table 81: Rest of South America Mobile Augmented Reality Market Revenue (Million) Forecast, by Application 2019 & 2032
- Table 82: Rest of South America Mobile Augmented Reality Market Volume (K Unit) Forecast, by Application 2019 & 2032
- Table 83: Global Mobile Augmented Reality Market Revenue Million Forecast, by Country 2019 & 2032
- Table 84: Global Mobile Augmented Reality Market Volume K Unit Forecast, by Country 2019 & 2032
- Table 85: United States Mobile Augmented Reality Market Revenue (Million) Forecast, by Application 2019 & 2032
- Table 86: United States Mobile Augmented Reality Market Volume (K Unit) Forecast, by Application 2019 & 2032
- Table 87: Canada Mobile Augmented Reality Market Revenue (Million) Forecast, by Application 2019 & 2032
- Table 88: Canada Mobile Augmented Reality Market Volume (K Unit) Forecast, by Application 2019 & 2032
- Table 89: Mexico Mobile Augmented Reality Market Revenue (Million) Forecast, by Application 2019 & 2032
- Table 90: Mexico Mobile Augmented Reality Market Volume (K Unit) Forecast, by Application 2019 & 2032
- Table 91: Global Mobile Augmented Reality Market Revenue Million Forecast, by Country 2019 & 2032
- Table 92: Global Mobile Augmented Reality Market Volume K Unit Forecast, by Country 2019 & 2032
- Table 93: United Arab Emirates Mobile Augmented Reality Market Revenue (Million) Forecast, by Application 2019 & 2032
- Table 94: United Arab Emirates Mobile Augmented Reality Market Volume (K Unit) Forecast, by Application 2019 & 2032
- Table 95: Saudi Arabia Mobile Augmented Reality Market Revenue (Million) Forecast, by Application 2019 & 2032
- Table 96: Saudi Arabia Mobile Augmented Reality Market Volume (K Unit) Forecast, by Application 2019 & 2032
- Table 97: South Africa Mobile Augmented Reality Market Revenue (Million) Forecast, by Application 2019 & 2032
- Table 98: South Africa Mobile Augmented Reality Market Volume (K Unit) Forecast, by Application 2019 & 2032
- Table 99: Rest of Middle East and Africa Mobile Augmented Reality Market Revenue (Million) Forecast, by Application 2019 & 2032
- Table 100: Rest of Middle East and Africa Mobile Augmented Reality Market Volume (K Unit) Forecast, by Application 2019 & 2032
- Table 101: Global Mobile Augmented Reality Market Revenue Million Forecast, by Type 2019 & 2032
- Table 102: Global Mobile Augmented Reality Market Volume K Unit Forecast, by Type 2019 & 2032
- Table 103: Global Mobile Augmented Reality Market Revenue Million Forecast, by End User 2019 & 2032
- Table 104: Global Mobile Augmented Reality Market Volume K Unit Forecast, by End User 2019 & 2032
- Table 105: Global Mobile Augmented Reality Market Revenue Million Forecast, by Software 2019 & 2032
- Table 106: Global Mobile Augmented Reality Market Volume K Unit Forecast, by Software 2019 & 2032
- Table 107: Global Mobile Augmented Reality Market Revenue Million Forecast, by Country 2019 & 2032
- Table 108: Global Mobile Augmented Reality Market Volume K Unit Forecast, by Country 2019 & 2032
- Table 109: US Mobile Augmented Reality Market Revenue (Million) Forecast, by Application 2019 & 2032
- Table 110: US Mobile Augmented Reality Market Volume (K Unit) Forecast, by Application 2019 & 2032
- Table 111: Canada Mobile Augmented Reality Market Revenue (Million) Forecast, by Application 2019 & 2032
- Table 112: Canada Mobile Augmented Reality Market Volume (K Unit) Forecast, by Application 2019 & 2032
- Table 113: Global Mobile Augmented Reality Market Revenue Million Forecast, by Type 2019 & 2032
- Table 114: Global Mobile Augmented Reality Market Volume K Unit Forecast, by Type 2019 & 2032
- Table 115: Global Mobile Augmented Reality Market Revenue Million Forecast, by End User 2019 & 2032
- Table 116: Global Mobile Augmented Reality Market Volume K Unit Forecast, by End User 2019 & 2032
- Table 117: Global Mobile Augmented Reality Market Revenue Million Forecast, by Software 2019 & 2032
- Table 118: Global Mobile Augmented Reality Market Volume K Unit Forecast, by Software 2019 & 2032
- Table 119: Global Mobile Augmented Reality Market Revenue Million Forecast, by Country 2019 & 2032
- Table 120: Global Mobile Augmented Reality Market Volume K Unit Forecast, by Country 2019 & 2032
- Table 121: Germany Mobile Augmented Reality Market Revenue (Million) Forecast, by Application 2019 & 2032
- Table 122: Germany Mobile Augmented Reality Market Volume (K Unit) Forecast, by Application 2019 & 2032
- Table 123: UK Mobile Augmented Reality Market Revenue (Million) Forecast, by Application 2019 & 2032
- Table 124: UK Mobile Augmented Reality Market Volume (K Unit) Forecast, by Application 2019 & 2032
- Table 125: France Mobile Augmented Reality Market Revenue (Million) Forecast, by Application 2019 & 2032
- Table 126: France Mobile Augmented Reality Market Volume (K Unit) Forecast, by Application 2019 & 2032
- Table 127: Italy Mobile Augmented Reality Market Revenue (Million) Forecast, by Application 2019 & 2032
- Table 128: Italy Mobile Augmented Reality Market Volume (K Unit) Forecast, by Application 2019 & 2032
- Table 129: Rest of Europe Mobile Augmented Reality Market Revenue (Million) Forecast, by Application 2019 & 2032
- Table 130: Rest of Europe Mobile Augmented Reality Market Volume (K Unit) Forecast, by Application 2019 & 2032
- Table 131: Global Mobile Augmented Reality Market Revenue Million Forecast, by Type 2019 & 2032
- Table 132: Global Mobile Augmented Reality Market Volume K Unit Forecast, by Type 2019 & 2032
- Table 133: Global Mobile Augmented Reality Market Revenue Million Forecast, by End User 2019 & 2032
- Table 134: Global Mobile Augmented Reality Market Volume K Unit Forecast, by End User 2019 & 2032
- Table 135: Global Mobile Augmented Reality Market Revenue Million Forecast, by Software 2019 & 2032
- Table 136: Global Mobile Augmented Reality Market Volume K Unit Forecast, by Software 2019 & 2032
- Table 137: Global Mobile Augmented Reality Market Revenue Million Forecast, by Country 2019 & 2032
- Table 138: Global Mobile Augmented Reality Market Volume K Unit Forecast, by Country 2019 & 2032
- Table 139: India Mobile Augmented Reality Market Revenue (Million) Forecast, by Application 2019 & 2032
- Table 140: India Mobile Augmented Reality Market Volume (K Unit) Forecast, by Application 2019 & 2032
- Table 141: China Mobile Augmented Reality Market Revenue (Million) Forecast, by Application 2019 & 2032
- Table 142: China Mobile Augmented Reality Market Volume (K Unit) Forecast, by Application 2019 & 2032
- Table 143: Japan Mobile Augmented Reality Market Revenue (Million) Forecast, by Application 2019 & 2032
- Table 144: Japan Mobile Augmented Reality Market Volume (K Unit) Forecast, by Application 2019 & 2032
- Table 145: Rest of Asia Pacific Mobile Augmented Reality Market Revenue (Million) Forecast, by Application 2019 & 2032
- Table 146: Rest of Asia Pacific Mobile Augmented Reality Market Volume (K Unit) Forecast, by Application 2019 & 2032
- Table 147: Global Mobile Augmented Reality Market Revenue Million Forecast, by Type 2019 & 2032
- Table 148: Global Mobile Augmented Reality Market Volume K Unit Forecast, by Type 2019 & 2032
- Table 149: Global Mobile Augmented Reality Market Revenue Million Forecast, by End User 2019 & 2032
- Table 150: Global Mobile Augmented Reality Market Volume K Unit Forecast, by End User 2019 & 2032
- Table 151: Global Mobile Augmented Reality Market Revenue Million Forecast, by Software 2019 & 2032
- Table 152: Global Mobile Augmented Reality Market Volume K Unit Forecast, by Software 2019 & 2032
- Table 153: Global Mobile Augmented Reality Market Revenue Million Forecast, by Country 2019 & 2032
- Table 154: Global Mobile Augmented Reality Market Volume K Unit Forecast, by Country 2019 & 2032
Frequently Asked Questions
1. What is the projected Compound Annual Growth Rate (CAGR) of the Mobile Augmented Reality Market?
The projected CAGR is approximately 42.36%.
2. Which companies are prominent players in the Mobile Augmented Reality Market?
Key companies in the market include Fujitsu Limited, Lenovo Group Limited, Vuzix Corporation, Seiko Epson Corporation, Google LLC (ALPHABET INC ), Realwear Inc, Kopin Corporation, Optinvent, Daqri, Dynabook Europe GmbH.
3. What are the main segments of the Mobile Augmented Reality Market?
The market segments include Type, End User, Software.
4. Can you provide details about the market size?
The market size is estimated to be USD 42.48 Million as of 2022.
5. What are some drivers contributing to market growth?
Increasing Applications of Augmented Reality; High Demand for Mobile-based Augmented Reality.
6. What are the notable trends driving market growth?
Hardware to Exhibit Higher Growth.
7. Are there any restraints impacting market growth?
Security Issues Associated with Mobile Payments.
8. Can you provide examples of recent developments in the market?
January 2022 - Qualcomm and Microsoft announced a partnership to advance and accelerate augmented reality and open up new portals to the metaverse. The businesses will work together to design unique augmented reality chips and integrate software platforms.
9. What pricing options are available for accessing the report?
Pricing options include single-user, multi-user, and enterprise licenses priced at USD 4750, USD 5250, and USD 8750 respectively.
10. Is the market size provided in terms of value or volume?
The market size is provided in terms of value, measured in Million and volume, measured in K Unit.
11. Are there any specific market keywords associated with the report?
Yes, the market keyword associated with the report is "Mobile Augmented Reality Market," which aids in identifying and referencing the specific market segment covered.
12. How do I determine which pricing option suits my needs best?
The pricing options vary based on user requirements and access needs. Individual users may opt for single-user licenses, while businesses requiring broader access may choose multi-user or enterprise licenses for cost-effective access to the report.
13. Are there any additional resources or data provided in the Mobile Augmented Reality Market report?
While the report offers comprehensive insights, it's advisable to review the specific contents or supplementary materials provided to ascertain if additional resources or data are available.
14. How can I stay updated on further developments or reports in the Mobile Augmented Reality Market?
To stay informed about further developments, trends, and reports in the Mobile Augmented Reality Market, consider subscribing to industry newsletters, following relevant companies and organizations, or regularly checking reputable industry news sources and publications.
Methodology
Step 1 - Identification of Relevant Samples Size from Population Database


Step 2 - Approaches for Defining Global Market Size (Value, Volume* & Price*)

Note*: In applicable scenarios
Step 3 - Data Sources
Primary Research
- Web Analytics
- Survey Reports
- Research Institute
- Latest Research Reports
- Opinion Leaders
Secondary Research
- Annual Reports
- White Paper
- Latest Press Release
- Industry Association
- Paid Database
- Investor Presentations

Step 4 - Data Triangulation
Involves using different sources of information in order to increase the validity of a study
These sources are likely to be stakeholders in a program - participants, other researchers, program staff, other community members, and so on.
Then we put all data in single framework & apply various statistical tools to find out the dynamic on the market.
During the analysis stage, feedback from the stakeholder groups would be compared to determine areas of agreement as well as areas of divergence
