

Key Insights
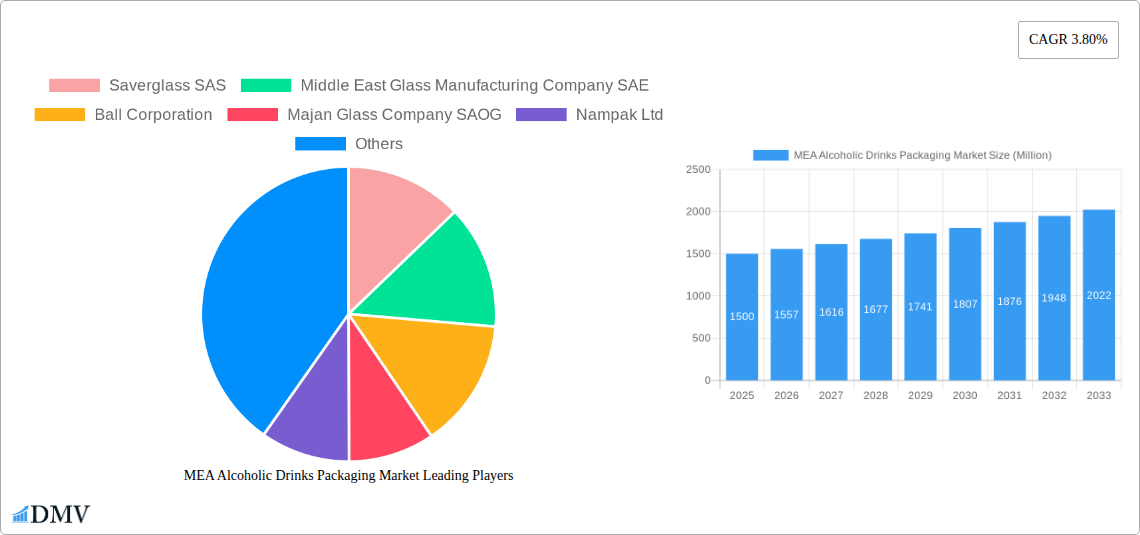
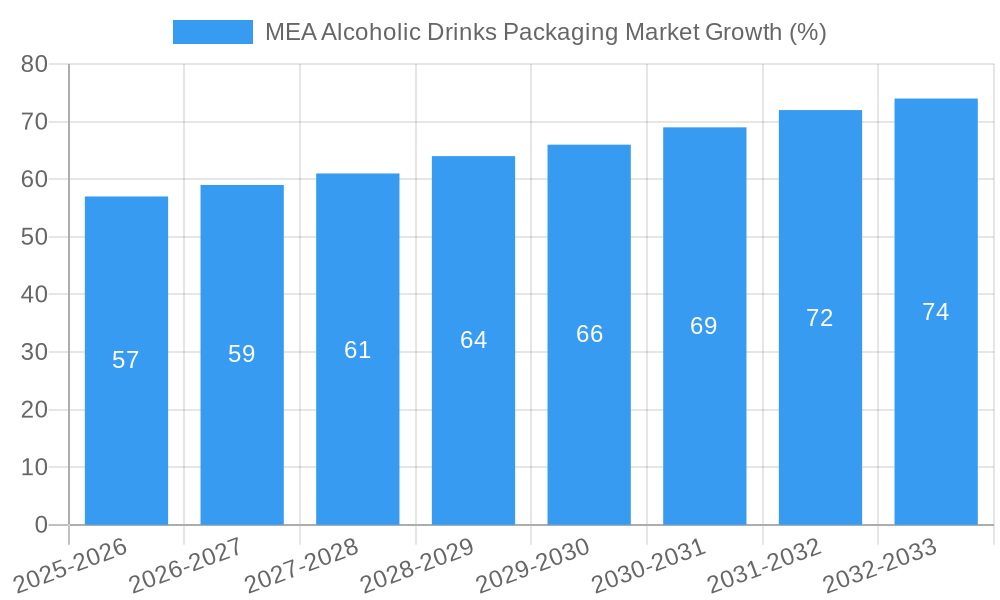
The Middle East and Africa (MEA) alcoholic drinks packaging market is experiencing steady growth, projected to maintain a Compound Annual Growth Rate (CAGR) of 3.80% from 2025 to 2033. This expansion is fueled by several key factors. Rising disposable incomes across several MEA nations are driving increased alcohol consumption, particularly in urban areas. The burgeoning tourism sector also contributes significantly to market growth, as it increases demand for convenient and attractive packaging solutions for alcoholic beverages. Furthermore, evolving consumer preferences towards premiumization and sustainable packaging options are shaping market trends. Glass continues to dominate as the primary material, preferred for its perceived quality and aesthetic appeal, especially for premium spirits and wines. However, the growing environmental concerns are driving increased adoption of lightweight and recyclable alternatives such as aluminum cans and innovative plastic packaging solutions. Market segmentation by alcoholic product type reveals significant growth in the wine and spirits categories, reflecting a shift towards more diverse alcoholic beverage choices among consumers. The market is also witnessing increasing investment in advanced packaging technologies, including tamper-evident seals and innovative labeling solutions, to enhance product security and brand appeal. Major players in the MEA alcoholic drinks packaging market are strategically focusing on expanding their production capacity, forging strategic partnerships, and investing in research and development to capitalize on these market trends.
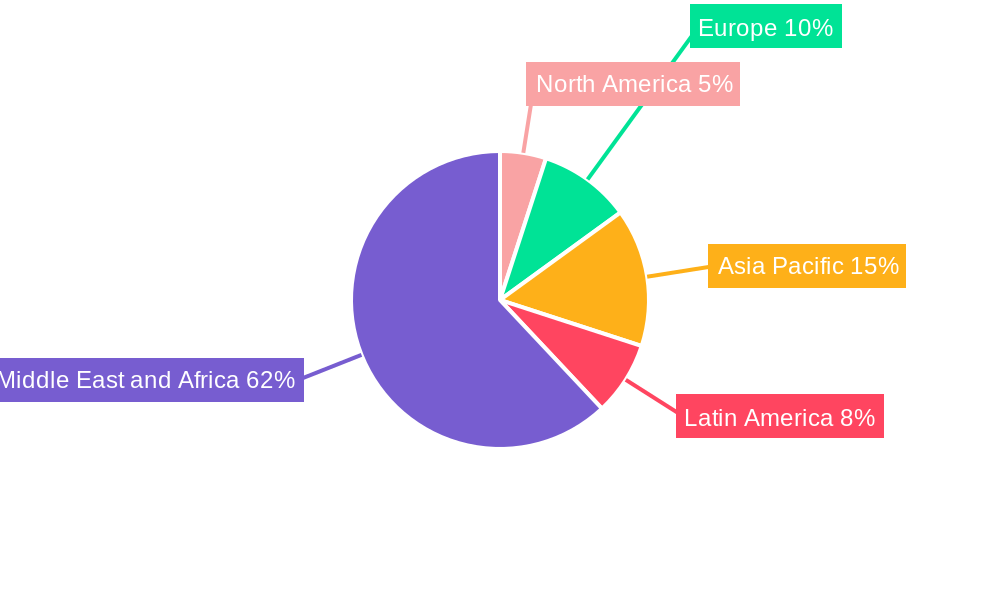
Regional variations exist within the MEA market. While countries like the United Arab Emirates and South Africa are currently leading in terms of market size and consumption, other regions demonstrate considerable growth potential. The rising middle class and increasing urbanization in countries like Egypt and Turkey are expected to propel future growth in those markets. Competition is intense, with both international and domestic players vying for market share. The long-term outlook for the MEA alcoholic drinks packaging market remains positive, with continued expansion projected over the forecast period, driven by both economic growth and evolving consumer preferences. However, challenges remain, including fluctuating raw material prices and regulations concerning alcohol consumption and packaging materials in certain regions.
MEA Alcoholic Drinks Packaging Market: A Comprehensive Report (2019-2033)
This insightful report provides a detailed analysis of the Middle East and Africa (MEA) Alcoholic Drinks Packaging Market, offering a comprehensive overview of market trends, competitive dynamics, and future growth prospects. The study period spans from 2019 to 2033, with 2025 serving as the base and estimated year. The forecast period is 2025-2033, and the historical period covers 2019-2024. This report is crucial for stakeholders seeking to understand the evolving landscape of this dynamic market and make informed strategic decisions. The market is expected to reach xx Million by 2033.
MEA Alcoholic Drinks Packaging Market Market Composition & Trends
This section delves into the intricate composition of the MEA alcoholic drinks packaging market, examining its concentration, innovation drivers, regulatory environment, substitute products, end-user profiles, and mergers and acquisitions (M&A) activity. Market share distribution among key players is analyzed, revealing the competitive intensity and dominance patterns. The report incorporates detailed data on M&A deal values, offering a clear picture of the investment landscape.
- Market Concentration: The MEA alcoholic drinks packaging market exhibits a [Describe Market Concentration: e.g., moderately concentrated] structure with [Number] major players holding a significant market share. The report details market share distribution for each segment.
- Innovation Catalysts: The demand for sustainable packaging solutions and the increasing adoption of lightweight materials are key innovation catalysts.
- Regulatory Landscape: Stringent regulations concerning alcohol content labeling, material safety, and sustainability are shaping the market.
- Substitute Products: The emergence of alternative packaging materials, such as biodegradable plastics and eco-friendly paperboard, is impacting the market share of traditional materials.
- End-User Profiles: The report profiles key end-users including breweries, wineries, distilleries, and distributors, analyzing their packaging preferences and demands.
- M&A Activity: Significant M&A activity in the market, including deals valued at xx Million, reflects the consolidation trend and strategic investments in growth. Examples include [mention specific deals and their impact].
MEA Alcoholic Drinks Packaging Market Industry Evolution
This section provides a detailed analysis of the MEA alcoholic drinks packaging market's evolutionary trajectory. It explores market growth trajectories, examining historical data and projecting future trends. Key technological advancements, such as the rising preference for lightweight and sustainable packaging solutions and their impact on market dynamics, are thoroughly analyzed. The changing consumer preferences and their influence on packaging choices are also discussed, supported by specific data points on growth rates and adoption metrics. For instance, the adoption of [Specific Technology, e.g., aluminum cans] is expected to grow at a CAGR of xx% during the forecast period.
Leading Regions, Countries, or Segments in MEA Alcoholic Drinks Packaging Market
This section identifies the dominant regions, countries, and segments within the MEA alcoholic drinks packaging market. It analyzes leading segments across primary materials (Glass, Metal, Plastic, Paper), alcoholic products (Wine, Spirits, Beer, Other), product types (Glass Bottles, Metal Cans, Plastic Bottles, Other), and countries (UAE, South Africa, Egypt, Turkey, Rest of MEA).
- By Primary Material: Glass remains dominant due to its perceived quality and aesthetic appeal, though metal packaging is gaining traction due to sustainability and cost-effectiveness.
- By Alcoholic Products: The Beer segment exhibits the highest demand for packaging, while the Wine segment is witnessing growth in premium packaging options.
- By Product Type: Glass bottles are the most prevalent, followed by metal cans and plastic bottles, which are challenged by environmental concerns.
- By Country: The UAE and South Africa are leading markets, driven by factors such as [Specific drivers for each region: e.g., strong tourism industry, growing disposable income]. Further details on these factors and regional analyses are provided.
- Key Drivers (Bullet points):
- High disposable incomes in certain regions (UAE, South Africa)
- Growing tourism in major markets
- Government support for local manufacturing (e.g., incentives)
- Increased consumer awareness of sustainability
MEA Alcoholic Drinks Packaging Market Product Innovations
Recent innovations include lightweight glass bottles reducing transportation costs, improved metal can coatings enhancing shelf life, and the increased use of recycled materials in packaging production, driving sustainable initiatives across the industry. These innovations offer enhanced durability, improved aesthetics, and reduced environmental impact, ultimately leading to increased customer satisfaction. The market continues to witness the introduction of innovative closures and labels to enhance product appeal.
Propelling Factors for MEA Alcoholic Drinks Packaging Market Growth
Several factors contribute to the MEA alcoholic drinks packaging market's growth. These include increased consumer spending on premium alcoholic beverages, a rise in the popularity of craft beers and spirits, and ongoing technological advancements in packaging materials and designs that provide better shelf-life and consumer convenience. Stringent environmental regulations are pushing adoption of sustainable packaging options, further stimulating market expansion. The growth of the e-commerce sector is increasing the demand for secure and convenient packaging solutions.
Obstacles in the MEA Alcoholic Drinks Packaging Market
The market faces challenges such as fluctuating raw material prices impacting production costs, disruptions in global supply chains potentially causing delays, and intense competition among numerous packaging manufacturers. Moreover, stringent regulatory compliance requirements and environmental concerns add to the complexity. These challenges, if not effectively managed, could potentially restrain the market growth rate by approximately xx% in the next few years.
Future Opportunities in MEA Alcoholic Drinks Packaging Market
The market presents significant opportunities for growth. Expanding into new markets within the MEA region, capitalizing on the rising demand for sustainable and innovative packaging solutions, and focusing on the burgeoning e-commerce sector are key avenues for expansion. Furthermore, the development of customized packaging solutions tailored to specific alcoholic beverages can unlock new revenue streams.
Major Players in the MEA Alcoholic Drinks Packaging Market Ecosystem
- Saverglass SAS
- Middle East Glass Manufacturing Company SAE
- Ball Corporation
- Majan Glass Company SAOG
- Nampak Ltd
- The National Company For Glass Industries (Zouja)
- Crown Holdings Inc
- Can-Pack S.A.
- Saudi Arabian Glass Co Ltd
- Huhtamäki Oyj
- Bonpak (Pty) Ltd
- Consol Glass Ltd
Key Developments in MEA Alcoholic Drinks Packaging Market Industry
- August 2021: Huhtamäki Oyj acquired Elif Holding AŞ, expanding its presence in Turkey and Egypt and bolstering its sustainability initiatives. This acquisition significantly impacts the market by increasing competition and accelerating innovation in sustainable packaging.
- August 2021: Ball Corporation's commitment to sustainable aluminum packaging solutions signals a shift away from plastic and glass, influencing industry trends toward environmentally friendly alternatives. This initiative is anticipated to influence the market's growth rate within the next 5 years.
Strategic MEA Alcoholic Drinks Packaging Market Forecast
The MEA alcoholic drinks packaging market is poised for significant growth, driven by a combination of factors such as increasing consumer spending, a preference for premium products, and the adoption of sustainable packaging solutions. The forecast period will see considerable expansion, particularly in segments focusing on eco-friendly materials and innovative designs. The market is expected to demonstrate robust growth throughout the forecast period, driven by increased investments in new technologies and the rising demand for sustainable packaging.
MEA Alcoholic Drinks Packaging Market Segmentation
-
1. Primary Material
- 1.1. Glass
- 1.2. Metal
- 1.3. Plastic
- 1.4. Paper
-
2. Alcoholic Products
- 2.1. Wine
- 2.2. Spirits
- 2.3. Beer
- 2.4. Other Types of Alcoholic Beverages
-
3. Product Type
- 3.1. Glass Bottles
- 3.2. Metal Cans
- 3.3. Plastic Bottles
- 3.4. Other Product Types
MEA Alcoholic Drinks Packaging Market Segmentation By Geography
-
1. North America
- 1.1. United States
- 1.2. Canada
- 1.3. Mexico
-
2. South America
- 2.1. Brazil
- 2.2. Argentina
- 2.3. Rest of South America
-
3. Europe
- 3.1. United Kingdom
- 3.2. Germany
- 3.3. France
- 3.4. Italy
- 3.5. Spain
- 3.6. Russia
- 3.7. Benelux
- 3.8. Nordics
- 3.9. Rest of Europe
-
4. Middle East & Africa
- 4.1. Turkey
- 4.2. Israel
- 4.3. GCC
- 4.4. North Africa
- 4.5. South Africa
- 4.6. Rest of Middle East & Africa
-
5. Asia Pacific
- 5.1. China
- 5.2. India
- 5.3. Japan
- 5.4. South Korea
- 5.5. ASEAN
- 5.6. Oceania
- 5.7. Rest of Asia Pacific
MEA Alcoholic Drinks Packaging Market REPORT HIGHLIGHTS
| Aspects | Details |
|---|---|
| Study Period | 2019-2033 |
| Base Year | 2024 |
| Estimated Year | 2025 |
| Forecast Period | 2025-2033 |
| Historical Period | 2019-2024 |
| Growth Rate | CAGR of 3.80% from 2019-2033 |
| Segmentation |
|
Table of Contents
- 1. Introduction
- 1.1. Research Scope
- 1.2. Market Segmentation
- 1.3. Research Methodology
- 1.4. Definitions and Assumptions
- 2. Executive Summary
- 2.1. Introduction
- 3. Market Dynamics
- 3.1. Introduction
- 3.2. Market Drivers
- 3.2.1. Growth in Purchasing Power of Consumers; Growing Awareness Among Alcoholic Beverage Manufacturers to Differentiate Their Products Over Packaging
- 3.3. Market Restrains
- 3.3.1. Presence of Alternate Packaging Solutions
- 3.4. Market Trends
- 3.4.1. Metal Can Packaging is Expected to Grow Significantly
- 4. Market Factor Analysis
- 4.1. Porters Five Forces
- 4.2. Supply/Value Chain
- 4.3. PESTEL analysis
- 4.4. Market Entropy
- 4.5. Patent/Trademark Analysis
- 5. Global MEA Alcoholic Drinks Packaging Market Analysis, Insights and Forecast, 2019-2031
- 5.1. Market Analysis, Insights and Forecast - by Primary Material
- 5.1.1. Glass
- 5.1.2. Metal
- 5.1.3. Plastic
- 5.1.4. Paper
- 5.2. Market Analysis, Insights and Forecast - by Alcoholic Products
- 5.2.1. Wine
- 5.2.2. Spirits
- 5.2.3. Beer
- 5.2.4. Other Types of Alcoholic Beverages
- 5.3. Market Analysis, Insights and Forecast - by Product Type
- 5.3.1. Glass Bottles
- 5.3.2. Metal Cans
- 5.3.3. Plastic Bottles
- 5.3.4. Other Product Types
- 5.4. Market Analysis, Insights and Forecast - by Region
- 5.4.1. North America
- 5.4.2. South America
- 5.4.3. Europe
- 5.4.4. Middle East & Africa
- 5.4.5. Asia Pacific
- 5.1. Market Analysis, Insights and Forecast - by Primary Material
- 6. North America MEA Alcoholic Drinks Packaging Market Analysis, Insights and Forecast, 2019-2031
- 6.1. Market Analysis, Insights and Forecast - by Primary Material
- 6.1.1. Glass
- 6.1.2. Metal
- 6.1.3. Plastic
- 6.1.4. Paper
- 6.2. Market Analysis, Insights and Forecast - by Alcoholic Products
- 6.2.1. Wine
- 6.2.2. Spirits
- 6.2.3. Beer
- 6.2.4. Other Types of Alcoholic Beverages
- 6.3. Market Analysis, Insights and Forecast - by Product Type
- 6.3.1. Glass Bottles
- 6.3.2. Metal Cans
- 6.3.3. Plastic Bottles
- 6.3.4. Other Product Types
- 6.1. Market Analysis, Insights and Forecast - by Primary Material
- 7. South America MEA Alcoholic Drinks Packaging Market Analysis, Insights and Forecast, 2019-2031
- 7.1. Market Analysis, Insights and Forecast - by Primary Material
- 7.1.1. Glass
- 7.1.2. Metal
- 7.1.3. Plastic
- 7.1.4. Paper
- 7.2. Market Analysis, Insights and Forecast - by Alcoholic Products
- 7.2.1. Wine
- 7.2.2. Spirits
- 7.2.3. Beer
- 7.2.4. Other Types of Alcoholic Beverages
- 7.3. Market Analysis, Insights and Forecast - by Product Type
- 7.3.1. Glass Bottles
- 7.3.2. Metal Cans
- 7.3.3. Plastic Bottles
- 7.3.4. Other Product Types
- 7.1. Market Analysis, Insights and Forecast - by Primary Material
- 8. Europe MEA Alcoholic Drinks Packaging Market Analysis, Insights and Forecast, 2019-2031
- 8.1. Market Analysis, Insights and Forecast - by Primary Material
- 8.1.1. Glass
- 8.1.2. Metal
- 8.1.3. Plastic
- 8.1.4. Paper
- 8.2. Market Analysis, Insights and Forecast - by Alcoholic Products
- 8.2.1. Wine
- 8.2.2. Spirits
- 8.2.3. Beer
- 8.2.4. Other Types of Alcoholic Beverages
- 8.3. Market Analysis, Insights and Forecast - by Product Type
- 8.3.1. Glass Bottles
- 8.3.2. Metal Cans
- 8.3.3. Plastic Bottles
- 8.3.4. Other Product Types
- 8.1. Market Analysis, Insights and Forecast - by Primary Material
- 9. Middle East & Africa MEA Alcoholic Drinks Packaging Market Analysis, Insights and Forecast, 2019-2031
- 9.1. Market Analysis, Insights and Forecast - by Primary Material
- 9.1.1. Glass
- 9.1.2. Metal
- 9.1.3. Plastic
- 9.1.4. Paper
- 9.2. Market Analysis, Insights and Forecast - by Alcoholic Products
- 9.2.1. Wine
- 9.2.2. Spirits
- 9.2.3. Beer
- 9.2.4. Other Types of Alcoholic Beverages
- 9.3. Market Analysis, Insights and Forecast - by Product Type
- 9.3.1. Glass Bottles
- 9.3.2. Metal Cans
- 9.3.3. Plastic Bottles
- 9.3.4. Other Product Types
- 9.1. Market Analysis, Insights and Forecast - by Primary Material
- 10. Asia Pacific MEA Alcoholic Drinks Packaging Market Analysis, Insights and Forecast, 2019-2031
- 10.1. Market Analysis, Insights and Forecast - by Primary Material
- 10.1.1. Glass
- 10.1.2. Metal
- 10.1.3. Plastic
- 10.1.4. Paper
- 10.2. Market Analysis, Insights and Forecast - by Alcoholic Products
- 10.2.1. Wine
- 10.2.2. Spirits
- 10.2.3. Beer
- 10.2.4. Other Types of Alcoholic Beverages
- 10.3. Market Analysis, Insights and Forecast - by Product Type
- 10.3.1. Glass Bottles
- 10.3.2. Metal Cans
- 10.3.3. Plastic Bottles
- 10.3.4. Other Product Types
- 10.1. Market Analysis, Insights and Forecast - by Primary Material
- 11. North America MEA Alcoholic Drinks Packaging Market Analysis, Insights and Forecast, 2019-2031
- 11.1. Market Analysis, Insights and Forecast - By Country/Sub-region
- 11.1.1 United States
- 11.1.2 Canada
- 12. Europe MEA Alcoholic Drinks Packaging Market Analysis, Insights and Forecast, 2019-2031
- 12.1. Market Analysis, Insights and Forecast - By Country/Sub-region
- 12.1.1 United Kingdom
- 12.1.2 Germany
- 12.1.3 France
- 12.1.4 Spain
- 12.1.5 Rest of Europe
- 13. Asia Pacific MEA Alcoholic Drinks Packaging Market Analysis, Insights and Forecast, 2019-2031
- 13.1. Market Analysis, Insights and Forecast - By Country/Sub-region
- 13.1.1 China
- 13.1.2 India
- 13.1.3 Japan
- 13.1.4 South Korea
- 13.1.5 Thailand
- 13.1.6 Rest of Asia Pacific
- 14. Latin America MEA Alcoholic Drinks Packaging Market Analysis, Insights and Forecast, 2019-2031
- 14.1. Market Analysis, Insights and Forecast - By Country/Sub-region
- 14.1.1 Brazil
- 14.1.2 Mexico
- 14.1.3 Rest of Latin America
- 15. Middle East and Africa MEA Alcoholic Drinks Packaging Market Analysis, Insights and Forecast, 2019-2031
- 15.1. Market Analysis, Insights and Forecast - By Country/Sub-region
- 15.1.1 United Arab Emirates
- 15.1.2 Saudi Arabia
- 15.1.3 South Africa
- 15.1.4 Rest of Middle East
- 16. Competitive Analysis
- 16.1. Global Market Share Analysis 2024
- 16.2. Company Profiles
- 16.2.1 Saverglass SAS
- 16.2.1.1. Overview
- 16.2.1.2. Products
- 16.2.1.3. SWOT Analysis
- 16.2.1.4. Recent Developments
- 16.2.1.5. Financials (Based on Availability)
- 16.2.2 Middle East Glass Manufacturing Company SAE
- 16.2.2.1. Overview
- 16.2.2.2. Products
- 16.2.2.3. SWOT Analysis
- 16.2.2.4. Recent Developments
- 16.2.2.5. Financials (Based on Availability)
- 16.2.3 Ball Corporation
- 16.2.3.1. Overview
- 16.2.3.2. Products
- 16.2.3.3. SWOT Analysis
- 16.2.3.4. Recent Developments
- 16.2.3.5. Financials (Based on Availability)
- 16.2.4 Majan Glass Company SAOG
- 16.2.4.1. Overview
- 16.2.4.2. Products
- 16.2.4.3. SWOT Analysis
- 16.2.4.4. Recent Developments
- 16.2.4.5. Financials (Based on Availability)
- 16.2.5 Nampak Ltd
- 16.2.5.1. Overview
- 16.2.5.2. Products
- 16.2.5.3. SWOT Analysis
- 16.2.5.4. Recent Developments
- 16.2.5.5. Financials (Based on Availability)
- 16.2.6 The National Company For Glass Industries (Zouja)
- 16.2.6.1. Overview
- 16.2.6.2. Products
- 16.2.6.3. SWOT Analysis
- 16.2.6.4. Recent Developments
- 16.2.6.5. Financials (Based on Availability)
- 16.2.7 Crown Holdings Inc
- 16.2.7.1. Overview
- 16.2.7.2. Products
- 16.2.7.3. SWOT Analysis
- 16.2.7.4. Recent Developments
- 16.2.7.5. Financials (Based on Availability)
- 16.2.8 Can-Pack S
- 16.2.8.1. Overview
- 16.2.8.2. Products
- 16.2.8.3. SWOT Analysis
- 16.2.8.4. Recent Developments
- 16.2.8.5. Financials (Based on Availability)
- 16.2.9 Saudi Arabian Glass Co Ltd
- 16.2.9.1. Overview
- 16.2.9.2. Products
- 16.2.9.3. SWOT Analysis
- 16.2.9.4. Recent Developments
- 16.2.9.5. Financials (Based on Availability)
- 16.2.10 Huhtamäki Oyj
- 16.2.10.1. Overview
- 16.2.10.2. Products
- 16.2.10.3. SWOT Analysis
- 16.2.10.4. Recent Developments
- 16.2.10.5. Financials (Based on Availability)
- 16.2.11 Bonpak (Pty) Ltd
- 16.2.11.1. Overview
- 16.2.11.2. Products
- 16.2.11.3. SWOT Analysis
- 16.2.11.4. Recent Developments
- 16.2.11.5. Financials (Based on Availability)
- 16.2.12 Consol Glass Ltd
- 16.2.12.1. Overview
- 16.2.12.2. Products
- 16.2.12.3. SWOT Analysis
- 16.2.12.4. Recent Developments
- 16.2.12.5. Financials (Based on Availability)
- 16.2.1 Saverglass SAS
List of Figures
- Figure 1: Global MEA Alcoholic Drinks Packaging Market Revenue Breakdown (Million, %) by Region 2024 & 2032
- Figure 2: North America MEA Alcoholic Drinks Packaging Market Revenue (Million), by Country 2024 & 2032
- Figure 3: North America MEA Alcoholic Drinks Packaging Market Revenue Share (%), by Country 2024 & 2032
- Figure 4: Europe MEA Alcoholic Drinks Packaging Market Revenue (Million), by Country 2024 & 2032
- Figure 5: Europe MEA Alcoholic Drinks Packaging Market Revenue Share (%), by Country 2024 & 2032
- Figure 6: Asia Pacific MEA Alcoholic Drinks Packaging Market Revenue (Million), by Country 2024 & 2032
- Figure 7: Asia Pacific MEA Alcoholic Drinks Packaging Market Revenue Share (%), by Country 2024 & 2032
- Figure 8: Latin America MEA Alcoholic Drinks Packaging Market Revenue (Million), by Country 2024 & 2032
- Figure 9: Latin America MEA Alcoholic Drinks Packaging Market Revenue Share (%), by Country 2024 & 2032
- Figure 10: Middle East and Africa MEA Alcoholic Drinks Packaging Market Revenue (Million), by Country 2024 & 2032
- Figure 11: Middle East and Africa MEA Alcoholic Drinks Packaging Market Revenue Share (%), by Country 2024 & 2032
- Figure 12: North America MEA Alcoholic Drinks Packaging Market Revenue (Million), by Primary Material 2024 & 2032
- Figure 13: North America MEA Alcoholic Drinks Packaging Market Revenue Share (%), by Primary Material 2024 & 2032
- Figure 14: North America MEA Alcoholic Drinks Packaging Market Revenue (Million), by Alcoholic Products 2024 & 2032
- Figure 15: North America MEA Alcoholic Drinks Packaging Market Revenue Share (%), by Alcoholic Products 2024 & 2032
- Figure 16: North America MEA Alcoholic Drinks Packaging Market Revenue (Million), by Product Type 2024 & 2032
- Figure 17: North America MEA Alcoholic Drinks Packaging Market Revenue Share (%), by Product Type 2024 & 2032
- Figure 18: North America MEA Alcoholic Drinks Packaging Market Revenue (Million), by Country 2024 & 2032
- Figure 19: North America MEA Alcoholic Drinks Packaging Market Revenue Share (%), by Country 2024 & 2032
- Figure 20: South America MEA Alcoholic Drinks Packaging Market Revenue (Million), by Primary Material 2024 & 2032
- Figure 21: South America MEA Alcoholic Drinks Packaging Market Revenue Share (%), by Primary Material 2024 & 2032
- Figure 22: South America MEA Alcoholic Drinks Packaging Market Revenue (Million), by Alcoholic Products 2024 & 2032
- Figure 23: South America MEA Alcoholic Drinks Packaging Market Revenue Share (%), by Alcoholic Products 2024 & 2032
- Figure 24: South America MEA Alcoholic Drinks Packaging Market Revenue (Million), by Product Type 2024 & 2032
- Figure 25: South America MEA Alcoholic Drinks Packaging Market Revenue Share (%), by Product Type 2024 & 2032
- Figure 26: South America MEA Alcoholic Drinks Packaging Market Revenue (Million), by Country 2024 & 2032
- Figure 27: South America MEA Alcoholic Drinks Packaging Market Revenue Share (%), by Country 2024 & 2032
- Figure 28: Europe MEA Alcoholic Drinks Packaging Market Revenue (Million), by Primary Material 2024 & 2032
- Figure 29: Europe MEA Alcoholic Drinks Packaging Market Revenue Share (%), by Primary Material 2024 & 2032
- Figure 30: Europe MEA Alcoholic Drinks Packaging Market Revenue (Million), by Alcoholic Products 2024 & 2032
- Figure 31: Europe MEA Alcoholic Drinks Packaging Market Revenue Share (%), by Alcoholic Products 2024 & 2032
- Figure 32: Europe MEA Alcoholic Drinks Packaging Market Revenue (Million), by Product Type 2024 & 2032
- Figure 33: Europe MEA Alcoholic Drinks Packaging Market Revenue Share (%), by Product Type 2024 & 2032
- Figure 34: Europe MEA Alcoholic Drinks Packaging Market Revenue (Million), by Country 2024 & 2032
- Figure 35: Europe MEA Alcoholic Drinks Packaging Market Revenue Share (%), by Country 2024 & 2032
- Figure 36: Middle East & Africa MEA Alcoholic Drinks Packaging Market Revenue (Million), by Primary Material 2024 & 2032
- Figure 37: Middle East & Africa MEA Alcoholic Drinks Packaging Market Revenue Share (%), by Primary Material 2024 & 2032
- Figure 38: Middle East & Africa MEA Alcoholic Drinks Packaging Market Revenue (Million), by Alcoholic Products 2024 & 2032
- Figure 39: Middle East & Africa MEA Alcoholic Drinks Packaging Market Revenue Share (%), by Alcoholic Products 2024 & 2032
- Figure 40: Middle East & Africa MEA Alcoholic Drinks Packaging Market Revenue (Million), by Product Type 2024 & 2032
- Figure 41: Middle East & Africa MEA Alcoholic Drinks Packaging Market Revenue Share (%), by Product Type 2024 & 2032
- Figure 42: Middle East & Africa MEA Alcoholic Drinks Packaging Market Revenue (Million), by Country 2024 & 2032
- Figure 43: Middle East & Africa MEA Alcoholic Drinks Packaging Market Revenue Share (%), by Country 2024 & 2032
- Figure 44: Asia Pacific MEA Alcoholic Drinks Packaging Market Revenue (Million), by Primary Material 2024 & 2032
- Figure 45: Asia Pacific MEA Alcoholic Drinks Packaging Market Revenue Share (%), by Primary Material 2024 & 2032
- Figure 46: Asia Pacific MEA Alcoholic Drinks Packaging Market Revenue (Million), by Alcoholic Products 2024 & 2032
- Figure 47: Asia Pacific MEA Alcoholic Drinks Packaging Market Revenue Share (%), by Alcoholic Products 2024 & 2032
- Figure 48: Asia Pacific MEA Alcoholic Drinks Packaging Market Revenue (Million), by Product Type 2024 & 2032
- Figure 49: Asia Pacific MEA Alcoholic Drinks Packaging Market Revenue Share (%), by Product Type 2024 & 2032
- Figure 50: Asia Pacific MEA Alcoholic Drinks Packaging Market Revenue (Million), by Country 2024 & 2032
- Figure 51: Asia Pacific MEA Alcoholic Drinks Packaging Market Revenue Share (%), by Country 2024 & 2032
List of Tables
- Table 1: Global MEA Alcoholic Drinks Packaging Market Revenue Million Forecast, by Region 2019 & 2032
- Table 2: Global MEA Alcoholic Drinks Packaging Market Revenue Million Forecast, by Primary Material 2019 & 2032
- Table 3: Global MEA Alcoholic Drinks Packaging Market Revenue Million Forecast, by Alcoholic Products 2019 & 2032
- Table 4: Global MEA Alcoholic Drinks Packaging Market Revenue Million Forecast, by Product Type 2019 & 2032
- Table 5: Global MEA Alcoholic Drinks Packaging Market Revenue Million Forecast, by Region 2019 & 2032
- Table 6: Global MEA Alcoholic Drinks Packaging Market Revenue Million Forecast, by Country 2019 & 2032
- Table 7: United States MEA Alcoholic Drinks Packaging Market Revenue (Million) Forecast, by Application 2019 & 2032
- Table 8: Canada MEA Alcoholic Drinks Packaging Market Revenue (Million) Forecast, by Application 2019 & 2032
- Table 9: Global MEA Alcoholic Drinks Packaging Market Revenue Million Forecast, by Country 2019 & 2032
- Table 10: United Kingdom MEA Alcoholic Drinks Packaging Market Revenue (Million) Forecast, by Application 2019 & 2032
- Table 11: Germany MEA Alcoholic Drinks Packaging Market Revenue (Million) Forecast, by Application 2019 & 2032
- Table 12: France MEA Alcoholic Drinks Packaging Market Revenue (Million) Forecast, by Application 2019 & 2032
- Table 13: Spain MEA Alcoholic Drinks Packaging Market Revenue (Million) Forecast, by Application 2019 & 2032
- Table 14: Rest of Europe MEA Alcoholic Drinks Packaging Market Revenue (Million) Forecast, by Application 2019 & 2032
- Table 15: Global MEA Alcoholic Drinks Packaging Market Revenue Million Forecast, by Country 2019 & 2032
- Table 16: China MEA Alcoholic Drinks Packaging Market Revenue (Million) Forecast, by Application 2019 & 2032
- Table 17: India MEA Alcoholic Drinks Packaging Market Revenue (Million) Forecast, by Application 2019 & 2032
- Table 18: Japan MEA Alcoholic Drinks Packaging Market Revenue (Million) Forecast, by Application 2019 & 2032
- Table 19: South Korea MEA Alcoholic Drinks Packaging Market Revenue (Million) Forecast, by Application 2019 & 2032
- Table 20: Thailand MEA Alcoholic Drinks Packaging Market Revenue (Million) Forecast, by Application 2019 & 2032
- Table 21: Rest of Asia Pacific MEA Alcoholic Drinks Packaging Market Revenue (Million) Forecast, by Application 2019 & 2032
- Table 22: Global MEA Alcoholic Drinks Packaging Market Revenue Million Forecast, by Country 2019 & 2032
- Table 23: Brazil MEA Alcoholic Drinks Packaging Market Revenue (Million) Forecast, by Application 2019 & 2032
- Table 24: Mexico MEA Alcoholic Drinks Packaging Market Revenue (Million) Forecast, by Application 2019 & 2032
- Table 25: Rest of Latin America MEA Alcoholic Drinks Packaging Market Revenue (Million) Forecast, by Application 2019 & 2032
- Table 26: Global MEA Alcoholic Drinks Packaging Market Revenue Million Forecast, by Country 2019 & 2032
- Table 27: United Arab Emirates MEA Alcoholic Drinks Packaging Market Revenue (Million) Forecast, by Application 2019 & 2032
- Table 28: Saudi Arabia MEA Alcoholic Drinks Packaging Market Revenue (Million) Forecast, by Application 2019 & 2032
- Table 29: South Africa MEA Alcoholic Drinks Packaging Market Revenue (Million) Forecast, by Application 2019 & 2032
- Table 30: Rest of Middle East MEA Alcoholic Drinks Packaging Market Revenue (Million) Forecast, by Application 2019 & 2032
- Table 31: Global MEA Alcoholic Drinks Packaging Market Revenue Million Forecast, by Primary Material 2019 & 2032
- Table 32: Global MEA Alcoholic Drinks Packaging Market Revenue Million Forecast, by Alcoholic Products 2019 & 2032
- Table 33: Global MEA Alcoholic Drinks Packaging Market Revenue Million Forecast, by Product Type 2019 & 2032
- Table 34: Global MEA Alcoholic Drinks Packaging Market Revenue Million Forecast, by Country 2019 & 2032
- Table 35: United States MEA Alcoholic Drinks Packaging Market Revenue (Million) Forecast, by Application 2019 & 2032
- Table 36: Canada MEA Alcoholic Drinks Packaging Market Revenue (Million) Forecast, by Application 2019 & 2032
- Table 37: Mexico MEA Alcoholic Drinks Packaging Market Revenue (Million) Forecast, by Application 2019 & 2032
- Table 38: Global MEA Alcoholic Drinks Packaging Market Revenue Million Forecast, by Primary Material 2019 & 2032
- Table 39: Global MEA Alcoholic Drinks Packaging Market Revenue Million Forecast, by Alcoholic Products 2019 & 2032
- Table 40: Global MEA Alcoholic Drinks Packaging Market Revenue Million Forecast, by Product Type 2019 & 2032
- Table 41: Global MEA Alcoholic Drinks Packaging Market Revenue Million Forecast, by Country 2019 & 2032
- Table 42: Brazil MEA Alcoholic Drinks Packaging Market Revenue (Million) Forecast, by Application 2019 & 2032
- Table 43: Argentina MEA Alcoholic Drinks Packaging Market Revenue (Million) Forecast, by Application 2019 & 2032
- Table 44: Rest of South America MEA Alcoholic Drinks Packaging Market Revenue (Million) Forecast, by Application 2019 & 2032
- Table 45: Global MEA Alcoholic Drinks Packaging Market Revenue Million Forecast, by Primary Material 2019 & 2032
- Table 46: Global MEA Alcoholic Drinks Packaging Market Revenue Million Forecast, by Alcoholic Products 2019 & 2032
- Table 47: Global MEA Alcoholic Drinks Packaging Market Revenue Million Forecast, by Product Type 2019 & 2032
- Table 48: Global MEA Alcoholic Drinks Packaging Market Revenue Million Forecast, by Country 2019 & 2032
- Table 49: United Kingdom MEA Alcoholic Drinks Packaging Market Revenue (Million) Forecast, by Application 2019 & 2032
- Table 50: Germany MEA Alcoholic Drinks Packaging Market Revenue (Million) Forecast, by Application 2019 & 2032
- Table 51: France MEA Alcoholic Drinks Packaging Market Revenue (Million) Forecast, by Application 2019 & 2032
- Table 52: Italy MEA Alcoholic Drinks Packaging Market Revenue (Million) Forecast, by Application 2019 & 2032
- Table 53: Spain MEA Alcoholic Drinks Packaging Market Revenue (Million) Forecast, by Application 2019 & 2032
- Table 54: Russia MEA Alcoholic Drinks Packaging Market Revenue (Million) Forecast, by Application 2019 & 2032
- Table 55: Benelux MEA Alcoholic Drinks Packaging Market Revenue (Million) Forecast, by Application 2019 & 2032
- Table 56: Nordics MEA Alcoholic Drinks Packaging Market Revenue (Million) Forecast, by Application 2019 & 2032
- Table 57: Rest of Europe MEA Alcoholic Drinks Packaging Market Revenue (Million) Forecast, by Application 2019 & 2032
- Table 58: Global MEA Alcoholic Drinks Packaging Market Revenue Million Forecast, by Primary Material 2019 & 2032
- Table 59: Global MEA Alcoholic Drinks Packaging Market Revenue Million Forecast, by Alcoholic Products 2019 & 2032
- Table 60: Global MEA Alcoholic Drinks Packaging Market Revenue Million Forecast, by Product Type 2019 & 2032
- Table 61: Global MEA Alcoholic Drinks Packaging Market Revenue Million Forecast, by Country 2019 & 2032
- Table 62: Turkey MEA Alcoholic Drinks Packaging Market Revenue (Million) Forecast, by Application 2019 & 2032
- Table 63: Israel MEA Alcoholic Drinks Packaging Market Revenue (Million) Forecast, by Application 2019 & 2032
- Table 64: GCC MEA Alcoholic Drinks Packaging Market Revenue (Million) Forecast, by Application 2019 & 2032
- Table 65: North Africa MEA Alcoholic Drinks Packaging Market Revenue (Million) Forecast, by Application 2019 & 2032
- Table 66: South Africa MEA Alcoholic Drinks Packaging Market Revenue (Million) Forecast, by Application 2019 & 2032
- Table 67: Rest of Middle East & Africa MEA Alcoholic Drinks Packaging Market Revenue (Million) Forecast, by Application 2019 & 2032
- Table 68: Global MEA Alcoholic Drinks Packaging Market Revenue Million Forecast, by Primary Material 2019 & 2032
- Table 69: Global MEA Alcoholic Drinks Packaging Market Revenue Million Forecast, by Alcoholic Products 2019 & 2032
- Table 70: Global MEA Alcoholic Drinks Packaging Market Revenue Million Forecast, by Product Type 2019 & 2032
- Table 71: Global MEA Alcoholic Drinks Packaging Market Revenue Million Forecast, by Country 2019 & 2032
- Table 72: China MEA Alcoholic Drinks Packaging Market Revenue (Million) Forecast, by Application 2019 & 2032
- Table 73: India MEA Alcoholic Drinks Packaging Market Revenue (Million) Forecast, by Application 2019 & 2032
- Table 74: Japan MEA Alcoholic Drinks Packaging Market Revenue (Million) Forecast, by Application 2019 & 2032
- Table 75: South Korea MEA Alcoholic Drinks Packaging Market Revenue (Million) Forecast, by Application 2019 & 2032
- Table 76: ASEAN MEA Alcoholic Drinks Packaging Market Revenue (Million) Forecast, by Application 2019 & 2032
- Table 77: Oceania MEA Alcoholic Drinks Packaging Market Revenue (Million) Forecast, by Application 2019 & 2032
- Table 78: Rest of Asia Pacific MEA Alcoholic Drinks Packaging Market Revenue (Million) Forecast, by Application 2019 & 2032
Frequently Asked Questions
1. What is the projected Compound Annual Growth Rate (CAGR) of the MEA Alcoholic Drinks Packaging Market?
The projected CAGR is approximately 3.80%.
2. Which companies are prominent players in the MEA Alcoholic Drinks Packaging Market?
Key companies in the market include Saverglass SAS, Middle East Glass Manufacturing Company SAE, Ball Corporation, Majan Glass Company SAOG, Nampak Ltd, The National Company For Glass Industries (Zouja), Crown Holdings Inc, Can-Pack S, Saudi Arabian Glass Co Ltd, Huhtamäki Oyj, Bonpak (Pty) Ltd, Consol Glass Ltd.
3. What are the main segments of the MEA Alcoholic Drinks Packaging Market?
The market segments include Primary Material, Alcoholic Products, Product Type.
4. Can you provide details about the market size?
The market size is estimated to be USD XX Million as of 2022.
5. What are some drivers contributing to market growth?
Growth in Purchasing Power of Consumers; Growing Awareness Among Alcoholic Beverage Manufacturers to Differentiate Their Products Over Packaging.
6. What are the notable trends driving market growth?
Metal Can Packaging is Expected to Grow Significantly.
7. Are there any restraints impacting market growth?
Presence of Alternate Packaging Solutions.
8. Can you provide examples of recent developments in the market?
August 2021 - Huhtamäki Oyj acquired Elif Holding AŞ, a major supplier of sustainable, flexible packaging to global FMCG brand owners, with operations in Turkey and Egypt. In line with Huhtamaki's 2030 growth strategy, the acquisition adds scale in strategic geographies and supports Huhtamaki's progress toward reaching its high sustainability ambitions. The acquisition also expands Huhtamaki's technology capabilities and product range, allowing it to serve its customers even better.
9. What pricing options are available for accessing the report?
Pricing options include single-user, multi-user, and enterprise licenses priced at USD 4750, USD 4950, and USD 6800 respectively.
10. Is the market size provided in terms of value or volume?
The market size is provided in terms of value, measured in Million.
11. Are there any specific market keywords associated with the report?
Yes, the market keyword associated with the report is "MEA Alcoholic Drinks Packaging Market," which aids in identifying and referencing the specific market segment covered.
12. How do I determine which pricing option suits my needs best?
The pricing options vary based on user requirements and access needs. Individual users may opt for single-user licenses, while businesses requiring broader access may choose multi-user or enterprise licenses for cost-effective access to the report.
13. Are there any additional resources or data provided in the MEA Alcoholic Drinks Packaging Market report?
While the report offers comprehensive insights, it's advisable to review the specific contents or supplementary materials provided to ascertain if additional resources or data are available.
14. How can I stay updated on further developments or reports in the MEA Alcoholic Drinks Packaging Market?
To stay informed about further developments, trends, and reports in the MEA Alcoholic Drinks Packaging Market, consider subscribing to industry newsletters, following relevant companies and organizations, or regularly checking reputable industry news sources and publications.
Methodology
Step 1 - Identification of Relevant Samples Size from Population Database


Step 2 - Approaches for Defining Global Market Size (Value, Volume* & Price*)

Note*: In applicable scenarios
Step 3 - Data Sources
Primary Research
- Web Analytics
- Survey Reports
- Research Institute
- Latest Research Reports
- Opinion Leaders
Secondary Research
- Annual Reports
- White Paper
- Latest Press Release
- Industry Association
- Paid Database
- Investor Presentations

Step 4 - Data Triangulation
Involves using different sources of information in order to increase the validity of a study
These sources are likely to be stakeholders in a program - participants, other researchers, program staff, other community members, and so on.
Then we put all data in single framework & apply various statistical tools to find out the dynamic on the market.
During the analysis stage, feedback from the stakeholder groups would be compared to determine areas of agreement as well as areas of divergence
