

Key Insights
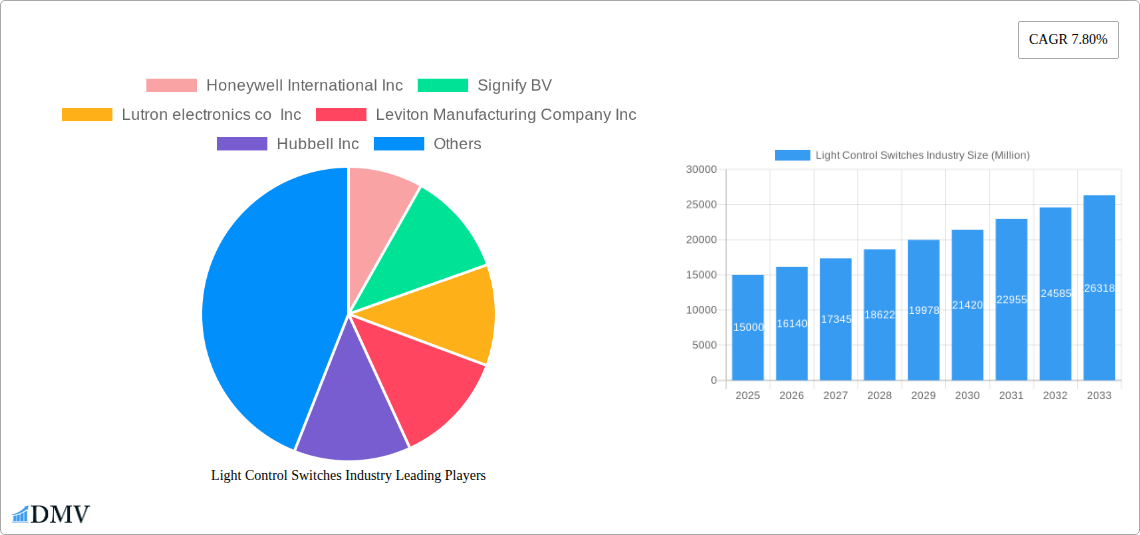
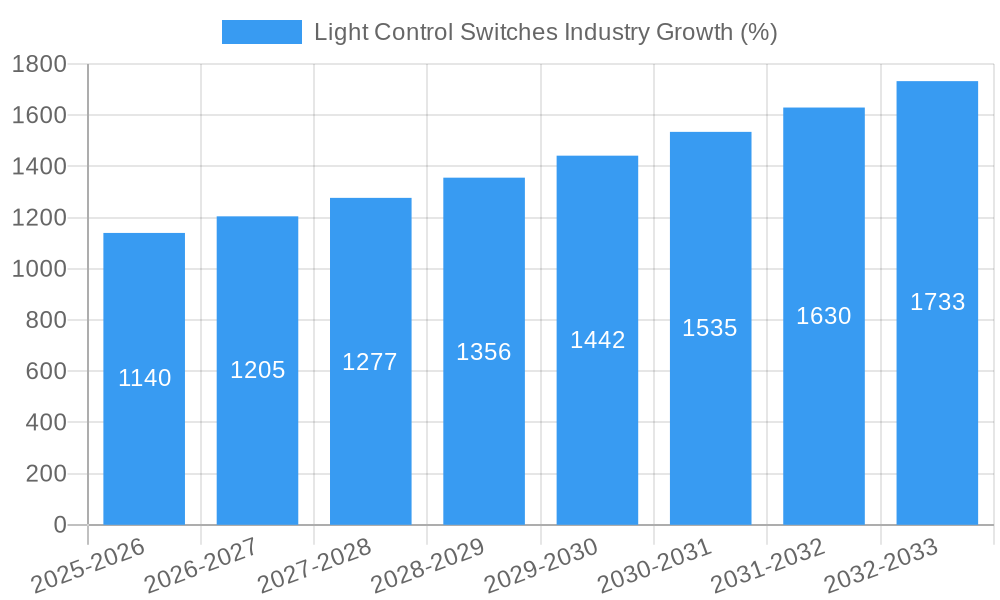
The global light control switches market is experiencing robust growth, projected to reach a substantial market size within the forecast period (2025-2033). A compound annual growth rate (CAGR) of 7.80% from 2019 to 2024 indicates a consistently expanding market. This growth is fueled by several key drivers, including the increasing adoption of energy-efficient LED lighting, the rising demand for smart home automation systems, and growing concerns about energy conservation and reducing carbon footprints. Furthermore, the market is witnessing a shift towards wireless technologies, offering greater flexibility and convenience compared to traditional wired systems. The burgeoning construction industry, particularly in developing economies across Asia-Pacific, contributes significantly to market expansion. However, the market faces certain restraints, such as the relatively high initial investment cost of smart lighting systems and the complexities associated with integrating these systems into existing infrastructure. Different segments within the market show varying growth trajectories; for instance, the LED light source segment is expected to dominate due to its energy efficiency and longevity, while the wireless communication technology segment is gaining traction owing to its ease of installation and user-friendly interface. The diverse application areas – both indoor and outdoor – further contribute to market segmentation and growth opportunities. Key players like Honeywell, Signify, Lutron, and others are actively investing in research and development, focusing on innovative product features and strategic partnerships to maintain their competitive edge.
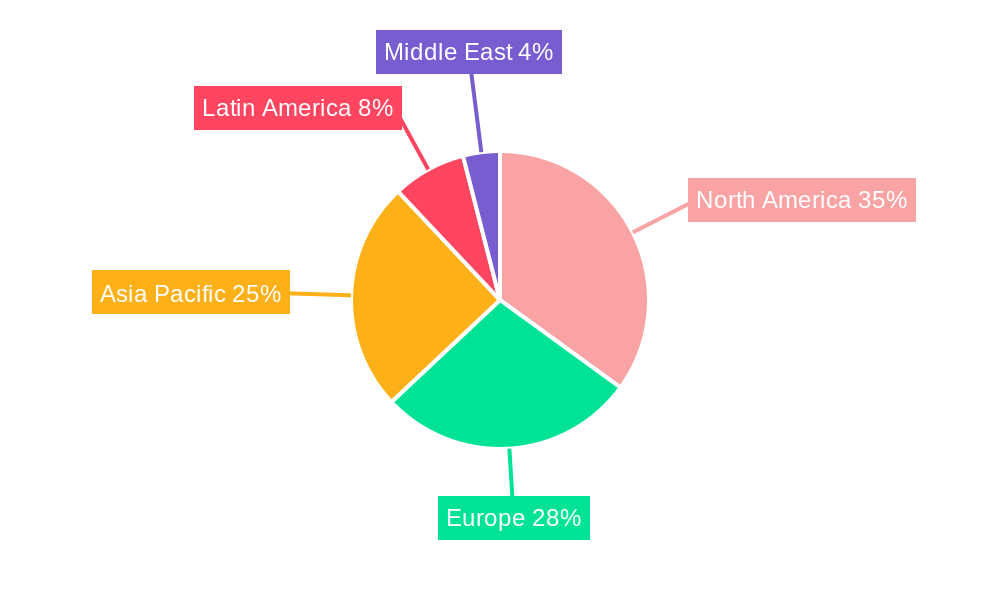
The geographical distribution of the market reveals strong performance across North America and Europe, driven by high adoption rates of smart home technologies and stringent energy efficiency regulations. However, the Asia-Pacific region is projected to witness the fastest growth in the coming years due to rapid urbanization, increasing disposable incomes, and government initiatives promoting energy conservation. While precise regional market shares require more detailed data, it's reasonable to anticipate a substantial contribution from Asia-Pacific to the overall market growth in the future, overtaking North America and Europe in terms of market size within the forecast period. The continued focus on smart home integration, building automation systems, and the proliferation of energy-efficient lighting technologies will be key factors shaping the future trajectory of the light control switches market.
Light Control Switches Industry: A Comprehensive Market Report (2019-2033)
This insightful report provides a detailed analysis of the global Light Control Switches industry, projecting a market value exceeding $XX Million by 2033. It offers a comprehensive overview of market trends, competitive landscape, technological advancements, and future growth opportunities. The report covers the period 2019-2033, with 2025 as the base and estimated year. This in-depth study is essential for stakeholders seeking to understand and capitalize on the evolving dynamics of this rapidly expanding sector.
Light Control Switches Industry Market Composition & Trends
The global light control switches market, valued at $XX Million in 2025, is characterized by a moderately consolidated structure. Key players such as Honeywell International Inc, Signify BV, Lutron Electronics Co Inc, and Legrand SA hold significant market share, with their combined share estimated at XX%. However, the market also features several smaller, specialized players contributing to its dynamism. Market concentration is expected to shift slightly over the forecast period, driven by strategic mergers and acquisitions (M&A) activities. Significant M&A deals in recent years have involved transactions worth over $XX Million, consolidating market power and fostering innovation.
- Market Share Distribution (2025): Honeywell International Inc (XX%), Signify BV (XX%), Lutron Electronics Co Inc (XX%), Legrand SA (XX%), Others (XX%).
- Innovation Catalysts: Growing demand for energy-efficient lighting solutions and smart home technologies are major drivers.
- Regulatory Landscape: Stringent energy efficiency regulations in various countries are shaping market growth.
- Substitute Products: Competition from alternative lighting control methods, such as voice-activated systems and app-based controls, is increasing.
- End-User Profiles: The primary end-users include residential, commercial, and industrial sectors, with the commercial sector exhibiting significant growth potential.
- M&A Activities (2019-2024): XX major M&A deals totaling $XX Million.
Light Control Switches Industry Evolution
The light control switches market has witnessed significant evolution since 2019. The market experienced a Compound Annual Growth Rate (CAGR) of XX% during the historical period (2019-2024), largely driven by the increasing adoption of energy-efficient LED lighting and the rising popularity of smart home technology. Technological advancements, such as the integration of wireless communication protocols (Zigbee, Z-Wave, Bluetooth) and the development of advanced dimming and control functionalities, have significantly enhanced product features and broadened market appeal. Furthermore, shifting consumer preferences towards personalized lighting experiences and seamless home automation are driving demand for sophisticated light control switches. The market is expected to maintain a steady growth trajectory during the forecast period (2025-2033), with a projected CAGR of XX%, fueled by continuous technological innovation and expanding applications across various sectors. The adoption rate of smart light control switches is projected to increase from XX% in 2025 to XX% by 2033.
Leading Regions, Countries, or Segments in Light Control Switches Industry
North America currently dominates the light control switches market, driven by high adoption rates of smart home technology and stringent energy efficiency regulations. However, Asia-Pacific is expected to experience the fastest growth in the coming years, propelled by rapid urbanization, rising disposable incomes, and increasing government support for energy-efficient infrastructure development.
- By Communication Technology: The Wireless segment is rapidly gaining traction due to its ease of installation and flexibility. Growth is fueled by increasing affordability and advancements in wireless communication protocols.
- By Application: The Indoor segment presently holds the largest market share, driven by widespread adoption in residential and commercial buildings. However, the Outdoor segment is showing promising growth potential, owing to increasing applications in smart city initiatives and outdoor lighting installations.
- By Light Source: The LED segment is the dominant light source type, fueled by its energy efficiency, longer lifespan, and diverse color options.
Key Drivers:
- North America: High consumer demand for smart home solutions, stringent energy efficiency standards.
- Asia-Pacific: Rapid urbanization, rising disposable incomes, government initiatives supporting energy efficiency.
- Wireless Segment: Ease of installation, flexibility, declining cost of wireless technologies.
- LED Segment: Energy efficiency, longer lifespan, diverse color options, cost competitiveness.
Light Control Switches Industry Product Innovations
Recent innovations include the integration of advanced functionalities such as occupancy sensing, daylight harvesting, and smartphone-based control. These advancements enhance energy efficiency, improve user experience, and expand the range of applications for light control switches. The introduction of energy-harvesting capabilities, enabling self-powered operation, represents a significant leap forward in sustainable lighting solutions. Furthermore, the use of AI and machine learning algorithms for personalized lighting settings is becoming increasingly prevalent.
Propelling Factors for Light Control Switches Industry Growth
Technological advancements, particularly in wireless communication and sensor technologies, are significantly driving market growth. The increasing affordability of smart home technology, coupled with rising consumer awareness of energy efficiency, further fuels market expansion. Favorable government policies promoting energy conservation and sustainable development are also creating a positive environment for growth.
Obstacles in the Light Control Switches Industry Market
High initial investment costs for smart lighting systems can deter some consumers, particularly in developing economies. Supply chain disruptions and fluctuations in raw material prices pose significant challenges to market growth. Intense competition from established players and new entrants creates pressure on profit margins.
Future Opportunities in Light Control Switches Industry
Emerging opportunities lie in the integration of light control switches with other smart home devices and systems, forming part of a comprehensive Internet of Things (IoT) ecosystem. Expansion into new markets, particularly in developing countries, holds significant potential for future growth. Further advancements in energy harvesting technologies and AI-powered lighting controls offer exciting prospects for the industry.
Major Players in the Light Control Switches Industry Ecosystem
- Honeywell International Inc
- Signify BV
- Lutron Electronics Co Inc
- Leviton Manufacturing Company Inc
- Hubbell Inc
- Legrand SA
- Schneider Electric SE
- Eaton Corporation PLC
- Osram GmbH
- Acuity Brands Inc
- Havells India Limited
Key Developments in Light Control Switches Industry
- 2023-06: Signify BV launched a new range of smart light switches with enhanced energy efficiency features.
- 2022-11: Lutron Electronics Co Inc announced a strategic partnership with a major smart home platform provider.
- 2021-09: Honeywell International Inc acquired a smaller lighting control company, expanding its product portfolio.
Strategic Light Control Switches Industry Market Forecast
The light control switches market is poised for significant growth over the next decade, driven by continuous technological innovation, expanding applications across various sectors, and increasing consumer preference for energy-efficient and smart lighting solutions. The rising adoption of smart home technologies and favorable government policies promoting energy conservation will further fuel market expansion, creating lucrative opportunities for existing players and new entrants alike. The market is expected to experience robust growth, exceeding $XX Million by 2033.
Light Control Switches Industry Segmentation
-
1. Communication Technology
- 1.1. Wired
- 1.2. Wireless
-
2. Application
- 2.1. Indoor
- 2.2. Outdoor
-
3. Light Source
- 3.1. Incandescent
- 3.2. Fluorescent (FL)
- 3.3. Light-Emitting diode (LED)
- 3.4. Other Light Sources
Light Control Switches Industry Segmentation By Geography
- 1. North America
- 2. Europe
- 3. Asia Pacific
- 4. Latin America
- 5. Middle East
Light Control Switches Industry REPORT HIGHLIGHTS
| Aspects | Details |
|---|---|
| Study Period | 2019-2033 |
| Base Year | 2024 |
| Estimated Year | 2025 |
| Forecast Period | 2025-2033 |
| Historical Period | 2019-2024 |
| Growth Rate | CAGR of 7.80% from 2019-2033 |
| Segmentation |
|
Table of Contents
- 1. Introduction
- 1.1. Research Scope
- 1.2. Market Segmentation
- 1.3. Research Methodology
- 1.4. Definitions and Assumptions
- 2. Executive Summary
- 2.1. Introduction
- 3. Market Dynamics
- 3.1. Introduction
- 3.2. Market Drivers
- 3.2.1. ; Increasing Intiatives to switch to LED lighting Solutions
- 3.3. Market Restrains
- 3.3.1. High Initial Investment
- 3.4. Market Trends
- 3.4.1. ZigBee Wireless Communication Switches to Gain Significant Growth
- 4. Market Factor Analysis
- 4.1. Porters Five Forces
- 4.2. Supply/Value Chain
- 4.3. PESTEL analysis
- 4.4. Market Entropy
- 4.5. Patent/Trademark Analysis
- 5. Global Light Control Switches Industry Analysis, Insights and Forecast, 2019-2031
- 5.1. Market Analysis, Insights and Forecast - by Communication Technology
- 5.1.1. Wired
- 5.1.2. Wireless
- 5.2. Market Analysis, Insights and Forecast - by Application
- 5.2.1. Indoor
- 5.2.2. Outdoor
- 5.3. Market Analysis, Insights and Forecast - by Light Source
- 5.3.1. Incandescent
- 5.3.2. Fluorescent (FL)
- 5.3.3. Light-Emitting diode (LED)
- 5.3.4. Other Light Sources
- 5.4. Market Analysis, Insights and Forecast - by Region
- 5.4.1. North America
- 5.4.2. Europe
- 5.4.3. Asia Pacific
- 5.4.4. Latin America
- 5.4.5. Middle East
- 5.1. Market Analysis, Insights and Forecast - by Communication Technology
- 6. North America Light Control Switches Industry Analysis, Insights and Forecast, 2019-2031
- 6.1. Market Analysis, Insights and Forecast - by Communication Technology
- 6.1.1. Wired
- 6.1.2. Wireless
- 6.2. Market Analysis, Insights and Forecast - by Application
- 6.2.1. Indoor
- 6.2.2. Outdoor
- 6.3. Market Analysis, Insights and Forecast - by Light Source
- 6.3.1. Incandescent
- 6.3.2. Fluorescent (FL)
- 6.3.3. Light-Emitting diode (LED)
- 6.3.4. Other Light Sources
- 6.1. Market Analysis, Insights and Forecast - by Communication Technology
- 7. Europe Light Control Switches Industry Analysis, Insights and Forecast, 2019-2031
- 7.1. Market Analysis, Insights and Forecast - by Communication Technology
- 7.1.1. Wired
- 7.1.2. Wireless
- 7.2. Market Analysis, Insights and Forecast - by Application
- 7.2.1. Indoor
- 7.2.2. Outdoor
- 7.3. Market Analysis, Insights and Forecast - by Light Source
- 7.3.1. Incandescent
- 7.3.2. Fluorescent (FL)
- 7.3.3. Light-Emitting diode (LED)
- 7.3.4. Other Light Sources
- 7.1. Market Analysis, Insights and Forecast - by Communication Technology
- 8. Asia Pacific Light Control Switches Industry Analysis, Insights and Forecast, 2019-2031
- 8.1. Market Analysis, Insights and Forecast - by Communication Technology
- 8.1.1. Wired
- 8.1.2. Wireless
- 8.2. Market Analysis, Insights and Forecast - by Application
- 8.2.1. Indoor
- 8.2.2. Outdoor
- 8.3. Market Analysis, Insights and Forecast - by Light Source
- 8.3.1. Incandescent
- 8.3.2. Fluorescent (FL)
- 8.3.3. Light-Emitting diode (LED)
- 8.3.4. Other Light Sources
- 8.1. Market Analysis, Insights and Forecast - by Communication Technology
- 9. Latin America Light Control Switches Industry Analysis, Insights and Forecast, 2019-2031
- 9.1. Market Analysis, Insights and Forecast - by Communication Technology
- 9.1.1. Wired
- 9.1.2. Wireless
- 9.2. Market Analysis, Insights and Forecast - by Application
- 9.2.1. Indoor
- 9.2.2. Outdoor
- 9.3. Market Analysis, Insights and Forecast - by Light Source
- 9.3.1. Incandescent
- 9.3.2. Fluorescent (FL)
- 9.3.3. Light-Emitting diode (LED)
- 9.3.4. Other Light Sources
- 9.1. Market Analysis, Insights and Forecast - by Communication Technology
- 10. Middle East Light Control Switches Industry Analysis, Insights and Forecast, 2019-2031
- 10.1. Market Analysis, Insights and Forecast - by Communication Technology
- 10.1.1. Wired
- 10.1.2. Wireless
- 10.2. Market Analysis, Insights and Forecast - by Application
- 10.2.1. Indoor
- 10.2.2. Outdoor
- 10.3. Market Analysis, Insights and Forecast - by Light Source
- 10.3.1. Incandescent
- 10.3.2. Fluorescent (FL)
- 10.3.3. Light-Emitting diode (LED)
- 10.3.4. Other Light Sources
- 10.1. Market Analysis, Insights and Forecast - by Communication Technology
- 11. North America Light Control Switches Industry Analysis, Insights and Forecast, 2019-2031
- 11.1. Market Analysis, Insights and Forecast - By Country/Sub-region
- 11.1.1.
- 12. Europe Light Control Switches Industry Analysis, Insights and Forecast, 2019-2031
- 12.1. Market Analysis, Insights and Forecast - By Country/Sub-region
- 12.1.1.
- 13. Asia Pacific Light Control Switches Industry Analysis, Insights and Forecast, 2019-2031
- 13.1. Market Analysis, Insights and Forecast - By Country/Sub-region
- 13.1.1.
- 14. Latin America Light Control Switches Industry Analysis, Insights and Forecast, 2019-2031
- 14.1. Market Analysis, Insights and Forecast - By Country/Sub-region
- 14.1.1.
- 15. Middle East Light Control Switches Industry Analysis, Insights and Forecast, 2019-2031
- 15.1. Market Analysis, Insights and Forecast - By Country/Sub-region
- 15.1.1.
- 16. Competitive Analysis
- 16.1. Global Market Share Analysis 2024
- 16.2. Company Profiles
- 16.2.1 Honeywell International Inc
- 16.2.1.1. Overview
- 16.2.1.2. Products
- 16.2.1.3. SWOT Analysis
- 16.2.1.4. Recent Developments
- 16.2.1.5. Financials (Based on Availability)
- 16.2.2 Signify BV
- 16.2.2.1. Overview
- 16.2.2.2. Products
- 16.2.2.3. SWOT Analysis
- 16.2.2.4. Recent Developments
- 16.2.2.5. Financials (Based on Availability)
- 16.2.3 Lutron electronics co Inc
- 16.2.3.1. Overview
- 16.2.3.2. Products
- 16.2.3.3. SWOT Analysis
- 16.2.3.4. Recent Developments
- 16.2.3.5. Financials (Based on Availability)
- 16.2.4 Leviton Manufacturing Company Inc
- 16.2.4.1. Overview
- 16.2.4.2. Products
- 16.2.4.3. SWOT Analysis
- 16.2.4.4. Recent Developments
- 16.2.4.5. Financials (Based on Availability)
- 16.2.5 Hubbell Inc
- 16.2.5.1. Overview
- 16.2.5.2. Products
- 16.2.5.3. SWOT Analysis
- 16.2.5.4. Recent Developments
- 16.2.5.5. Financials (Based on Availability)
- 16.2.6 Legrand SA
- 16.2.6.1. Overview
- 16.2.6.2. Products
- 16.2.6.3. SWOT Analysis
- 16.2.6.4. Recent Developments
- 16.2.6.5. Financials (Based on Availability)
- 16.2.7 Schneider Electric SE
- 16.2.7.1. Overview
- 16.2.7.2. Products
- 16.2.7.3. SWOT Analysis
- 16.2.7.4. Recent Developments
- 16.2.7.5. Financials (Based on Availability)
- 16.2.8 Eaton Corporation PLC
- 16.2.8.1. Overview
- 16.2.8.2. Products
- 16.2.8.3. SWOT Analysis
- 16.2.8.4. Recent Developments
- 16.2.8.5. Financials (Based on Availability)
- 16.2.9 Osram GmbH
- 16.2.9.1. Overview
- 16.2.9.2. Products
- 16.2.9.3. SWOT Analysis
- 16.2.9.4. Recent Developments
- 16.2.9.5. Financials (Based on Availability)
- 16.2.10 Acuity Brands Inc
- 16.2.10.1. Overview
- 16.2.10.2. Products
- 16.2.10.3. SWOT Analysis
- 16.2.10.4. Recent Developments
- 16.2.10.5. Financials (Based on Availability)
- 16.2.11 Havells India Limite
- 16.2.11.1. Overview
- 16.2.11.2. Products
- 16.2.11.3. SWOT Analysis
- 16.2.11.4. Recent Developments
- 16.2.11.5. Financials (Based on Availability)
- 16.2.1 Honeywell International Inc
List of Figures
- Figure 1: Global Light Control Switches Industry Revenue Breakdown (Million, %) by Region 2024 & 2032
- Figure 2: North America Light Control Switches Industry Revenue (Million), by Country 2024 & 2032
- Figure 3: North America Light Control Switches Industry Revenue Share (%), by Country 2024 & 2032
- Figure 4: Europe Light Control Switches Industry Revenue (Million), by Country 2024 & 2032
- Figure 5: Europe Light Control Switches Industry Revenue Share (%), by Country 2024 & 2032
- Figure 6: Asia Pacific Light Control Switches Industry Revenue (Million), by Country 2024 & 2032
- Figure 7: Asia Pacific Light Control Switches Industry Revenue Share (%), by Country 2024 & 2032
- Figure 8: Latin America Light Control Switches Industry Revenue (Million), by Country 2024 & 2032
- Figure 9: Latin America Light Control Switches Industry Revenue Share (%), by Country 2024 & 2032
- Figure 10: Middle East Light Control Switches Industry Revenue (Million), by Country 2024 & 2032
- Figure 11: Middle East Light Control Switches Industry Revenue Share (%), by Country 2024 & 2032
- Figure 12: North America Light Control Switches Industry Revenue (Million), by Communication Technology 2024 & 2032
- Figure 13: North America Light Control Switches Industry Revenue Share (%), by Communication Technology 2024 & 2032
- Figure 14: North America Light Control Switches Industry Revenue (Million), by Application 2024 & 2032
- Figure 15: North America Light Control Switches Industry Revenue Share (%), by Application 2024 & 2032
- Figure 16: North America Light Control Switches Industry Revenue (Million), by Light Source 2024 & 2032
- Figure 17: North America Light Control Switches Industry Revenue Share (%), by Light Source 2024 & 2032
- Figure 18: North America Light Control Switches Industry Revenue (Million), by Country 2024 & 2032
- Figure 19: North America Light Control Switches Industry Revenue Share (%), by Country 2024 & 2032
- Figure 20: Europe Light Control Switches Industry Revenue (Million), by Communication Technology 2024 & 2032
- Figure 21: Europe Light Control Switches Industry Revenue Share (%), by Communication Technology 2024 & 2032
- Figure 22: Europe Light Control Switches Industry Revenue (Million), by Application 2024 & 2032
- Figure 23: Europe Light Control Switches Industry Revenue Share (%), by Application 2024 & 2032
- Figure 24: Europe Light Control Switches Industry Revenue (Million), by Light Source 2024 & 2032
- Figure 25: Europe Light Control Switches Industry Revenue Share (%), by Light Source 2024 & 2032
- Figure 26: Europe Light Control Switches Industry Revenue (Million), by Country 2024 & 2032
- Figure 27: Europe Light Control Switches Industry Revenue Share (%), by Country 2024 & 2032
- Figure 28: Asia Pacific Light Control Switches Industry Revenue (Million), by Communication Technology 2024 & 2032
- Figure 29: Asia Pacific Light Control Switches Industry Revenue Share (%), by Communication Technology 2024 & 2032
- Figure 30: Asia Pacific Light Control Switches Industry Revenue (Million), by Application 2024 & 2032
- Figure 31: Asia Pacific Light Control Switches Industry Revenue Share (%), by Application 2024 & 2032
- Figure 32: Asia Pacific Light Control Switches Industry Revenue (Million), by Light Source 2024 & 2032
- Figure 33: Asia Pacific Light Control Switches Industry Revenue Share (%), by Light Source 2024 & 2032
- Figure 34: Asia Pacific Light Control Switches Industry Revenue (Million), by Country 2024 & 2032
- Figure 35: Asia Pacific Light Control Switches Industry Revenue Share (%), by Country 2024 & 2032
- Figure 36: Latin America Light Control Switches Industry Revenue (Million), by Communication Technology 2024 & 2032
- Figure 37: Latin America Light Control Switches Industry Revenue Share (%), by Communication Technology 2024 & 2032
- Figure 38: Latin America Light Control Switches Industry Revenue (Million), by Application 2024 & 2032
- Figure 39: Latin America Light Control Switches Industry Revenue Share (%), by Application 2024 & 2032
- Figure 40: Latin America Light Control Switches Industry Revenue (Million), by Light Source 2024 & 2032
- Figure 41: Latin America Light Control Switches Industry Revenue Share (%), by Light Source 2024 & 2032
- Figure 42: Latin America Light Control Switches Industry Revenue (Million), by Country 2024 & 2032
- Figure 43: Latin America Light Control Switches Industry Revenue Share (%), by Country 2024 & 2032
- Figure 44: Middle East Light Control Switches Industry Revenue (Million), by Communication Technology 2024 & 2032
- Figure 45: Middle East Light Control Switches Industry Revenue Share (%), by Communication Technology 2024 & 2032
- Figure 46: Middle East Light Control Switches Industry Revenue (Million), by Application 2024 & 2032
- Figure 47: Middle East Light Control Switches Industry Revenue Share (%), by Application 2024 & 2032
- Figure 48: Middle East Light Control Switches Industry Revenue (Million), by Light Source 2024 & 2032
- Figure 49: Middle East Light Control Switches Industry Revenue Share (%), by Light Source 2024 & 2032
- Figure 50: Middle East Light Control Switches Industry Revenue (Million), by Country 2024 & 2032
- Figure 51: Middle East Light Control Switches Industry Revenue Share (%), by Country 2024 & 2032
List of Tables
- Table 1: Global Light Control Switches Industry Revenue Million Forecast, by Region 2019 & 2032
- Table 2: Global Light Control Switches Industry Revenue Million Forecast, by Communication Technology 2019 & 2032
- Table 3: Global Light Control Switches Industry Revenue Million Forecast, by Application 2019 & 2032
- Table 4: Global Light Control Switches Industry Revenue Million Forecast, by Light Source 2019 & 2032
- Table 5: Global Light Control Switches Industry Revenue Million Forecast, by Region 2019 & 2032
- Table 6: Global Light Control Switches Industry Revenue Million Forecast, by Country 2019 & 2032
- Table 7: Light Control Switches Industry Revenue (Million) Forecast, by Application 2019 & 2032
- Table 8: Global Light Control Switches Industry Revenue Million Forecast, by Country 2019 & 2032
- Table 9: Light Control Switches Industry Revenue (Million) Forecast, by Application 2019 & 2032
- Table 10: Global Light Control Switches Industry Revenue Million Forecast, by Country 2019 & 2032
- Table 11: Light Control Switches Industry Revenue (Million) Forecast, by Application 2019 & 2032
- Table 12: Global Light Control Switches Industry Revenue Million Forecast, by Country 2019 & 2032
- Table 13: Light Control Switches Industry Revenue (Million) Forecast, by Application 2019 & 2032
- Table 14: Global Light Control Switches Industry Revenue Million Forecast, by Country 2019 & 2032
- Table 15: Light Control Switches Industry Revenue (Million) Forecast, by Application 2019 & 2032
- Table 16: Global Light Control Switches Industry Revenue Million Forecast, by Communication Technology 2019 & 2032
- Table 17: Global Light Control Switches Industry Revenue Million Forecast, by Application 2019 & 2032
- Table 18: Global Light Control Switches Industry Revenue Million Forecast, by Light Source 2019 & 2032
- Table 19: Global Light Control Switches Industry Revenue Million Forecast, by Country 2019 & 2032
- Table 20: Global Light Control Switches Industry Revenue Million Forecast, by Communication Technology 2019 & 2032
- Table 21: Global Light Control Switches Industry Revenue Million Forecast, by Application 2019 & 2032
- Table 22: Global Light Control Switches Industry Revenue Million Forecast, by Light Source 2019 & 2032
- Table 23: Global Light Control Switches Industry Revenue Million Forecast, by Country 2019 & 2032
- Table 24: Global Light Control Switches Industry Revenue Million Forecast, by Communication Technology 2019 & 2032
- Table 25: Global Light Control Switches Industry Revenue Million Forecast, by Application 2019 & 2032
- Table 26: Global Light Control Switches Industry Revenue Million Forecast, by Light Source 2019 & 2032
- Table 27: Global Light Control Switches Industry Revenue Million Forecast, by Country 2019 & 2032
- Table 28: Global Light Control Switches Industry Revenue Million Forecast, by Communication Technology 2019 & 2032
- Table 29: Global Light Control Switches Industry Revenue Million Forecast, by Application 2019 & 2032
- Table 30: Global Light Control Switches Industry Revenue Million Forecast, by Light Source 2019 & 2032
- Table 31: Global Light Control Switches Industry Revenue Million Forecast, by Country 2019 & 2032
- Table 32: Global Light Control Switches Industry Revenue Million Forecast, by Communication Technology 2019 & 2032
- Table 33: Global Light Control Switches Industry Revenue Million Forecast, by Application 2019 & 2032
- Table 34: Global Light Control Switches Industry Revenue Million Forecast, by Light Source 2019 & 2032
- Table 35: Global Light Control Switches Industry Revenue Million Forecast, by Country 2019 & 2032
Frequently Asked Questions
1. What is the projected Compound Annual Growth Rate (CAGR) of the Light Control Switches Industry?
The projected CAGR is approximately 7.80%.
2. Which companies are prominent players in the Light Control Switches Industry?
Key companies in the market include Honeywell International Inc, Signify BV, Lutron electronics co Inc, Leviton Manufacturing Company Inc, Hubbell Inc, Legrand SA, Schneider Electric SE, Eaton Corporation PLC, Osram GmbH, Acuity Brands Inc, Havells India Limite.
3. What are the main segments of the Light Control Switches Industry?
The market segments include Communication Technology, Application, Light Source.
4. Can you provide details about the market size?
The market size is estimated to be USD XX Million as of 2022.
5. What are some drivers contributing to market growth?
; Increasing Intiatives to switch to LED lighting Solutions.
6. What are the notable trends driving market growth?
ZigBee Wireless Communication Switches to Gain Significant Growth.
7. Are there any restraints impacting market growth?
High Initial Investment.
8. Can you provide examples of recent developments in the market?
N/A
9. What pricing options are available for accessing the report?
Pricing options include single-user, multi-user, and enterprise licenses priced at USD 4750, USD 5250, and USD 8750 respectively.
10. Is the market size provided in terms of value or volume?
The market size is provided in terms of value, measured in Million.
11. Are there any specific market keywords associated with the report?
Yes, the market keyword associated with the report is "Light Control Switches Industry," which aids in identifying and referencing the specific market segment covered.
12. How do I determine which pricing option suits my needs best?
The pricing options vary based on user requirements and access needs. Individual users may opt for single-user licenses, while businesses requiring broader access may choose multi-user or enterprise licenses for cost-effective access to the report.
13. Are there any additional resources or data provided in the Light Control Switches Industry report?
While the report offers comprehensive insights, it's advisable to review the specific contents or supplementary materials provided to ascertain if additional resources or data are available.
14. How can I stay updated on further developments or reports in the Light Control Switches Industry?
To stay informed about further developments, trends, and reports in the Light Control Switches Industry, consider subscribing to industry newsletters, following relevant companies and organizations, or regularly checking reputable industry news sources and publications.
Methodology
Step 1 - Identification of Relevant Samples Size from Population Database


Step 2 - Approaches for Defining Global Market Size (Value, Volume* & Price*)

Note*: In applicable scenarios
Step 3 - Data Sources
Primary Research
- Web Analytics
- Survey Reports
- Research Institute
- Latest Research Reports
- Opinion Leaders
Secondary Research
- Annual Reports
- White Paper
- Latest Press Release
- Industry Association
- Paid Database
- Investor Presentations

Step 4 - Data Triangulation
Involves using different sources of information in order to increase the validity of a study
These sources are likely to be stakeholders in a program - participants, other researchers, program staff, other community members, and so on.
Then we put all data in single framework & apply various statistical tools to find out the dynamic on the market.
During the analysis stage, feedback from the stakeholder groups would be compared to determine areas of agreement as well as areas of divergence
