

Key Insights
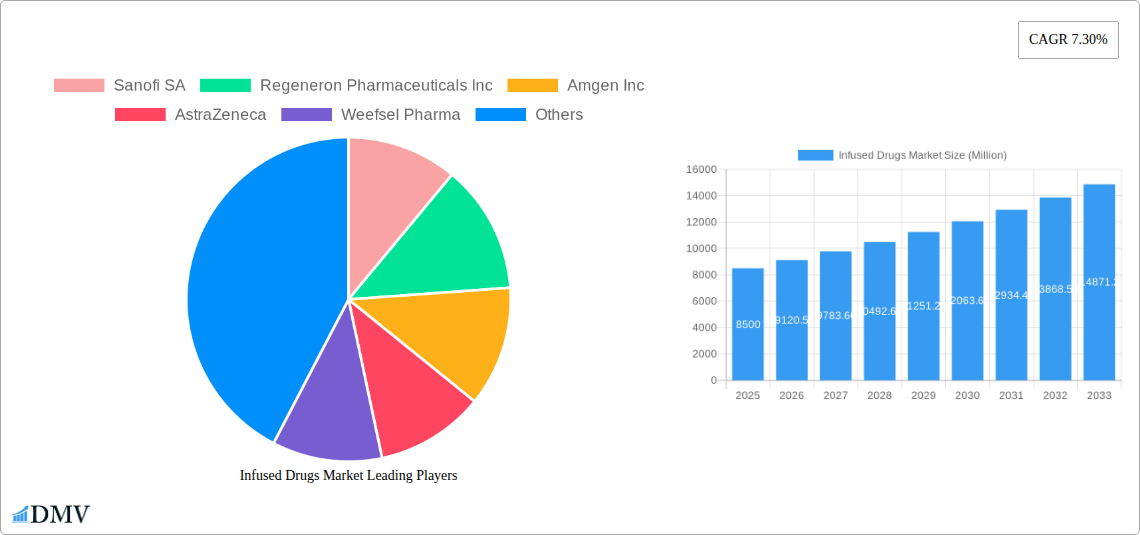
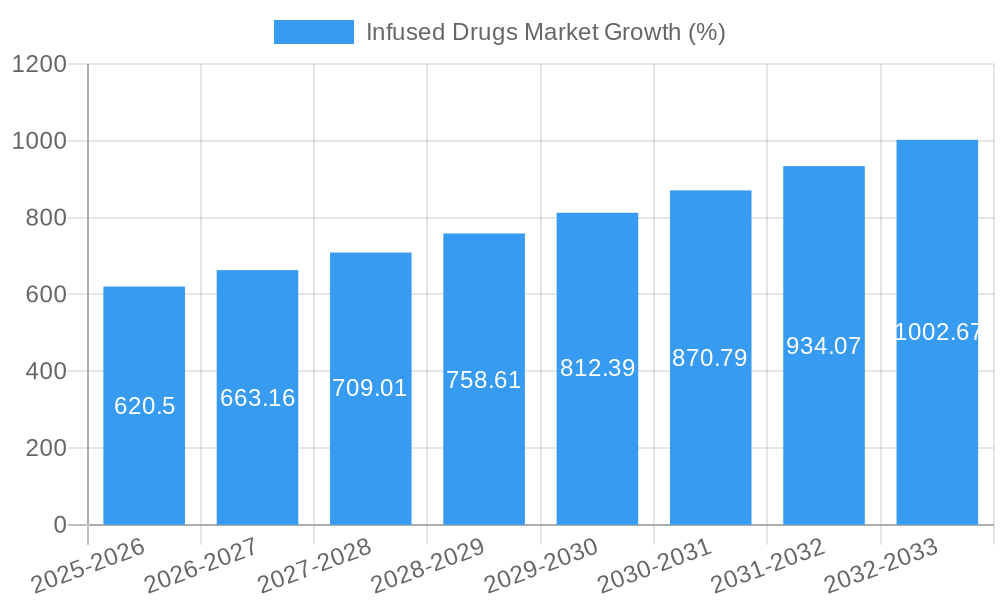
The infused drugs market, valued at $8.5 billion in 2025, is projected to experience robust growth, driven by a compound annual growth rate (CAGR) of 7.30% from 2025 to 2033. This expansion is fueled by several key factors. The increasing prevalence of chronic diseases such as cancer, rheumatoid arthritis, and diabetes necessitates the use of infused drugs for effective treatment. Advancements in drug delivery technologies, particularly the development of biosimilars and targeted therapies, are contributing to market expansion. Furthermore, the growing geriatric population, which is more susceptible to chronic illnesses, presents a significant growth opportunity. The oncology therapeutic area currently dominates the market, followed by gastrointestinal diseases and rheumatoid arthritis. However, the increasing research and development efforts focused on other therapeutic areas, particularly cardiology, neurology, and immune deficiencies, are expected to diversify the market landscape in the coming years. Competition among major pharmaceutical companies like Sanofi, Regeneron, Amgen, and Pfizer, along with regional players, is driving innovation and affordability. While regulatory hurdles and high treatment costs pose certain challenges, the overall market outlook remains positive due to increasing healthcare spending and a rising demand for effective treatment options.
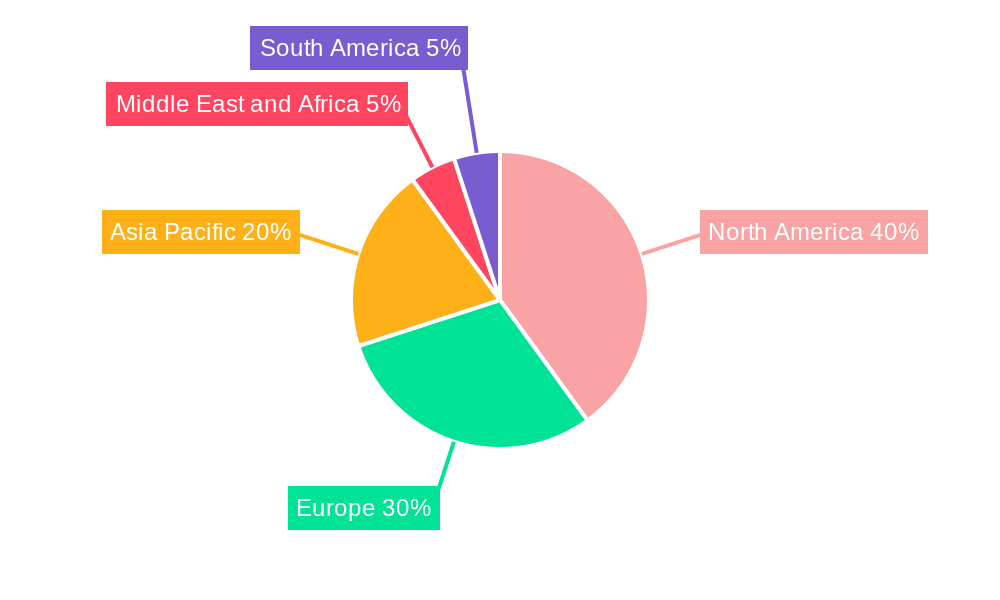
The geographical distribution of the market is expected to be heavily skewed toward developed regions like North America and Europe in the initial years of the forecast period due to higher healthcare infrastructure and spending capabilities. However, rapid economic growth and increasing healthcare awareness in regions like Asia-Pacific are projected to contribute significantly to market growth in the latter half of the forecast period. The market segmentation by drug type (small molecules and biologics) further highlights growth opportunities. Biologics are anticipated to witness a faster growth rate compared to small molecules due to their higher efficacy in treating complex diseases. This segmental analysis will be crucial in guiding strategic investment and product development decisions by market players. Continued innovation and focus on improving patient outcomes will be critical for sustained growth in this dynamic market.
Infused Drugs Market: A Comprehensive Report (2019-2033)
This insightful report provides a detailed analysis of the Infused Drugs market, encompassing market size, growth drivers, challenges, and future opportunities. Spanning the period from 2019 to 2033, with a base year of 2025 and forecast period of 2025-2033, this report is a crucial resource for stakeholders seeking to understand and navigate this dynamic market. The total market value is projected to reach xx Million by 2033.
Infused Drugs Market Composition & Trends
This section delves into the intricate landscape of the infused drugs market, offering a comprehensive overview of market concentration, key innovation drivers, regulatory hurdles, substitute product analysis, end-user profiles, and the impact of mergers and acquisitions (M&A) activity. The market is characterized by a moderately concentrated structure, with a few major players holding significant market share. However, the presence of numerous smaller companies focusing on niche therapeutic areas and innovative delivery systems fosters a dynamic competitive environment.
- Market Share Distribution: The top 5 companies (Sanofi SA, Regeneron Pharmaceuticals Inc, Amgen Inc, AstraZeneca, and Pfizer Inc) collectively hold approximately 60% of the global market share in 2025, while the remaining share is distributed among numerous smaller players.
- Innovation Catalysts: Significant investments in research and development (R&D), particularly in areas like targeted therapies and advanced drug delivery systems, are driving innovation. This is further fueled by increasing prevalence of chronic diseases and rising demand for effective treatment options.
- Regulatory Landscape: Stringent regulatory requirements and approval processes, while ensuring patient safety, create challenges for market entry and product approval. However, streamlined pathways for innovative therapies are gradually emerging.
- Substitute Products: The availability of oral and other non-infused drug formulations presents a degree of substitutability, although infused drugs often remain the preferred option for certain conditions demanding rapid or targeted drug delivery.
- End-User Profiles: The primary end-users are hospitals, clinics, and specialized infusion centers. The growing number of outpatient infusion centers and home healthcare services is reshaping market dynamics.
- M&A Activities: The infused drugs market has witnessed significant M&A activity in recent years, with deal values exceeding xx Million in the period between 2020 and 2024. These activities often involve strategic acquisitions to expand product portfolios and gain access to new technologies.
Infused Drugs Market Industry Evolution
This section provides a detailed analysis of the Infused Drugs market's growth trajectory, technological advancements, and shifting consumer demands from 2019 to 2025. The market experienced a Compound Annual Growth Rate (CAGR) of xx% during the historical period (2019-2024), driven by factors such as the increasing prevalence of chronic diseases, rising healthcare expenditure, and technological advancements in drug delivery systems. Technological innovations, such as targeted drug delivery systems and biosimilars, have played a pivotal role in shaping market dynamics. Consumer demand is shifting towards more convenient and effective treatment options, impacting product development and market penetration strategies. For instance, the increasing adoption of subcutaneous infusion systems has led to the development of smaller, more user-friendly devices, improving patient compliance and treatment outcomes. Adoption rates of these novel drug delivery methods are expected to grow by xx% annually over the forecast period (2025-2033).
Leading Regions, Countries, or Segments in Infused Drugs Market
North America currently dominates the infused drugs market, followed by Europe and Asia-Pacific. This dominance is primarily attributed to high healthcare expenditure, advanced healthcare infrastructure, and a significant number of patients suffering from chronic illnesses.
- Key Drivers for North America's Dominance:
- High prevalence of chronic diseases.
- Robust healthcare infrastructure and advanced medical facilities.
- Significant R&D investment by pharmaceutical companies.
- Favorable regulatory environment.
- Oncology Segment Leadership: The oncology segment represents a significant share of the market, fueled by the rising incidence of cancer and the development of novel targeted therapies.
- Biologics Drug Type: The biologics segment is experiencing rapid growth, driven by the increasing efficacy and safety of biologics compared to small molecule drugs.
- Other Key Segments: Gastrointestinal diseases, rheumatoid arthritis, and immune deficiencies represent other substantial segments, fueled by an aging population and increasing prevalence of these conditions.
Factors such as the rising incidence of chronic diseases and increased healthcare spending are further contributing to this sector's growth in these regions. The Asia-Pacific market is predicted to show significant growth over the forecast period owing to increasing healthcare awareness, expanding healthcare infrastructure, and rising disposable incomes.
Infused Drugs Market Product Innovations
Recent product innovations in the infused drugs market focus primarily on improving drug delivery systems, enhancing efficacy, and minimizing adverse effects. This includes the development of targeted therapies with reduced side effects, improved formulations for subcutaneous administration, and the introduction of novel drug delivery technologies enabling more convenient and efficient administration. These innovations are accompanied by advancements in biosimilar development, offering cost-effective alternatives to existing biologics.
Propelling Factors for Infused Drugs Market Growth
Several factors fuel the growth of the Infused Drugs market. The rising prevalence of chronic diseases, such as cancer, diabetes, and autoimmune disorders, drives the demand for effective treatments. Technological advancements, including targeted drug delivery and biosimilar development, contribute significantly. Favorable regulatory environments in several countries further stimulate market growth by facilitating product approvals and market entry. Increased healthcare expenditure globally, especially in emerging economies, adds to the market's growth trajectory.
Obstacles in the Infused Drugs Market
The Infused Drugs market faces certain challenges. Stringent regulatory requirements can delay product approvals, impacting market entry timelines and limiting competitiveness. Potential supply chain disruptions, arising from manufacturing complexities or global events, can lead to product shortages and price volatility. Furthermore, intense competition among established players and the emergence of new entrants pose a challenge, necessitating continuous innovation and strategic differentiation. These obstacles could cumulatively restrain market growth by approximately xx% annually by 2030.
Future Opportunities in Infused Drugs Market
The Infused Drugs market presents exciting opportunities. Expanding into new and emerging markets, especially in developing economies with growing healthcare needs, presents significant market expansion prospects. The continuous development of novel drug delivery technologies, such as targeted therapies, personalized medicine, and smart delivery systems, will continue to drive growth. Lastly, the increasing focus on biosimilars offers cost-effective treatment options, broadening the market's potential.
Major Players in the Infused Drugs Market Ecosystem
- Sanofi SA
- Regeneron Pharmaceuticals Inc
- Amgen Inc
- AstraZeneca
- Weefsel Pharma
- Parenteral Drugs (India) Limited
- Teva Pharmaceutical Industries Ltd
- Eisai Co Ltd
- Bristol-Myers Squibb Company
- Pfizer Inc
Key Developments in Infused Drugs Market Industry
- September 2023: Eisai Co. Ltd and Biogen Inc. reported the approval of LEQEMBI intravenous infusion in Japan for treating Alzheimer's Disease, signifying a major advancement in dementia treatment.
- August 2023: The MHRA in Britain approved Roche’s Tecentriq SC using Halozyme’s Enhaze drug delivery technology, demonstrating the advancements in subcutaneous delivery systems.
Strategic Infused Drugs Market Forecast
The Infused Drugs market is poised for robust growth over the forecast period (2025-2033), fueled by the rising prevalence of chronic diseases, technological advancements, and expanding healthcare infrastructure. The convergence of these factors creates a favorable environment for continued market expansion, with substantial opportunities for both established players and emerging companies. The market’s future success hinges on continuous innovation, strategic partnerships, and a keen focus on delivering effective and accessible treatments to a growing patient population.
Infused Drugs Market Segmentation
-
1. Drug Type
- 1.1. Small Molecules
- 1.2. Biologics
-
2. Therapeutic Area
- 2.1. Oncology
- 2.2. Gastrointestinal Diseases
- 2.3. Rheumatoid Arthritis
- 2.4. Immune Deficiencies
- 2.5. Cardiology
- 2.6. Neurology
- 2.7. Diabetes
- 2.8. Other Therapeutic Areas
Infused Drugs Market Segmentation By Geography
-
1. North America
- 1.1. United States
- 1.2. Canada
- 1.3. Mexico
-
2. Europe
- 2.1. Germany
- 2.2. United Kingdom
- 2.3. France
- 2.4. Italy
- 2.5. Spain
- 2.6. Rest of Europe
-
3. Asia Pacific
- 3.1. China
- 3.2. Japan
- 3.3. India
- 3.4. Australia
- 3.5. South Korea
- 3.6. Rest of Asia Pacific
-
4. Middle East and Africa
- 4.1. GCC
- 4.2. South Africa
- 4.3. Rest of Middle East and Africa
-
5. South America
- 5.1. Brazil
- 5.2. Argentina
- 5.3. Rest of South America
Infused Drugs Market REPORT HIGHLIGHTS
| Aspects | Details |
|---|---|
| Study Period | 2019-2033 |
| Base Year | 2024 |
| Estimated Year | 2025 |
| Forecast Period | 2025-2033 |
| Historical Period | 2019-2024 |
| Growth Rate | CAGR of 7.30% from 2019-2033 |
| Segmentation |
|
Table of Contents
- 1. Introduction
- 1.1. Research Scope
- 1.2. Market Segmentation
- 1.3. Research Methodology
- 1.4. Definitions and Assumptions
- 2. Executive Summary
- 2.1. Introduction
- 3. Market Dynamics
- 3.1. Introduction
- 3.2. Market Drivers
- 3.2.1. Increase in the Prevalence of Chronic Diseases; Increasing Geriatric Population
- 3.3. Market Restrains
- 3.3.1. Side Effects Associated with the Medications
- 3.4. Market Trends
- 3.4.1. Oncology is Expected to Have Significant Market Share During the Forecast Period
- 4. Market Factor Analysis
- 4.1. Porters Five Forces
- 4.2. Supply/Value Chain
- 4.3. PESTEL analysis
- 4.4. Market Entropy
- 4.5. Patent/Trademark Analysis
- 5. Global Infused Drugs Market Analysis, Insights and Forecast, 2019-2031
- 5.1. Market Analysis, Insights and Forecast - by Drug Type
- 5.1.1. Small Molecules
- 5.1.2. Biologics
- 5.2. Market Analysis, Insights and Forecast - by Therapeutic Area
- 5.2.1. Oncology
- 5.2.2. Gastrointestinal Diseases
- 5.2.3. Rheumatoid Arthritis
- 5.2.4. Immune Deficiencies
- 5.2.5. Cardiology
- 5.2.6. Neurology
- 5.2.7. Diabetes
- 5.2.8. Other Therapeutic Areas
- 5.3. Market Analysis, Insights and Forecast - by Region
- 5.3.1. North America
- 5.3.2. Europe
- 5.3.3. Asia Pacific
- 5.3.4. Middle East and Africa
- 5.3.5. South America
- 5.1. Market Analysis, Insights and Forecast - by Drug Type
- 6. North America Infused Drugs Market Analysis, Insights and Forecast, 2019-2031
- 6.1. Market Analysis, Insights and Forecast - by Drug Type
- 6.1.1. Small Molecules
- 6.1.2. Biologics
- 6.2. Market Analysis, Insights and Forecast - by Therapeutic Area
- 6.2.1. Oncology
- 6.2.2. Gastrointestinal Diseases
- 6.2.3. Rheumatoid Arthritis
- 6.2.4. Immune Deficiencies
- 6.2.5. Cardiology
- 6.2.6. Neurology
- 6.2.7. Diabetes
- 6.2.8. Other Therapeutic Areas
- 6.1. Market Analysis, Insights and Forecast - by Drug Type
- 7. Europe Infused Drugs Market Analysis, Insights and Forecast, 2019-2031
- 7.1. Market Analysis, Insights and Forecast - by Drug Type
- 7.1.1. Small Molecules
- 7.1.2. Biologics
- 7.2. Market Analysis, Insights and Forecast - by Therapeutic Area
- 7.2.1. Oncology
- 7.2.2. Gastrointestinal Diseases
- 7.2.3. Rheumatoid Arthritis
- 7.2.4. Immune Deficiencies
- 7.2.5. Cardiology
- 7.2.6. Neurology
- 7.2.7. Diabetes
- 7.2.8. Other Therapeutic Areas
- 7.1. Market Analysis, Insights and Forecast - by Drug Type
- 8. Asia Pacific Infused Drugs Market Analysis, Insights and Forecast, 2019-2031
- 8.1. Market Analysis, Insights and Forecast - by Drug Type
- 8.1.1. Small Molecules
- 8.1.2. Biologics
- 8.2. Market Analysis, Insights and Forecast - by Therapeutic Area
- 8.2.1. Oncology
- 8.2.2. Gastrointestinal Diseases
- 8.2.3. Rheumatoid Arthritis
- 8.2.4. Immune Deficiencies
- 8.2.5. Cardiology
- 8.2.6. Neurology
- 8.2.7. Diabetes
- 8.2.8. Other Therapeutic Areas
- 8.1. Market Analysis, Insights and Forecast - by Drug Type
- 9. Middle East and Africa Infused Drugs Market Analysis, Insights and Forecast, 2019-2031
- 9.1. Market Analysis, Insights and Forecast - by Drug Type
- 9.1.1. Small Molecules
- 9.1.2. Biologics
- 9.2. Market Analysis, Insights and Forecast - by Therapeutic Area
- 9.2.1. Oncology
- 9.2.2. Gastrointestinal Diseases
- 9.2.3. Rheumatoid Arthritis
- 9.2.4. Immune Deficiencies
- 9.2.5. Cardiology
- 9.2.6. Neurology
- 9.2.7. Diabetes
- 9.2.8. Other Therapeutic Areas
- 9.1. Market Analysis, Insights and Forecast - by Drug Type
- 10. South America Infused Drugs Market Analysis, Insights and Forecast, 2019-2031
- 10.1. Market Analysis, Insights and Forecast - by Drug Type
- 10.1.1. Small Molecules
- 10.1.2. Biologics
- 10.2. Market Analysis, Insights and Forecast - by Therapeutic Area
- 10.2.1. Oncology
- 10.2.2. Gastrointestinal Diseases
- 10.2.3. Rheumatoid Arthritis
- 10.2.4. Immune Deficiencies
- 10.2.5. Cardiology
- 10.2.6. Neurology
- 10.2.7. Diabetes
- 10.2.8. Other Therapeutic Areas
- 10.1. Market Analysis, Insights and Forecast - by Drug Type
- 11. North America Infused Drugs Market Analysis, Insights and Forecast, 2019-2031
- 11.1. Market Analysis, Insights and Forecast - By Country/Sub-region
- 11.1.1. undefined
- 12. Europe Infused Drugs Market Analysis, Insights and Forecast, 2019-2031
- 12.1. Market Analysis, Insights and Forecast - By Country/Sub-region
- 12.1.1. undefined
- 13. Asia Pacific Infused Drugs Market Analysis, Insights and Forecast, 2019-2031
- 13.1. Market Analysis, Insights and Forecast - By Country/Sub-region
- 13.1.1. undefined
- 14. Middle East and Africa Infused Drugs Market Analysis, Insights and Forecast, 2019-2031
- 14.1. Market Analysis, Insights and Forecast - By Country/Sub-region
- 14.1.1. undefined
- 15. South America Infused Drugs Market Analysis, Insights and Forecast, 2019-2031
- 15.1. Market Analysis, Insights and Forecast - By Country/Sub-region
- 15.1.1. undefined
- 16. Competitive Analysis
- 16.1. Global Market Share Analysis 2024
- 16.2. Company Profiles
- 16.2.1 Sanofi SA
- 16.2.1.1. Overview
- 16.2.1.2. Products
- 16.2.1.3. SWOT Analysis
- 16.2.1.4. Recent Developments
- 16.2.1.5. Financials (Based on Availability)
- 16.2.2 Regeneron Pharmaceuticals Inc
- 16.2.2.1. Overview
- 16.2.2.2. Products
- 16.2.2.3. SWOT Analysis
- 16.2.2.4. Recent Developments
- 16.2.2.5. Financials (Based on Availability)
- 16.2.3 Amgen Inc
- 16.2.3.1. Overview
- 16.2.3.2. Products
- 16.2.3.3. SWOT Analysis
- 16.2.3.4. Recent Developments
- 16.2.3.5. Financials (Based on Availability)
- 16.2.4 AstraZeneca
- 16.2.4.1. Overview
- 16.2.4.2. Products
- 16.2.4.3. SWOT Analysis
- 16.2.4.4. Recent Developments
- 16.2.4.5. Financials (Based on Availability)
- 16.2.5 Weefsel Pharma
- 16.2.5.1. Overview
- 16.2.5.2. Products
- 16.2.5.3. SWOT Analysis
- 16.2.5.4. Recent Developments
- 16.2.5.5. Financials (Based on Availability)
- 16.2.6 Parenteral Drugs (India) Limited
- 16.2.6.1. Overview
- 16.2.6.2. Products
- 16.2.6.3. SWOT Analysis
- 16.2.6.4. Recent Developments
- 16.2.6.5. Financials (Based on Availability)
- 16.2.7 Teva Pharmaceutical Industries Ltd
- 16.2.7.1. Overview
- 16.2.7.2. Products
- 16.2.7.3. SWOT Analysis
- 16.2.7.4. Recent Developments
- 16.2.7.5. Financials (Based on Availability)
- 16.2.8 Eisai Co Ltd
- 16.2.8.1. Overview
- 16.2.8.2. Products
- 16.2.8.3. SWOT Analysis
- 16.2.8.4. Recent Developments
- 16.2.8.5. Financials (Based on Availability)
- 16.2.9 Bristol-Myers Squibb Company
- 16.2.9.1. Overview
- 16.2.9.2. Products
- 16.2.9.3. SWOT Analysis
- 16.2.9.4. Recent Developments
- 16.2.9.5. Financials (Based on Availability)
- 16.2.10 Pfizer Inc
- 16.2.10.1. Overview
- 16.2.10.2. Products
- 16.2.10.3. SWOT Analysis
- 16.2.10.4. Recent Developments
- 16.2.10.5. Financials (Based on Availability)
- 16.2.1 Sanofi SA
List of Figures
- Figure 1: Global Infused Drugs Market Revenue Breakdown (Million, %) by Region 2024 & 2032
- Figure 2: Global Infused Drugs Market Volume Breakdown (K Unit, %) by Region 2024 & 2032
- Figure 3: North America Infused Drugs Market Revenue (Million), by Country 2024 & 2032
- Figure 4: North America Infused Drugs Market Volume (K Unit), by Country 2024 & 2032
- Figure 5: North America Infused Drugs Market Revenue Share (%), by Country 2024 & 2032
- Figure 6: North America Infused Drugs Market Volume Share (%), by Country 2024 & 2032
- Figure 7: Europe Infused Drugs Market Revenue (Million), by Country 2024 & 2032
- Figure 8: Europe Infused Drugs Market Volume (K Unit), by Country 2024 & 2032
- Figure 9: Europe Infused Drugs Market Revenue Share (%), by Country 2024 & 2032
- Figure 10: Europe Infused Drugs Market Volume Share (%), by Country 2024 & 2032
- Figure 11: Asia Pacific Infused Drugs Market Revenue (Million), by Country 2024 & 2032
- Figure 12: Asia Pacific Infused Drugs Market Volume (K Unit), by Country 2024 & 2032
- Figure 13: Asia Pacific Infused Drugs Market Revenue Share (%), by Country 2024 & 2032
- Figure 14: Asia Pacific Infused Drugs Market Volume Share (%), by Country 2024 & 2032
- Figure 15: Middle East and Africa Infused Drugs Market Revenue (Million), by Country 2024 & 2032
- Figure 16: Middle East and Africa Infused Drugs Market Volume (K Unit), by Country 2024 & 2032
- Figure 17: Middle East and Africa Infused Drugs Market Revenue Share (%), by Country 2024 & 2032
- Figure 18: Middle East and Africa Infused Drugs Market Volume Share (%), by Country 2024 & 2032
- Figure 19: South America Infused Drugs Market Revenue (Million), by Country 2024 & 2032
- Figure 20: South America Infused Drugs Market Volume (K Unit), by Country 2024 & 2032
- Figure 21: South America Infused Drugs Market Revenue Share (%), by Country 2024 & 2032
- Figure 22: South America Infused Drugs Market Volume Share (%), by Country 2024 & 2032
- Figure 23: North America Infused Drugs Market Revenue (Million), by Drug Type 2024 & 2032
- Figure 24: North America Infused Drugs Market Volume (K Unit), by Drug Type 2024 & 2032
- Figure 25: North America Infused Drugs Market Revenue Share (%), by Drug Type 2024 & 2032
- Figure 26: North America Infused Drugs Market Volume Share (%), by Drug Type 2024 & 2032
- Figure 27: North America Infused Drugs Market Revenue (Million), by Therapeutic Area 2024 & 2032
- Figure 28: North America Infused Drugs Market Volume (K Unit), by Therapeutic Area 2024 & 2032
- Figure 29: North America Infused Drugs Market Revenue Share (%), by Therapeutic Area 2024 & 2032
- Figure 30: North America Infused Drugs Market Volume Share (%), by Therapeutic Area 2024 & 2032
- Figure 31: North America Infused Drugs Market Revenue (Million), by Country 2024 & 2032
- Figure 32: North America Infused Drugs Market Volume (K Unit), by Country 2024 & 2032
- Figure 33: North America Infused Drugs Market Revenue Share (%), by Country 2024 & 2032
- Figure 34: North America Infused Drugs Market Volume Share (%), by Country 2024 & 2032
- Figure 35: Europe Infused Drugs Market Revenue (Million), by Drug Type 2024 & 2032
- Figure 36: Europe Infused Drugs Market Volume (K Unit), by Drug Type 2024 & 2032
- Figure 37: Europe Infused Drugs Market Revenue Share (%), by Drug Type 2024 & 2032
- Figure 38: Europe Infused Drugs Market Volume Share (%), by Drug Type 2024 & 2032
- Figure 39: Europe Infused Drugs Market Revenue (Million), by Therapeutic Area 2024 & 2032
- Figure 40: Europe Infused Drugs Market Volume (K Unit), by Therapeutic Area 2024 & 2032
- Figure 41: Europe Infused Drugs Market Revenue Share (%), by Therapeutic Area 2024 & 2032
- Figure 42: Europe Infused Drugs Market Volume Share (%), by Therapeutic Area 2024 & 2032
- Figure 43: Europe Infused Drugs Market Revenue (Million), by Country 2024 & 2032
- Figure 44: Europe Infused Drugs Market Volume (K Unit), by Country 2024 & 2032
- Figure 45: Europe Infused Drugs Market Revenue Share (%), by Country 2024 & 2032
- Figure 46: Europe Infused Drugs Market Volume Share (%), by Country 2024 & 2032
- Figure 47: Asia Pacific Infused Drugs Market Revenue (Million), by Drug Type 2024 & 2032
- Figure 48: Asia Pacific Infused Drugs Market Volume (K Unit), by Drug Type 2024 & 2032
- Figure 49: Asia Pacific Infused Drugs Market Revenue Share (%), by Drug Type 2024 & 2032
- Figure 50: Asia Pacific Infused Drugs Market Volume Share (%), by Drug Type 2024 & 2032
- Figure 51: Asia Pacific Infused Drugs Market Revenue (Million), by Therapeutic Area 2024 & 2032
- Figure 52: Asia Pacific Infused Drugs Market Volume (K Unit), by Therapeutic Area 2024 & 2032
- Figure 53: Asia Pacific Infused Drugs Market Revenue Share (%), by Therapeutic Area 2024 & 2032
- Figure 54: Asia Pacific Infused Drugs Market Volume Share (%), by Therapeutic Area 2024 & 2032
- Figure 55: Asia Pacific Infused Drugs Market Revenue (Million), by Country 2024 & 2032
- Figure 56: Asia Pacific Infused Drugs Market Volume (K Unit), by Country 2024 & 2032
- Figure 57: Asia Pacific Infused Drugs Market Revenue Share (%), by Country 2024 & 2032
- Figure 58: Asia Pacific Infused Drugs Market Volume Share (%), by Country 2024 & 2032
- Figure 59: Middle East and Africa Infused Drugs Market Revenue (Million), by Drug Type 2024 & 2032
- Figure 60: Middle East and Africa Infused Drugs Market Volume (K Unit), by Drug Type 2024 & 2032
- Figure 61: Middle East and Africa Infused Drugs Market Revenue Share (%), by Drug Type 2024 & 2032
- Figure 62: Middle East and Africa Infused Drugs Market Volume Share (%), by Drug Type 2024 & 2032
- Figure 63: Middle East and Africa Infused Drugs Market Revenue (Million), by Therapeutic Area 2024 & 2032
- Figure 64: Middle East and Africa Infused Drugs Market Volume (K Unit), by Therapeutic Area 2024 & 2032
- Figure 65: Middle East and Africa Infused Drugs Market Revenue Share (%), by Therapeutic Area 2024 & 2032
- Figure 66: Middle East and Africa Infused Drugs Market Volume Share (%), by Therapeutic Area 2024 & 2032
- Figure 67: Middle East and Africa Infused Drugs Market Revenue (Million), by Country 2024 & 2032
- Figure 68: Middle East and Africa Infused Drugs Market Volume (K Unit), by Country 2024 & 2032
- Figure 69: Middle East and Africa Infused Drugs Market Revenue Share (%), by Country 2024 & 2032
- Figure 70: Middle East and Africa Infused Drugs Market Volume Share (%), by Country 2024 & 2032
- Figure 71: South America Infused Drugs Market Revenue (Million), by Drug Type 2024 & 2032
- Figure 72: South America Infused Drugs Market Volume (K Unit), by Drug Type 2024 & 2032
- Figure 73: South America Infused Drugs Market Revenue Share (%), by Drug Type 2024 & 2032
- Figure 74: South America Infused Drugs Market Volume Share (%), by Drug Type 2024 & 2032
- Figure 75: South America Infused Drugs Market Revenue (Million), by Therapeutic Area 2024 & 2032
- Figure 76: South America Infused Drugs Market Volume (K Unit), by Therapeutic Area 2024 & 2032
- Figure 77: South America Infused Drugs Market Revenue Share (%), by Therapeutic Area 2024 & 2032
- Figure 78: South America Infused Drugs Market Volume Share (%), by Therapeutic Area 2024 & 2032
- Figure 79: South America Infused Drugs Market Revenue (Million), by Country 2024 & 2032
- Figure 80: South America Infused Drugs Market Volume (K Unit), by Country 2024 & 2032
- Figure 81: South America Infused Drugs Market Revenue Share (%), by Country 2024 & 2032
- Figure 82: South America Infused Drugs Market Volume Share (%), by Country 2024 & 2032
List of Tables
- Table 1: Global Infused Drugs Market Revenue Million Forecast, by Region 2019 & 2032
- Table 2: Global Infused Drugs Market Volume K Unit Forecast, by Region 2019 & 2032
- Table 3: Global Infused Drugs Market Revenue Million Forecast, by Drug Type 2019 & 2032
- Table 4: Global Infused Drugs Market Volume K Unit Forecast, by Drug Type 2019 & 2032
- Table 5: Global Infused Drugs Market Revenue Million Forecast, by Therapeutic Area 2019 & 2032
- Table 6: Global Infused Drugs Market Volume K Unit Forecast, by Therapeutic Area 2019 & 2032
- Table 7: Global Infused Drugs Market Revenue Million Forecast, by Region 2019 & 2032
- Table 8: Global Infused Drugs Market Volume K Unit Forecast, by Region 2019 & 2032
- Table 9: Global Infused Drugs Market Revenue Million Forecast, by Country 2019 & 2032
- Table 10: Global Infused Drugs Market Volume K Unit Forecast, by Country 2019 & 2032
- Table 11: Global Infused Drugs Market Revenue Million Forecast, by Country 2019 & 2032
- Table 12: Global Infused Drugs Market Volume K Unit Forecast, by Country 2019 & 2032
- Table 13: Global Infused Drugs Market Revenue Million Forecast, by Country 2019 & 2032
- Table 14: Global Infused Drugs Market Volume K Unit Forecast, by Country 2019 & 2032
- Table 15: Global Infused Drugs Market Revenue Million Forecast, by Country 2019 & 2032
- Table 16: Global Infused Drugs Market Volume K Unit Forecast, by Country 2019 & 2032
- Table 17: Global Infused Drugs Market Revenue Million Forecast, by Country 2019 & 2032
- Table 18: Global Infused Drugs Market Volume K Unit Forecast, by Country 2019 & 2032
- Table 19: Global Infused Drugs Market Revenue Million Forecast, by Drug Type 2019 & 2032
- Table 20: Global Infused Drugs Market Volume K Unit Forecast, by Drug Type 2019 & 2032
- Table 21: Global Infused Drugs Market Revenue Million Forecast, by Therapeutic Area 2019 & 2032
- Table 22: Global Infused Drugs Market Volume K Unit Forecast, by Therapeutic Area 2019 & 2032
- Table 23: Global Infused Drugs Market Revenue Million Forecast, by Country 2019 & 2032
- Table 24: Global Infused Drugs Market Volume K Unit Forecast, by Country 2019 & 2032
- Table 25: United States Infused Drugs Market Revenue (Million) Forecast, by Application 2019 & 2032
- Table 26: United States Infused Drugs Market Volume (K Unit) Forecast, by Application 2019 & 2032
- Table 27: Canada Infused Drugs Market Revenue (Million) Forecast, by Application 2019 & 2032
- Table 28: Canada Infused Drugs Market Volume (K Unit) Forecast, by Application 2019 & 2032
- Table 29: Mexico Infused Drugs Market Revenue (Million) Forecast, by Application 2019 & 2032
- Table 30: Mexico Infused Drugs Market Volume (K Unit) Forecast, by Application 2019 & 2032
- Table 31: Global Infused Drugs Market Revenue Million Forecast, by Drug Type 2019 & 2032
- Table 32: Global Infused Drugs Market Volume K Unit Forecast, by Drug Type 2019 & 2032
- Table 33: Global Infused Drugs Market Revenue Million Forecast, by Therapeutic Area 2019 & 2032
- Table 34: Global Infused Drugs Market Volume K Unit Forecast, by Therapeutic Area 2019 & 2032
- Table 35: Global Infused Drugs Market Revenue Million Forecast, by Country 2019 & 2032
- Table 36: Global Infused Drugs Market Volume K Unit Forecast, by Country 2019 & 2032
- Table 37: Germany Infused Drugs Market Revenue (Million) Forecast, by Application 2019 & 2032
- Table 38: Germany Infused Drugs Market Volume (K Unit) Forecast, by Application 2019 & 2032
- Table 39: United Kingdom Infused Drugs Market Revenue (Million) Forecast, by Application 2019 & 2032
- Table 40: United Kingdom Infused Drugs Market Volume (K Unit) Forecast, by Application 2019 & 2032
- Table 41: France Infused Drugs Market Revenue (Million) Forecast, by Application 2019 & 2032
- Table 42: France Infused Drugs Market Volume (K Unit) Forecast, by Application 2019 & 2032
- Table 43: Italy Infused Drugs Market Revenue (Million) Forecast, by Application 2019 & 2032
- Table 44: Italy Infused Drugs Market Volume (K Unit) Forecast, by Application 2019 & 2032
- Table 45: Spain Infused Drugs Market Revenue (Million) Forecast, by Application 2019 & 2032
- Table 46: Spain Infused Drugs Market Volume (K Unit) Forecast, by Application 2019 & 2032
- Table 47: Rest of Europe Infused Drugs Market Revenue (Million) Forecast, by Application 2019 & 2032
- Table 48: Rest of Europe Infused Drugs Market Volume (K Unit) Forecast, by Application 2019 & 2032
- Table 49: Global Infused Drugs Market Revenue Million Forecast, by Drug Type 2019 & 2032
- Table 50: Global Infused Drugs Market Volume K Unit Forecast, by Drug Type 2019 & 2032
- Table 51: Global Infused Drugs Market Revenue Million Forecast, by Therapeutic Area 2019 & 2032
- Table 52: Global Infused Drugs Market Volume K Unit Forecast, by Therapeutic Area 2019 & 2032
- Table 53: Global Infused Drugs Market Revenue Million Forecast, by Country 2019 & 2032
- Table 54: Global Infused Drugs Market Volume K Unit Forecast, by Country 2019 & 2032
- Table 55: China Infused Drugs Market Revenue (Million) Forecast, by Application 2019 & 2032
- Table 56: China Infused Drugs Market Volume (K Unit) Forecast, by Application 2019 & 2032
- Table 57: Japan Infused Drugs Market Revenue (Million) Forecast, by Application 2019 & 2032
- Table 58: Japan Infused Drugs Market Volume (K Unit) Forecast, by Application 2019 & 2032
- Table 59: India Infused Drugs Market Revenue (Million) Forecast, by Application 2019 & 2032
- Table 60: India Infused Drugs Market Volume (K Unit) Forecast, by Application 2019 & 2032
- Table 61: Australia Infused Drugs Market Revenue (Million) Forecast, by Application 2019 & 2032
- Table 62: Australia Infused Drugs Market Volume (K Unit) Forecast, by Application 2019 & 2032
- Table 63: South Korea Infused Drugs Market Revenue (Million) Forecast, by Application 2019 & 2032
- Table 64: South Korea Infused Drugs Market Volume (K Unit) Forecast, by Application 2019 & 2032
- Table 65: Rest of Asia Pacific Infused Drugs Market Revenue (Million) Forecast, by Application 2019 & 2032
- Table 66: Rest of Asia Pacific Infused Drugs Market Volume (K Unit) Forecast, by Application 2019 & 2032
- Table 67: Global Infused Drugs Market Revenue Million Forecast, by Drug Type 2019 & 2032
- Table 68: Global Infused Drugs Market Volume K Unit Forecast, by Drug Type 2019 & 2032
- Table 69: Global Infused Drugs Market Revenue Million Forecast, by Therapeutic Area 2019 & 2032
- Table 70: Global Infused Drugs Market Volume K Unit Forecast, by Therapeutic Area 2019 & 2032
- Table 71: Global Infused Drugs Market Revenue Million Forecast, by Country 2019 & 2032
- Table 72: Global Infused Drugs Market Volume K Unit Forecast, by Country 2019 & 2032
- Table 73: GCC Infused Drugs Market Revenue (Million) Forecast, by Application 2019 & 2032
- Table 74: GCC Infused Drugs Market Volume (K Unit) Forecast, by Application 2019 & 2032
- Table 75: South Africa Infused Drugs Market Revenue (Million) Forecast, by Application 2019 & 2032
- Table 76: South Africa Infused Drugs Market Volume (K Unit) Forecast, by Application 2019 & 2032
- Table 77: Rest of Middle East and Africa Infused Drugs Market Revenue (Million) Forecast, by Application 2019 & 2032
- Table 78: Rest of Middle East and Africa Infused Drugs Market Volume (K Unit) Forecast, by Application 2019 & 2032
- Table 79: Global Infused Drugs Market Revenue Million Forecast, by Drug Type 2019 & 2032
- Table 80: Global Infused Drugs Market Volume K Unit Forecast, by Drug Type 2019 & 2032
- Table 81: Global Infused Drugs Market Revenue Million Forecast, by Therapeutic Area 2019 & 2032
- Table 82: Global Infused Drugs Market Volume K Unit Forecast, by Therapeutic Area 2019 & 2032
- Table 83: Global Infused Drugs Market Revenue Million Forecast, by Country 2019 & 2032
- Table 84: Global Infused Drugs Market Volume K Unit Forecast, by Country 2019 & 2032
- Table 85: Brazil Infused Drugs Market Revenue (Million) Forecast, by Application 2019 & 2032
- Table 86: Brazil Infused Drugs Market Volume (K Unit) Forecast, by Application 2019 & 2032
- Table 87: Argentina Infused Drugs Market Revenue (Million) Forecast, by Application 2019 & 2032
- Table 88: Argentina Infused Drugs Market Volume (K Unit) Forecast, by Application 2019 & 2032
- Table 89: Rest of South America Infused Drugs Market Revenue (Million) Forecast, by Application 2019 & 2032
- Table 90: Rest of South America Infused Drugs Market Volume (K Unit) Forecast, by Application 2019 & 2032
Frequently Asked Questions
1. What is the projected Compound Annual Growth Rate (CAGR) of the Infused Drugs Market?
The projected CAGR is approximately 7.30%.
2. Which companies are prominent players in the Infused Drugs Market?
Key companies in the market include Sanofi SA, Regeneron Pharmaceuticals Inc, Amgen Inc, AstraZeneca, Weefsel Pharma, Parenteral Drugs (India) Limited, Teva Pharmaceutical Industries Ltd, Eisai Co Ltd, Bristol-Myers Squibb Company, Pfizer Inc.
3. What are the main segments of the Infused Drugs Market?
The market segments include Drug Type, Therapeutic Area.
4. Can you provide details about the market size?
The market size is estimated to be USD 8.5 Million as of 2022.
5. What are some drivers contributing to market growth?
Increase in the Prevalence of Chronic Diseases; Increasing Geriatric Population.
6. What are the notable trends driving market growth?
Oncology is Expected to Have Significant Market Share During the Forecast Period.
7. Are there any restraints impacting market growth?
Side Effects Associated with the Medications.
8. Can you provide examples of recent developments in the market?
September 2023: Eisai Co. Ltd and Biogen Inc. reported the approval of LEQEMBI intravenous infusion, a humanized anti-soluble aggregated amyloid beta monoclonal antibody in Japan. This approval signifies its recognition as a treatment to decelerate the progression of mild cognitive impairment and dementia resulting from Alzheimer’s Disease.
9. What pricing options are available for accessing the report?
Pricing options include single-user, multi-user, and enterprise licenses priced at USD 4750, USD 5250, and USD 8750 respectively.
10. Is the market size provided in terms of value or volume?
The market size is provided in terms of value, measured in Million and volume, measured in K Unit.
11. Are there any specific market keywords associated with the report?
Yes, the market keyword associated with the report is "Infused Drugs Market," which aids in identifying and referencing the specific market segment covered.
12. How do I determine which pricing option suits my needs best?
The pricing options vary based on user requirements and access needs. Individual users may opt for single-user licenses, while businesses requiring broader access may choose multi-user or enterprise licenses for cost-effective access to the report.
13. Are there any additional resources or data provided in the Infused Drugs Market report?
While the report offers comprehensive insights, it's advisable to review the specific contents or supplementary materials provided to ascertain if additional resources or data are available.
14. How can I stay updated on further developments or reports in the Infused Drugs Market?
To stay informed about further developments, trends, and reports in the Infused Drugs Market, consider subscribing to industry newsletters, following relevant companies and organizations, or regularly checking reputable industry news sources and publications.
Methodology
Step 1 - Identification of Relevant Samples Size from Population Database


Step 2 - Approaches for Defining Global Market Size (Value, Volume* & Price*)

Note*: In applicable scenarios
Step 3 - Data Sources
Primary Research
- Web Analytics
- Survey Reports
- Research Institute
- Latest Research Reports
- Opinion Leaders
Secondary Research
- Annual Reports
- White Paper
- Latest Press Release
- Industry Association
- Paid Database
- Investor Presentations

Step 4 - Data Triangulation
Involves using different sources of information in order to increase the validity of a study
These sources are likely to be stakeholders in a program - participants, other researchers, program staff, other community members, and so on.
Then we put all data in single framework & apply various statistical tools to find out the dynamic on the market.
During the analysis stage, feedback from the stakeholder groups would be compared to determine areas of agreement as well as areas of divergence
