

Key Insights
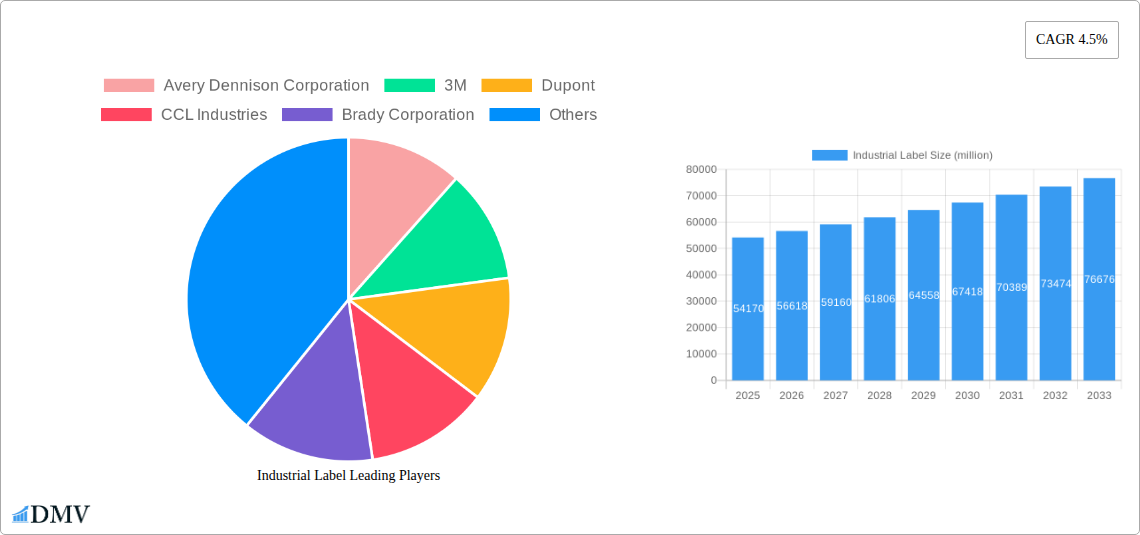
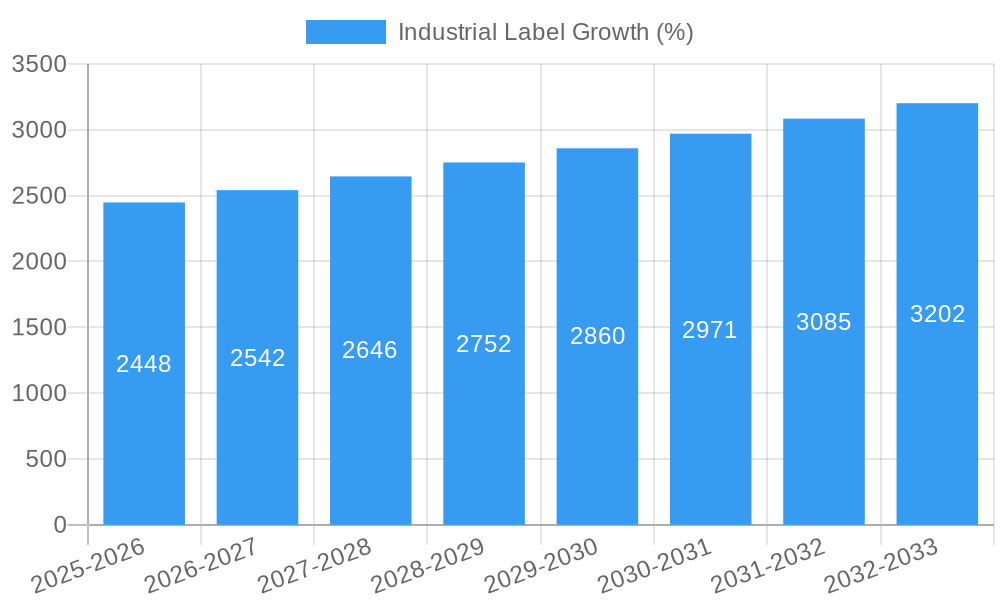
The industrial label market, valued at $54,170 million in 2025, is projected to experience robust growth, driven by the increasing automation in manufacturing, logistics, and supply chain management. The rising demand for efficient inventory management, product traceability, and regulatory compliance across various industries fuels the market expansion. Growth is further propelled by the adoption of advanced labeling technologies, such as RFID and smart labels, offering enhanced data capture and tracking capabilities. While the precise breakdown of segment contributions is unavailable, we can infer significant demand from sectors like automotive, food and beverage, pharmaceuticals, and electronics, given their emphasis on precise labeling for quality control and regulatory adherence. The 4.5% CAGR projected through 2033 signifies a steady and consistent market expansion, indicating a long-term positive outlook. Competition is intense, with major players like Avery Dennison, 3M, and CCL Industries vying for market share through innovation and strategic partnerships.
Despite the positive outlook, certain challenges may moderate growth. These may include fluctuating raw material prices, especially adhesive components, and potential economic downturns impacting industrial production. However, the ongoing trend toward improved supply chain visibility and the increasing integration of digital technologies into industrial processes are expected to mitigate these challenges and support continued market growth. The development of sustainable and eco-friendly labeling materials is also gaining traction, presenting both opportunities and challenges for manufacturers aiming to meet evolving environmental regulations and consumer demands. Furthermore, regional variations in growth rates are anticipated, with regions characterized by strong manufacturing activity likely exhibiting faster growth compared to others.
Industrial Label Market Report: A Comprehensive Analysis of a Multi-Million Dollar Industry (2019-2033)
This insightful report provides a comprehensive analysis of the global industrial label market, projecting a multi-million dollar valuation by 2033. We delve deep into market dynamics, competitive landscapes, technological advancements, and future growth opportunities, offering crucial insights for stakeholders across the value chain. The study period covers 2019-2033, with 2025 serving as both the base and estimated year. This report is indispensable for businesses seeking to navigate the complexities of this dynamic market and capitalize on emerging trends.
Industrial Label Market Composition & Trends
This section analyzes the market concentration, innovation drivers, regulatory landscape, substitute products, end-user profiles, and M&A activities within the industrial label market. We estimate a market size of xx million in 2025, with a projected compound annual growth rate (CAGR) of xx% during the forecast period (2025-2033).
Market Share Distribution: Avery Dennison Corporation, 3M, and CCL Industries hold a significant market share, collectively accounting for approximately xx% of the total market value in 2025. Other key players like Brady Corporation and Henkel contribute substantially, but precise figures are not readily available.
Innovation Catalysts: Advancements in materials science, printing technologies (e.g., digital printing), and smart label functionalities are driving innovation.
Regulatory Landscape: Stringent environmental regulations regarding adhesive composition and label disposal are shaping market dynamics, encouraging the adoption of eco-friendly materials.
Substitute Products: While traditional paper and vinyl labels dominate, emerging alternatives like RFID tags and electronic labels are gradually gaining traction.
End-User Profiles: Key end-users include manufacturing, logistics, healthcare, and food & beverage industries, each with unique labeling requirements.
M&A Activities: The industrial label sector has witnessed significant M&A activity in recent years, with deal values exceeding xx million in the past five years. These acquisitions often aim to expand product portfolios and geographical reach.
Industrial Label Industry Evolution
This section provides a detailed overview of the industrial label market's evolution, including growth trajectories, technological advancements, and shifts in consumer demands. The historical period (2019-2024) showed a CAGR of xx%, driven by increased industrial production and growing demand for product traceability. Technological advancements, particularly in digital printing and specialized adhesive formulations, have improved label durability and printing precision. Shifting consumer preferences toward sustainable packaging are also influencing the market, boosting demand for eco-friendly label materials. We project a CAGR of xx% from 2025 to 2033, propelled by the factors highlighted below.
Leading Regions, Countries, or Segments in Industrial Label
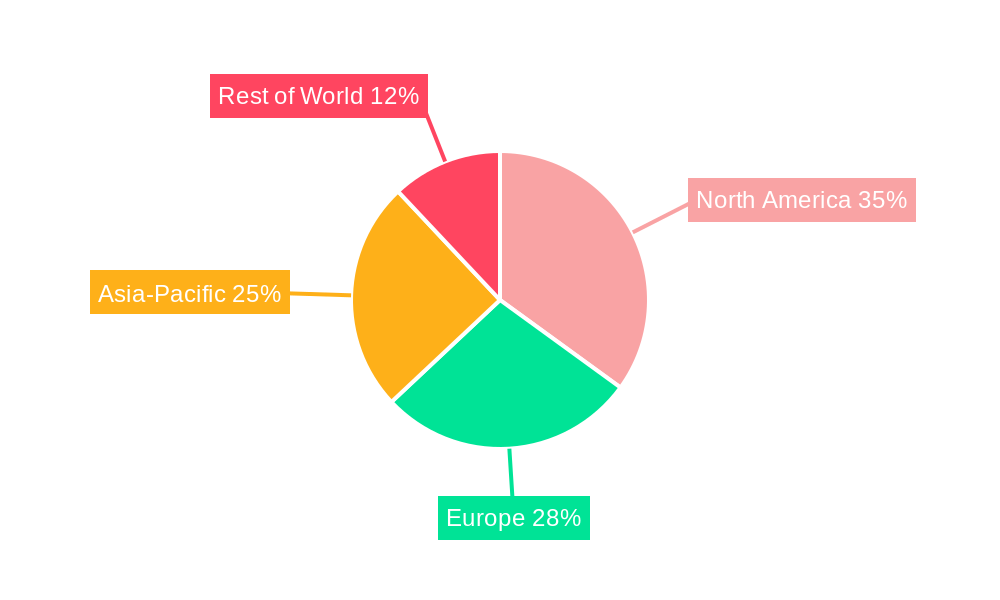
North America currently dominates the industrial label market, accounting for approximately xx% of the global market value in 2025. This dominance is attributed to several factors:
High Industrial Output: The robust manufacturing sector in North America fuels significant demand for industrial labels.
Technological Advancements: North America is at the forefront of technological innovation in label manufacturing and material science.
Favorable Regulatory Environment: Supportive regulations and investments in automation further strengthen the region's dominance.
Europe and Asia-Pacific are also significant markets, although with slightly slower growth rates than North America. The Asia-Pacific region presents significant growth potential due to rapid industrialization and expanding consumer markets.
Industrial Label Product Innovations
Recent innovations include the introduction of high-performance adhesives that offer enhanced durability and resistance to harsh environmental conditions. Smart labels incorporating RFID technology for improved product tracking and inventory management are gaining prominence. These advancements cater to evolving industry needs for enhanced traceability, security, and efficiency. Furthermore, the increasing demand for sustainable packaging has spurred the development of eco-friendly label materials made from recycled content or biodegradable materials, presenting a key unique selling proposition in the market.
Propelling Factors for Industrial Label Growth
Several factors are driving the growth of the industrial label market. These include:
Increased Industrial Production: The global expansion of manufacturing activities boosts demand for industrial labels.
Growing Demand for Product Traceability: Stringent regulations and consumer demand for transparent supply chains are promoting the adoption of labels that provide detailed product information.
Technological Advancements: Continuous innovation in label materials and printing technologies expands the applications and functionality of industrial labels.
Obstacles in the Industrial Label Market
Despite promising growth prospects, the industrial label market faces challenges, including:
Fluctuations in Raw Material Prices: Price volatility for materials such as adhesives and paper impacts production costs and profit margins.
Supply Chain Disruptions: Geopolitical instability and unforeseen events can significantly disrupt the supply chain, affecting label availability and prices.
Intense Competition: The market is highly competitive, with numerous established players and emerging competitors vying for market share. This pressure necessitates continuous innovation and cost optimization.
Future Opportunities in Industrial Label
Future opportunities lie in the adoption of advanced technologies such as RFID and smart labels for enhanced product tracking and supply chain management. Expansion into emerging markets, especially in developing economies with rapidly expanding industrial sectors, presents significant growth potential. The development of sustainable and eco-friendly label materials will also drive market growth.
Major Players in the Industrial Label Ecosystem
- Avery Dennison Corporation
- 3M
- Dupont
- CCL Industries
- Brady Corporation
- Cenveo Corporation
- Henkel
- H.B. Fuller
- Fuji Seal International
- Dunmore
- Cobra Systems
- InageTek Labels
- DYMO
- GSI Technologies
Key Developments in Industrial Label Industry
- 2022 Q3: Avery Dennison launched a new line of sustainable labels made from recycled materials.
- 2023 Q1: 3M acquired a smaller label manufacturer, expanding its product portfolio.
- 2024 Q2: CCL Industries invested in advanced digital printing technology to enhance production efficiency.
- 2024 Q4: New regulations regarding hazardous materials in labels were implemented in the EU. (Further details with specific years and months for other developments are unavailable and will require additional research).
Strategic Industrial Label Market Forecast
The industrial label market is poised for significant growth over the forecast period (2025-2033), driven by factors including increasing industrial production, the adoption of advanced labeling technologies, and a growing focus on sustainable packaging. The ongoing demand for enhanced product traceability and supply chain visibility will continue to fuel market expansion, presenting significant opportunities for industry players. Further innovation in materials and printing technologies, alongside strategic mergers and acquisitions, will shape the competitive landscape and drive future growth.
Industrial Label Segmentation
-
1. Application
- 1.1. Transportation & Logistics
- 1.2. Construction
- 1.3. Automotive
- 1.4. Consumer Durables
- 1.5. Others
-
2. Types
- 2.1. Warning/Security Labels
- 2.2. Branding Labels
- 2.3. Weatherproof Labels
- 2.4. Equipment Asset Tags
- 2.5. Others
Industrial Label Segmentation By Geography
-
1. North America
- 1.1. United States
- 1.2. Canada
- 1.3. Mexico
-
2. South America
- 2.1. Brazil
- 2.2. Argentina
- 2.3. Rest of South America
-
3. Europe
- 3.1. United Kingdom
- 3.2. Germany
- 3.3. France
- 3.4. Italy
- 3.5. Spain
- 3.6. Russia
- 3.7. Benelux
- 3.8. Nordics
- 3.9. Rest of Europe
-
4. Middle East & Africa
- 4.1. Turkey
- 4.2. Israel
- 4.3. GCC
- 4.4. North Africa
- 4.5. South Africa
- 4.6. Rest of Middle East & Africa
-
5. Asia Pacific
- 5.1. China
- 5.2. India
- 5.3. Japan
- 5.4. South Korea
- 5.5. ASEAN
- 5.6. Oceania
- 5.7. Rest of Asia Pacific
Industrial Label REPORT HIGHLIGHTS
| Aspects | Details |
|---|---|
| Study Period | 2019-2033 |
| Base Year | 2024 |
| Estimated Year | 2025 |
| Forecast Period | 2025-2033 |
| Historical Period | 2019-2024 |
| Growth Rate | CAGR of 4.5% from 2019-2033 |
| Segmentation |
|
Table of Contents
- 1. Introduction
- 1.1. Research Scope
- 1.2. Market Segmentation
- 1.3. Research Methodology
- 1.4. Definitions and Assumptions
- 2. Executive Summary
- 2.1. Introduction
- 3. Market Dynamics
- 3.1. Introduction
- 3.2. Market Drivers
- 3.3. Market Restrains
- 3.4. Market Trends
- 4. Market Factor Analysis
- 4.1. Porters Five Forces
- 4.2. Supply/Value Chain
- 4.3. PESTEL analysis
- 4.4. Market Entropy
- 4.5. Patent/Trademark Analysis
- 5. Global Industrial Label Analysis, Insights and Forecast, 2019-2031
- 5.1. Market Analysis, Insights and Forecast - by Application
- 5.1.1. Transportation & Logistics
- 5.1.2. Construction
- 5.1.3. Automotive
- 5.1.4. Consumer Durables
- 5.1.5. Others
- 5.2. Market Analysis, Insights and Forecast - by Types
- 5.2.1. Warning/Security Labels
- 5.2.2. Branding Labels
- 5.2.3. Weatherproof Labels
- 5.2.4. Equipment Asset Tags
- 5.2.5. Others
- 5.3. Market Analysis, Insights and Forecast - by Region
- 5.3.1. North America
- 5.3.2. South America
- 5.3.3. Europe
- 5.3.4. Middle East & Africa
- 5.3.5. Asia Pacific
- 5.1. Market Analysis, Insights and Forecast - by Application
- 6. North America Industrial Label Analysis, Insights and Forecast, 2019-2031
- 6.1. Market Analysis, Insights and Forecast - by Application
- 6.1.1. Transportation & Logistics
- 6.1.2. Construction
- 6.1.3. Automotive
- 6.1.4. Consumer Durables
- 6.1.5. Others
- 6.2. Market Analysis, Insights and Forecast - by Types
- 6.2.1. Warning/Security Labels
- 6.2.2. Branding Labels
- 6.2.3. Weatherproof Labels
- 6.2.4. Equipment Asset Tags
- 6.2.5. Others
- 6.1. Market Analysis, Insights and Forecast - by Application
- 7. South America Industrial Label Analysis, Insights and Forecast, 2019-2031
- 7.1. Market Analysis, Insights and Forecast - by Application
- 7.1.1. Transportation & Logistics
- 7.1.2. Construction
- 7.1.3. Automotive
- 7.1.4. Consumer Durables
- 7.1.5. Others
- 7.2. Market Analysis, Insights and Forecast - by Types
- 7.2.1. Warning/Security Labels
- 7.2.2. Branding Labels
- 7.2.3. Weatherproof Labels
- 7.2.4. Equipment Asset Tags
- 7.2.5. Others
- 7.1. Market Analysis, Insights and Forecast - by Application
- 8. Europe Industrial Label Analysis, Insights and Forecast, 2019-2031
- 8.1. Market Analysis, Insights and Forecast - by Application
- 8.1.1. Transportation & Logistics
- 8.1.2. Construction
- 8.1.3. Automotive
- 8.1.4. Consumer Durables
- 8.1.5. Others
- 8.2. Market Analysis, Insights and Forecast - by Types
- 8.2.1. Warning/Security Labels
- 8.2.2. Branding Labels
- 8.2.3. Weatherproof Labels
- 8.2.4. Equipment Asset Tags
- 8.2.5. Others
- 8.1. Market Analysis, Insights and Forecast - by Application
- 9. Middle East & Africa Industrial Label Analysis, Insights and Forecast, 2019-2031
- 9.1. Market Analysis, Insights and Forecast - by Application
- 9.1.1. Transportation & Logistics
- 9.1.2. Construction
- 9.1.3. Automotive
- 9.1.4. Consumer Durables
- 9.1.5. Others
- 9.2. Market Analysis, Insights and Forecast - by Types
- 9.2.1. Warning/Security Labels
- 9.2.2. Branding Labels
- 9.2.3. Weatherproof Labels
- 9.2.4. Equipment Asset Tags
- 9.2.5. Others
- 9.1. Market Analysis, Insights and Forecast - by Application
- 10. Asia Pacific Industrial Label Analysis, Insights and Forecast, 2019-2031
- 10.1. Market Analysis, Insights and Forecast - by Application
- 10.1.1. Transportation & Logistics
- 10.1.2. Construction
- 10.1.3. Automotive
- 10.1.4. Consumer Durables
- 10.1.5. Others
- 10.2. Market Analysis, Insights and Forecast - by Types
- 10.2.1. Warning/Security Labels
- 10.2.2. Branding Labels
- 10.2.3. Weatherproof Labels
- 10.2.4. Equipment Asset Tags
- 10.2.5. Others
- 10.1. Market Analysis, Insights and Forecast - by Application
- 11. Competitive Analysis
- 11.1. Global Market Share Analysis 2024
- 11.2. Company Profiles
- 11.2.1 Avery Dennison Corporation
- 11.2.1.1. Overview
- 11.2.1.2. Products
- 11.2.1.3. SWOT Analysis
- 11.2.1.4. Recent Developments
- 11.2.1.5. Financials (Based on Availability)
- 11.2.2 3M
- 11.2.2.1. Overview
- 11.2.2.2. Products
- 11.2.2.3. SWOT Analysis
- 11.2.2.4. Recent Developments
- 11.2.2.5. Financials (Based on Availability)
- 11.2.3 Dupont
- 11.2.3.1. Overview
- 11.2.3.2. Products
- 11.2.3.3. SWOT Analysis
- 11.2.3.4. Recent Developments
- 11.2.3.5. Financials (Based on Availability)
- 11.2.4 CCL Industries
- 11.2.4.1. Overview
- 11.2.4.2. Products
- 11.2.4.3. SWOT Analysis
- 11.2.4.4. Recent Developments
- 11.2.4.5. Financials (Based on Availability)
- 11.2.5 Brady Corporation
- 11.2.5.1. Overview
- 11.2.5.2. Products
- 11.2.5.3. SWOT Analysis
- 11.2.5.4. Recent Developments
- 11.2.5.5. Financials (Based on Availability)
- 11.2.6 Cenveo Corporation
- 11.2.6.1. Overview
- 11.2.6.2. Products
- 11.2.6.3. SWOT Analysis
- 11.2.6.4. Recent Developments
- 11.2.6.5. Financials (Based on Availability)
- 11.2.7 Henkel
- 11.2.7.1. Overview
- 11.2.7.2. Products
- 11.2.7.3. SWOT Analysis
- 11.2.7.4. Recent Developments
- 11.2.7.5. Financials (Based on Availability)
- 11.2.8 H.B. Fuller
- 11.2.8.1. Overview
- 11.2.8.2. Products
- 11.2.8.3. SWOT Analysis
- 11.2.8.4. Recent Developments
- 11.2.8.5. Financials (Based on Availability)
- 11.2.9 Fuji Seal International
- 11.2.9.1. Overview
- 11.2.9.2. Products
- 11.2.9.3. SWOT Analysis
- 11.2.9.4. Recent Developments
- 11.2.9.5. Financials (Based on Availability)
- 11.2.10 Dunmore
- 11.2.10.1. Overview
- 11.2.10.2. Products
- 11.2.10.3. SWOT Analysis
- 11.2.10.4. Recent Developments
- 11.2.10.5. Financials (Based on Availability)
- 11.2.11 Cobra Systems
- 11.2.11.1. Overview
- 11.2.11.2. Products
- 11.2.11.3. SWOT Analysis
- 11.2.11.4. Recent Developments
- 11.2.11.5. Financials (Based on Availability)
- 11.2.12 InageTek Labels
- 11.2.12.1. Overview
- 11.2.12.2. Products
- 11.2.12.3. SWOT Analysis
- 11.2.12.4. Recent Developments
- 11.2.12.5. Financials (Based on Availability)
- 11.2.13 DYMO
- 11.2.13.1. Overview
- 11.2.13.2. Products
- 11.2.13.3. SWOT Analysis
- 11.2.13.4. Recent Developments
- 11.2.13.5. Financials (Based on Availability)
- 11.2.14 GSI Technologies
- 11.2.14.1. Overview
- 11.2.14.2. Products
- 11.2.14.3. SWOT Analysis
- 11.2.14.4. Recent Developments
- 11.2.14.5. Financials (Based on Availability)
- 11.2.1 Avery Dennison Corporation
List of Figures
- Figure 1: Global Industrial Label Revenue Breakdown (million, %) by Region 2024 & 2032
- Figure 2: North America Industrial Label Revenue (million), by Application 2024 & 2032
- Figure 3: North America Industrial Label Revenue Share (%), by Application 2024 & 2032
- Figure 4: North America Industrial Label Revenue (million), by Types 2024 & 2032
- Figure 5: North America Industrial Label Revenue Share (%), by Types 2024 & 2032
- Figure 6: North America Industrial Label Revenue (million), by Country 2024 & 2032
- Figure 7: North America Industrial Label Revenue Share (%), by Country 2024 & 2032
- Figure 8: South America Industrial Label Revenue (million), by Application 2024 & 2032
- Figure 9: South America Industrial Label Revenue Share (%), by Application 2024 & 2032
- Figure 10: South America Industrial Label Revenue (million), by Types 2024 & 2032
- Figure 11: South America Industrial Label Revenue Share (%), by Types 2024 & 2032
- Figure 12: South America Industrial Label Revenue (million), by Country 2024 & 2032
- Figure 13: South America Industrial Label Revenue Share (%), by Country 2024 & 2032
- Figure 14: Europe Industrial Label Revenue (million), by Application 2024 & 2032
- Figure 15: Europe Industrial Label Revenue Share (%), by Application 2024 & 2032
- Figure 16: Europe Industrial Label Revenue (million), by Types 2024 & 2032
- Figure 17: Europe Industrial Label Revenue Share (%), by Types 2024 & 2032
- Figure 18: Europe Industrial Label Revenue (million), by Country 2024 & 2032
- Figure 19: Europe Industrial Label Revenue Share (%), by Country 2024 & 2032
- Figure 20: Middle East & Africa Industrial Label Revenue (million), by Application 2024 & 2032
- Figure 21: Middle East & Africa Industrial Label Revenue Share (%), by Application 2024 & 2032
- Figure 22: Middle East & Africa Industrial Label Revenue (million), by Types 2024 & 2032
- Figure 23: Middle East & Africa Industrial Label Revenue Share (%), by Types 2024 & 2032
- Figure 24: Middle East & Africa Industrial Label Revenue (million), by Country 2024 & 2032
- Figure 25: Middle East & Africa Industrial Label Revenue Share (%), by Country 2024 & 2032
- Figure 26: Asia Pacific Industrial Label Revenue (million), by Application 2024 & 2032
- Figure 27: Asia Pacific Industrial Label Revenue Share (%), by Application 2024 & 2032
- Figure 28: Asia Pacific Industrial Label Revenue (million), by Types 2024 & 2032
- Figure 29: Asia Pacific Industrial Label Revenue Share (%), by Types 2024 & 2032
- Figure 30: Asia Pacific Industrial Label Revenue (million), by Country 2024 & 2032
- Figure 31: Asia Pacific Industrial Label Revenue Share (%), by Country 2024 & 2032
List of Tables
- Table 1: Global Industrial Label Revenue million Forecast, by Region 2019 & 2032
- Table 2: Global Industrial Label Revenue million Forecast, by Application 2019 & 2032
- Table 3: Global Industrial Label Revenue million Forecast, by Types 2019 & 2032
- Table 4: Global Industrial Label Revenue million Forecast, by Region 2019 & 2032
- Table 5: Global Industrial Label Revenue million Forecast, by Application 2019 & 2032
- Table 6: Global Industrial Label Revenue million Forecast, by Types 2019 & 2032
- Table 7: Global Industrial Label Revenue million Forecast, by Country 2019 & 2032
- Table 8: United States Industrial Label Revenue (million) Forecast, by Application 2019 & 2032
- Table 9: Canada Industrial Label Revenue (million) Forecast, by Application 2019 & 2032
- Table 10: Mexico Industrial Label Revenue (million) Forecast, by Application 2019 & 2032
- Table 11: Global Industrial Label Revenue million Forecast, by Application 2019 & 2032
- Table 12: Global Industrial Label Revenue million Forecast, by Types 2019 & 2032
- Table 13: Global Industrial Label Revenue million Forecast, by Country 2019 & 2032
- Table 14: Brazil Industrial Label Revenue (million) Forecast, by Application 2019 & 2032
- Table 15: Argentina Industrial Label Revenue (million) Forecast, by Application 2019 & 2032
- Table 16: Rest of South America Industrial Label Revenue (million) Forecast, by Application 2019 & 2032
- Table 17: Global Industrial Label Revenue million Forecast, by Application 2019 & 2032
- Table 18: Global Industrial Label Revenue million Forecast, by Types 2019 & 2032
- Table 19: Global Industrial Label Revenue million Forecast, by Country 2019 & 2032
- Table 20: United Kingdom Industrial Label Revenue (million) Forecast, by Application 2019 & 2032
- Table 21: Germany Industrial Label Revenue (million) Forecast, by Application 2019 & 2032
- Table 22: France Industrial Label Revenue (million) Forecast, by Application 2019 & 2032
- Table 23: Italy Industrial Label Revenue (million) Forecast, by Application 2019 & 2032
- Table 24: Spain Industrial Label Revenue (million) Forecast, by Application 2019 & 2032
- Table 25: Russia Industrial Label Revenue (million) Forecast, by Application 2019 & 2032
- Table 26: Benelux Industrial Label Revenue (million) Forecast, by Application 2019 & 2032
- Table 27: Nordics Industrial Label Revenue (million) Forecast, by Application 2019 & 2032
- Table 28: Rest of Europe Industrial Label Revenue (million) Forecast, by Application 2019 & 2032
- Table 29: Global Industrial Label Revenue million Forecast, by Application 2019 & 2032
- Table 30: Global Industrial Label Revenue million Forecast, by Types 2019 & 2032
- Table 31: Global Industrial Label Revenue million Forecast, by Country 2019 & 2032
- Table 32: Turkey Industrial Label Revenue (million) Forecast, by Application 2019 & 2032
- Table 33: Israel Industrial Label Revenue (million) Forecast, by Application 2019 & 2032
- Table 34: GCC Industrial Label Revenue (million) Forecast, by Application 2019 & 2032
- Table 35: North Africa Industrial Label Revenue (million) Forecast, by Application 2019 & 2032
- Table 36: South Africa Industrial Label Revenue (million) Forecast, by Application 2019 & 2032
- Table 37: Rest of Middle East & Africa Industrial Label Revenue (million) Forecast, by Application 2019 & 2032
- Table 38: Global Industrial Label Revenue million Forecast, by Application 2019 & 2032
- Table 39: Global Industrial Label Revenue million Forecast, by Types 2019 & 2032
- Table 40: Global Industrial Label Revenue million Forecast, by Country 2019 & 2032
- Table 41: China Industrial Label Revenue (million) Forecast, by Application 2019 & 2032
- Table 42: India Industrial Label Revenue (million) Forecast, by Application 2019 & 2032
- Table 43: Japan Industrial Label Revenue (million) Forecast, by Application 2019 & 2032
- Table 44: South Korea Industrial Label Revenue (million) Forecast, by Application 2019 & 2032
- Table 45: ASEAN Industrial Label Revenue (million) Forecast, by Application 2019 & 2032
- Table 46: Oceania Industrial Label Revenue (million) Forecast, by Application 2019 & 2032
- Table 47: Rest of Asia Pacific Industrial Label Revenue (million) Forecast, by Application 2019 & 2032
Frequently Asked Questions
1. What is the projected Compound Annual Growth Rate (CAGR) of the Industrial Label?
The projected CAGR is approximately 4.5%.
2. Which companies are prominent players in the Industrial Label?
Key companies in the market include Avery Dennison Corporation, 3M, Dupont, CCL Industries, Brady Corporation, Cenveo Corporation, Henkel, H.B. Fuller, Fuji Seal International, Dunmore, Cobra Systems, InageTek Labels, DYMO, GSI Technologies.
3. What are the main segments of the Industrial Label?
The market segments include Application, Types.
4. Can you provide details about the market size?
The market size is estimated to be USD 54170 million as of 2022.
5. What are some drivers contributing to market growth?
N/A
6. What are the notable trends driving market growth?
N/A
7. Are there any restraints impacting market growth?
N/A
8. Can you provide examples of recent developments in the market?
N/A
9. What pricing options are available for accessing the report?
Pricing options include single-user, multi-user, and enterprise licenses priced at USD 4900.00, USD 7350.00, and USD 9800.00 respectively.
10. Is the market size provided in terms of value or volume?
The market size is provided in terms of value, measured in million.
11. Are there any specific market keywords associated with the report?
Yes, the market keyword associated with the report is "Industrial Label," which aids in identifying and referencing the specific market segment covered.
12. How do I determine which pricing option suits my needs best?
The pricing options vary based on user requirements and access needs. Individual users may opt for single-user licenses, while businesses requiring broader access may choose multi-user or enterprise licenses for cost-effective access to the report.
13. Are there any additional resources or data provided in the Industrial Label report?
While the report offers comprehensive insights, it's advisable to review the specific contents or supplementary materials provided to ascertain if additional resources or data are available.
14. How can I stay updated on further developments or reports in the Industrial Label?
To stay informed about further developments, trends, and reports in the Industrial Label, consider subscribing to industry newsletters, following relevant companies and organizations, or regularly checking reputable industry news sources and publications.
Methodology
Step 1 - Identification of Relevant Samples Size from Population Database


Step 2 - Approaches for Defining Global Market Size (Value, Volume* & Price*)

Note*: In applicable scenarios
Step 3 - Data Sources
Primary Research
- Web Analytics
- Survey Reports
- Research Institute
- Latest Research Reports
- Opinion Leaders
Secondary Research
- Annual Reports
- White Paper
- Latest Press Release
- Industry Association
- Paid Database
- Investor Presentations

Step 4 - Data Triangulation
Involves using different sources of information in order to increase the validity of a study
These sources are likely to be stakeholders in a program - participants, other researchers, program staff, other community members, and so on.
Then we put all data in single framework & apply various statistical tools to find out the dynamic on the market.
During the analysis stage, feedback from the stakeholder groups would be compared to determine areas of agreement as well as areas of divergence
