

Key Insights
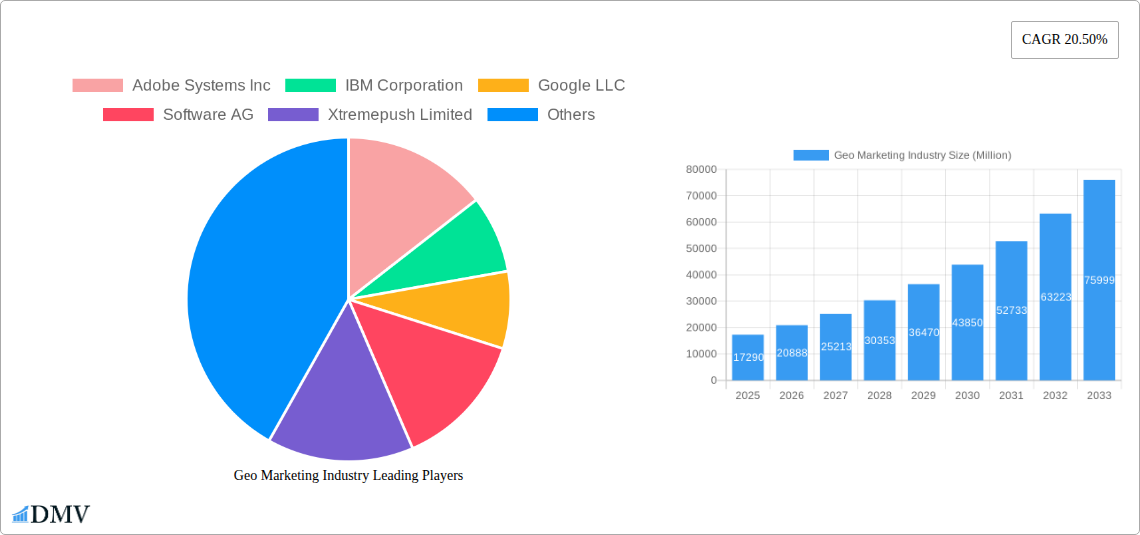
The geospatial marketing industry is experiencing robust growth, projected to reach a market size of $17.29 billion in 2025 and maintain a Compound Annual Growth Rate (CAGR) of 20.50% from 2025 to 2033. This expansion is driven by several key factors. Firstly, the increasing adoption of location-based services and mobile devices provides marketers with unprecedented opportunities to target consumers with highly personalized and relevant advertising. Secondly, advancements in data analytics and AI enable more precise audience segmentation and campaign optimization, maximizing ROI. Furthermore, the growing need for businesses to understand and engage with their customers on a hyperlocal level fuels demand for sophisticated geospatial marketing solutions. The cloud-based deployment model is gaining significant traction, facilitating scalability, accessibility, and cost-effectiveness. Key segments demonstrating strong growth include software solutions offering advanced analytics and visualization capabilities, and services supporting campaign planning and execution. Industries like BFSI (Banking, Financial Services, and Insurance), Retail and E-commerce, and Media & Entertainment are significant adopters, leveraging geospatial marketing for targeted advertising, personalized offers, and optimized store placement.
While the industry faces challenges such as data privacy concerns and the complexities of integrating diverse data sources, these obstacles are being addressed through technological innovation and the development of robust data governance frameworks. The competitive landscape is characterized by a mix of established technology giants (e.g., Adobe, IBM, Google) and specialized geospatial marketing firms, fostering innovation and diverse solution offerings. Future growth will be influenced by factors like 5G deployment, the expansion of IoT (Internet of Things) devices, and the increasing availability of high-quality location data. The Asia-Pacific region is anticipated to experience particularly strong growth due to rapid technological advancements and increasing smartphone penetration in developing economies. A continued focus on data security and ethical considerations will be crucial for sustaining the industry's positive trajectory and building consumer trust.
Geo Marketing Industry: A Comprehensive Market Report (2019-2033)
This insightful report provides a comprehensive analysis of the Geo Marketing Industry, projecting a market value exceeding $XX Million by 2033. The study encompasses detailed market segmentation, competitive landscape analysis, technological advancements, and future growth projections, offering invaluable insights for stakeholders across the value chain. The report covers the period from 2019 to 2033, with 2025 serving as the base and estimated year.
Geo Marketing Industry Market Composition & Trends
The Geo Marketing Industry, valued at $XX Million in 2025, exhibits a moderately concentrated market structure. Key players like Adobe Systems Inc, IBM Corporation, Google LLC, and Microsoft Corporation hold significant market share, but a number of smaller, specialized firms contribute to the overall dynamism. Innovation is driven by advancements in location-based services, AI-powered analytics, and the increasing sophistication of data integration tools. Regulatory landscapes, particularly concerning data privacy and usage, are increasingly complex and vary significantly across regions. Substitute products, such as traditional marketing methods, are losing ground to the superior targeting and measurement capabilities of geo-marketing.
- Market Share Distribution (2025): Top 5 players account for approximately XX% of the market.
- M&A Activity (2019-2024): Total deal value estimated at $XX Million, reflecting consolidation and expansion efforts by major players.
- End-User Profiles: The industry caters to a diverse range of end-users, including BFSI, IT and Telecommunications, Retail and E-commerce, Media and Entertainment, Travel and Hospitality, and other sectors.
Geo Marketing Industry Industry Evolution
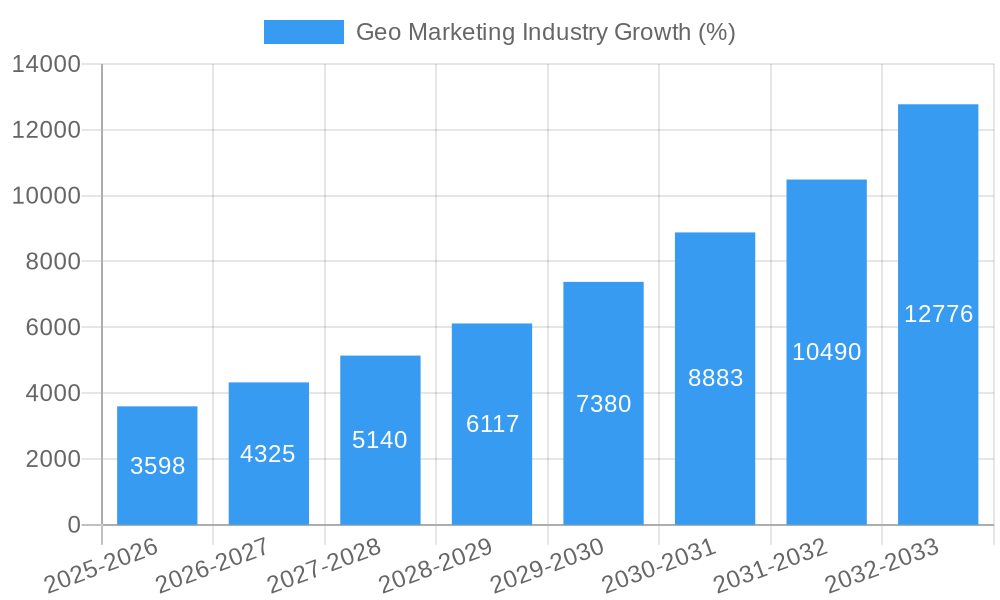
The Geo Marketing Industry has witnessed robust growth throughout the historical period (2019-2024), driven by the proliferation of smartphones, increased data availability, and the adoption of advanced analytics techniques. The market is projected to maintain a Compound Annual Growth Rate (CAGR) of XX% during the forecast period (2025-2033), reaching $XX Million by 2033. This growth is fuelled by several factors, including: the rising adoption of cloud-based geo-marketing solutions, the increasing demand for precise location-based targeting, the growing integration of geo-marketing with other marketing technologies (like CRM and marketing automation), and an expanding range of applications across various industries. The shift in consumer behavior towards personalized experiences and greater emphasis on data-driven decision-making are also significant contributors. Technological advancements, particularly in areas such as AI, machine learning, and big data analytics, are constantly enhancing the precision, efficiency, and effectiveness of geo-marketing campaigns. This continuous evolution ensures that geo-marketing remains a critical tool for organizations aiming to optimize their marketing ROI.
Leading Regions, Countries, or Segments in Geo Marketing Industry
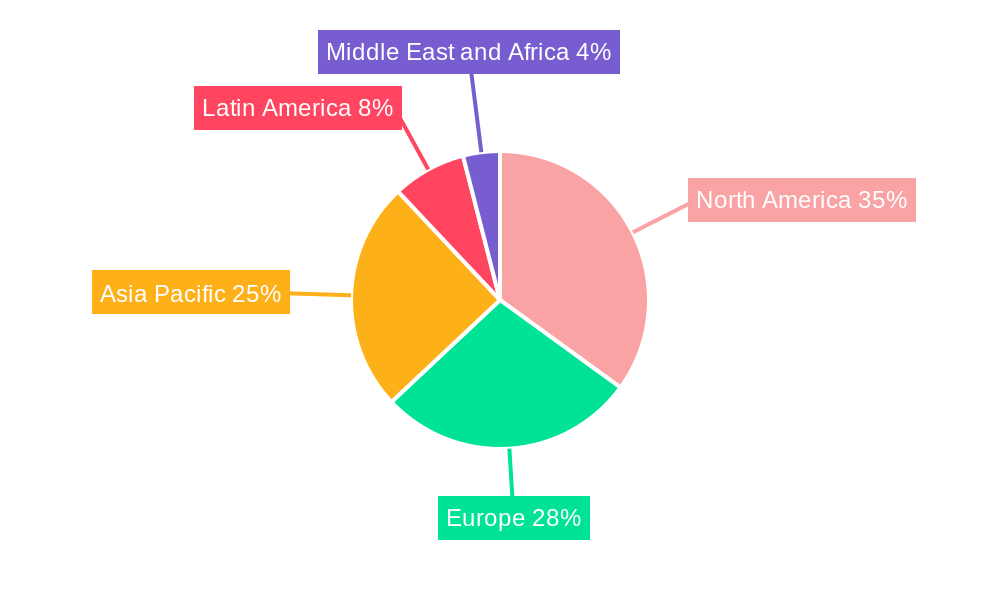
The North American market currently holds the largest share of the Geo Marketing Industry, driven by high technological adoption rates, robust IT infrastructure, and a sizable presence of key players. However, Asia-Pacific is predicted to experience the fastest growth in the coming years, fueled by rapidly expanding economies, increasing smartphone penetration, and burgeoning digital marketing adoption.
- By Components: The Software segment dominates, owing to the continuous innovation in analytical tools and platform capabilities.
- By Deployment: Cloud-based solutions are experiencing the fastest growth, driven by scalability, cost-effectiveness, and accessibility.
- By Location: Outdoor geo-marketing enjoys higher market share due to broader reach and applicability across varied industries.
- By End-User Industry: Retail and E-commerce remains the largest end-user segment, with BFSI and IT and Telecommunications witnessing significant growth.
Key drivers for regional dominance include significant investments in digital infrastructure, supportive regulatory environments, and a high concentration of key players. The robust growth in specific segments reflects the increasing demand for advanced analytical capabilities and the growing adoption of cloud-based technologies.
Geo Marketing Industry Product Innovations
Recent innovations focus on enhancing the accuracy and efficiency of location-based targeting, incorporating AI-powered predictive analytics for improved campaign optimization, and providing more granular insights into consumer behavior. The emphasis is on developing user-friendly interfaces and integrating geo-marketing solutions with existing marketing technology stacks. Unique selling propositions increasingly revolve around superior data quality, advanced analytical capabilities, and seamless integration with other marketing tools.
Propelling Factors for Geo Marketing Industry Growth
Technological advancements, particularly in areas such as AI, machine learning, and big data analytics, are continuously enhancing the precision, efficiency, and effectiveness of geo-marketing campaigns. The growing adoption of cloud-based solutions contributes to increased scalability and accessibility. The increasing reliance on data-driven decision-making across various industries is another crucial driver. Favorable regulatory environments in several key markets also provide a positive impetus for market growth.
Obstacles in the Geo Marketing Industry Market
Data privacy concerns and stringent regulations regarding data usage represent significant challenges. The industry faces supply chain disruptions, particularly regarding access to high-quality location data. Intense competition among existing and emerging players can also constrain profit margins. These obstacles cumulatively impact market growth rates and necessitate strategic adaptation by businesses operating in this space.
Future Opportunities in Geo Marketing Industry
Expanding into emerging markets with high growth potential, such as Africa and Latin America, presents significant opportunities. The integration of emerging technologies, like augmented reality (AR) and virtual reality (VR), promises to enhance user engagement and campaign effectiveness. Exploring new applications of geo-marketing in sectors like healthcare and logistics could unlock substantial growth opportunities.
Major Players in the Geo Marketing Industry Ecosystem
- Adobe Systems Inc
- IBM Corporation
- Google LLC
- Software AG
- Xtremepush Limited
- Cisco Systems Inc
- Microsoft Corporation
- Ericsson Inc
- Oracle Corporation
- ESRI Business Information Solutions Inc
- Qualcomm Inc
Key Developments in Geo Marketing Industry Industry
- Jan 2023: MapZot.AI's launch of mobile location data significantly enhances foot traffic analysis capabilities for businesses, assisting with site selection and portfolio optimization.
- Apr 2022: Precisely's enhanced geo-addressing capabilities improve data verification and geocoding processes across various business systems, impacting data quality and efficiency.
Strategic Geo Marketing Industry Market Forecast
The Geo Marketing Industry is poised for sustained growth, driven by ongoing technological innovation, increasing adoption of cloud-based solutions, and the expanding need for data-driven marketing strategies across diverse industries. Future opportunities lie in tapping into emerging markets and leveraging cutting-edge technologies to enhance campaign effectiveness and deliver personalized customer experiences. The market’s trajectory suggests significant growth potential throughout the forecast period.
Geo Marketing Industry Segmentation
-
1. Components
- 1.1. Software
- 1.2. Services
-
2. Deployment
- 2.1. Cloud
- 2.2. On-Premise
-
3. Location
- 3.1. Indoor
- 3.2. Outdoor
-
4. End-User Industry
- 4.1. BFSI
- 4.2. IT and Telecommunications
- 4.3. Retail and E-commerce
- 4.4. Media and Entertainment
- 4.5. Travel and Hospitality
- 4.6. Other End-user Industries
Geo Marketing Industry Segmentation By Geography
- 1. North America
- 2. Europe
- 3. Asia Pacific
- 4. Latin America
- 5. Middle East and Africa
Geo Marketing Industry REPORT HIGHLIGHTS
| Aspects | Details |
|---|---|
| Study Period | 2019-2033 |
| Base Year | 2024 |
| Estimated Year | 2025 |
| Forecast Period | 2025-2033 |
| Historical Period | 2019-2024 |
| Growth Rate | CAGR of 20.50% from 2019-2033 |
| Segmentation |
|
Table of Contents
- 1. Introduction
- 1.1. Research Scope
- 1.2. Market Segmentation
- 1.3. Research Methodology
- 1.4. Definitions and Assumptions
- 2. Executive Summary
- 2.1. Introduction
- 3. Market Dynamics
- 3.1. Introduction
- 3.2. Market Drivers
- 3.2.1. Increasing Adoption of Emerging Technologies in Marketing Sector; Increasing Demand for Location-Based Intelligence to Enhance the Business Revenue
- 3.3. Market Restrains
- 3.3.1. Increasing Security and Privacy Concerns Among Enterprises
- 3.4. Market Trends
- 3.4.1. Services Components Segment is Expected to Hold Significant Market Share
- 4. Market Factor Analysis
- 4.1. Porters Five Forces
- 4.2. Supply/Value Chain
- 4.3. PESTEL analysis
- 4.4. Market Entropy
- 4.5. Patent/Trademark Analysis
- 5. Global Geo Marketing Industry Analysis, Insights and Forecast, 2019-2031
- 5.1. Market Analysis, Insights and Forecast - by Components
- 5.1.1. Software
- 5.1.2. Services
- 5.2. Market Analysis, Insights and Forecast - by Deployment
- 5.2.1. Cloud
- 5.2.2. On-Premise
- 5.3. Market Analysis, Insights and Forecast - by Location
- 5.3.1. Indoor
- 5.3.2. Outdoor
- 5.4. Market Analysis, Insights and Forecast - by End-User Industry
- 5.4.1. BFSI
- 5.4.2. IT and Telecommunications
- 5.4.3. Retail and E-commerce
- 5.4.4. Media and Entertainment
- 5.4.5. Travel and Hospitality
- 5.4.6. Other End-user Industries
- 5.5. Market Analysis, Insights and Forecast - by Region
- 5.5.1. North America
- 5.5.2. Europe
- 5.5.3. Asia Pacific
- 5.5.4. Latin America
- 5.5.5. Middle East and Africa
- 5.1. Market Analysis, Insights and Forecast - by Components
- 6. North America Geo Marketing Industry Analysis, Insights and Forecast, 2019-2031
- 6.1. Market Analysis, Insights and Forecast - by Components
- 6.1.1. Software
- 6.1.2. Services
- 6.2. Market Analysis, Insights and Forecast - by Deployment
- 6.2.1. Cloud
- 6.2.2. On-Premise
- 6.3. Market Analysis, Insights and Forecast - by Location
- 6.3.1. Indoor
- 6.3.2. Outdoor
- 6.4. Market Analysis, Insights and Forecast - by End-User Industry
- 6.4.1. BFSI
- 6.4.2. IT and Telecommunications
- 6.4.3. Retail and E-commerce
- 6.4.4. Media and Entertainment
- 6.4.5. Travel and Hospitality
- 6.4.6. Other End-user Industries
- 6.1. Market Analysis, Insights and Forecast - by Components
- 7. Europe Geo Marketing Industry Analysis, Insights and Forecast, 2019-2031
- 7.1. Market Analysis, Insights and Forecast - by Components
- 7.1.1. Software
- 7.1.2. Services
- 7.2. Market Analysis, Insights and Forecast - by Deployment
- 7.2.1. Cloud
- 7.2.2. On-Premise
- 7.3. Market Analysis, Insights and Forecast - by Location
- 7.3.1. Indoor
- 7.3.2. Outdoor
- 7.4. Market Analysis, Insights and Forecast - by End-User Industry
- 7.4.1. BFSI
- 7.4.2. IT and Telecommunications
- 7.4.3. Retail and E-commerce
- 7.4.4. Media and Entertainment
- 7.4.5. Travel and Hospitality
- 7.4.6. Other End-user Industries
- 7.1. Market Analysis, Insights and Forecast - by Components
- 8. Asia Pacific Geo Marketing Industry Analysis, Insights and Forecast, 2019-2031
- 8.1. Market Analysis, Insights and Forecast - by Components
- 8.1.1. Software
- 8.1.2. Services
- 8.2. Market Analysis, Insights and Forecast - by Deployment
- 8.2.1. Cloud
- 8.2.2. On-Premise
- 8.3. Market Analysis, Insights and Forecast - by Location
- 8.3.1. Indoor
- 8.3.2. Outdoor
- 8.4. Market Analysis, Insights and Forecast - by End-User Industry
- 8.4.1. BFSI
- 8.4.2. IT and Telecommunications
- 8.4.3. Retail and E-commerce
- 8.4.4. Media and Entertainment
- 8.4.5. Travel and Hospitality
- 8.4.6. Other End-user Industries
- 8.1. Market Analysis, Insights and Forecast - by Components
- 9. Latin America Geo Marketing Industry Analysis, Insights and Forecast, 2019-2031
- 9.1. Market Analysis, Insights and Forecast - by Components
- 9.1.1. Software
- 9.1.2. Services
- 9.2. Market Analysis, Insights and Forecast - by Deployment
- 9.2.1. Cloud
- 9.2.2. On-Premise
- 9.3. Market Analysis, Insights and Forecast - by Location
- 9.3.1. Indoor
- 9.3.2. Outdoor
- 9.4. Market Analysis, Insights and Forecast - by End-User Industry
- 9.4.1. BFSI
- 9.4.2. IT and Telecommunications
- 9.4.3. Retail and E-commerce
- 9.4.4. Media and Entertainment
- 9.4.5. Travel and Hospitality
- 9.4.6. Other End-user Industries
- 9.1. Market Analysis, Insights and Forecast - by Components
- 10. Middle East and Africa Geo Marketing Industry Analysis, Insights and Forecast, 2019-2031
- 10.1. Market Analysis, Insights and Forecast - by Components
- 10.1.1. Software
- 10.1.2. Services
- 10.2. Market Analysis, Insights and Forecast - by Deployment
- 10.2.1. Cloud
- 10.2.2. On-Premise
- 10.3. Market Analysis, Insights and Forecast - by Location
- 10.3.1. Indoor
- 10.3.2. Outdoor
- 10.4. Market Analysis, Insights and Forecast - by End-User Industry
- 10.4.1. BFSI
- 10.4.2. IT and Telecommunications
- 10.4.3. Retail and E-commerce
- 10.4.4. Media and Entertainment
- 10.4.5. Travel and Hospitality
- 10.4.6. Other End-user Industries
- 10.1. Market Analysis, Insights and Forecast - by Components
- 11. North America Geo Marketing Industry Analysis, Insights and Forecast, 2019-2031
- 11.1. Market Analysis, Insights and Forecast - By Country/Sub-region
- 11.1.1.
- 12. Europe Geo Marketing Industry Analysis, Insights and Forecast, 2019-2031
- 12.1. Market Analysis, Insights and Forecast - By Country/Sub-region
- 12.1.1.
- 13. Asia Pacific Geo Marketing Industry Analysis, Insights and Forecast, 2019-2031
- 13.1. Market Analysis, Insights and Forecast - By Country/Sub-region
- 13.1.1.
- 14. Latin America Geo Marketing Industry Analysis, Insights and Forecast, 2019-2031
- 14.1. Market Analysis, Insights and Forecast - By Country/Sub-region
- 14.1.1.
- 15. Middle East and Africa Geo Marketing Industry Analysis, Insights and Forecast, 2019-2031
- 15.1. Market Analysis, Insights and Forecast - By Country/Sub-region
- 15.1.1.
- 16. Competitive Analysis
- 16.1. Global Market Share Analysis 2024
- 16.2. Company Profiles
- 16.2.1 Adobe Systems Inc
- 16.2.1.1. Overview
- 16.2.1.2. Products
- 16.2.1.3. SWOT Analysis
- 16.2.1.4. Recent Developments
- 16.2.1.5. Financials (Based on Availability)
- 16.2.2 IBM Corporation
- 16.2.2.1. Overview
- 16.2.2.2. Products
- 16.2.2.3. SWOT Analysis
- 16.2.2.4. Recent Developments
- 16.2.2.5. Financials (Based on Availability)
- 16.2.3 Google LLC
- 16.2.3.1. Overview
- 16.2.3.2. Products
- 16.2.3.3. SWOT Analysis
- 16.2.3.4. Recent Developments
- 16.2.3.5. Financials (Based on Availability)
- 16.2.4 Software AG
- 16.2.4.1. Overview
- 16.2.4.2. Products
- 16.2.4.3. SWOT Analysis
- 16.2.4.4. Recent Developments
- 16.2.4.5. Financials (Based on Availability)
- 16.2.5 Xtremepush Limited
- 16.2.5.1. Overview
- 16.2.5.2. Products
- 16.2.5.3. SWOT Analysis
- 16.2.5.4. Recent Developments
- 16.2.5.5. Financials (Based on Availability)
- 16.2.6 Cisco Systems Inc
- 16.2.6.1. Overview
- 16.2.6.2. Products
- 16.2.6.3. SWOT Analysis
- 16.2.6.4. Recent Developments
- 16.2.6.5. Financials (Based on Availability)
- 16.2.7 Microsoft Corporation
- 16.2.7.1. Overview
- 16.2.7.2. Products
- 16.2.7.3. SWOT Analysis
- 16.2.7.4. Recent Developments
- 16.2.7.5. Financials (Based on Availability)
- 16.2.8 Ericsson Inc
- 16.2.8.1. Overview
- 16.2.8.2. Products
- 16.2.8.3. SWOT Analysis
- 16.2.8.4. Recent Developments
- 16.2.8.5. Financials (Based on Availability)
- 16.2.9 Oracle Corporation
- 16.2.9.1. Overview
- 16.2.9.2. Products
- 16.2.9.3. SWOT Analysis
- 16.2.9.4. Recent Developments
- 16.2.9.5. Financials (Based on Availability)
- 16.2.10 ESRI Business Information Solutions Inc
- 16.2.10.1. Overview
- 16.2.10.2. Products
- 16.2.10.3. SWOT Analysis
- 16.2.10.4. Recent Developments
- 16.2.10.5. Financials (Based on Availability)
- 16.2.11 Qualcomm Inc
- 16.2.11.1. Overview
- 16.2.11.2. Products
- 16.2.11.3. SWOT Analysis
- 16.2.11.4. Recent Developments
- 16.2.11.5. Financials (Based on Availability)
- 16.2.1 Adobe Systems Inc
List of Figures
- Figure 1: Global Geo Marketing Industry Revenue Breakdown (Million, %) by Region 2024 & 2032
- Figure 2: North America Geo Marketing Industry Revenue (Million), by Country 2024 & 2032
- Figure 3: North America Geo Marketing Industry Revenue Share (%), by Country 2024 & 2032
- Figure 4: Europe Geo Marketing Industry Revenue (Million), by Country 2024 & 2032
- Figure 5: Europe Geo Marketing Industry Revenue Share (%), by Country 2024 & 2032
- Figure 6: Asia Pacific Geo Marketing Industry Revenue (Million), by Country 2024 & 2032
- Figure 7: Asia Pacific Geo Marketing Industry Revenue Share (%), by Country 2024 & 2032
- Figure 8: Latin America Geo Marketing Industry Revenue (Million), by Country 2024 & 2032
- Figure 9: Latin America Geo Marketing Industry Revenue Share (%), by Country 2024 & 2032
- Figure 10: Middle East and Africa Geo Marketing Industry Revenue (Million), by Country 2024 & 2032
- Figure 11: Middle East and Africa Geo Marketing Industry Revenue Share (%), by Country 2024 & 2032
- Figure 12: North America Geo Marketing Industry Revenue (Million), by Components 2024 & 2032
- Figure 13: North America Geo Marketing Industry Revenue Share (%), by Components 2024 & 2032
- Figure 14: North America Geo Marketing Industry Revenue (Million), by Deployment 2024 & 2032
- Figure 15: North America Geo Marketing Industry Revenue Share (%), by Deployment 2024 & 2032
- Figure 16: North America Geo Marketing Industry Revenue (Million), by Location 2024 & 2032
- Figure 17: North America Geo Marketing Industry Revenue Share (%), by Location 2024 & 2032
- Figure 18: North America Geo Marketing Industry Revenue (Million), by End-User Industry 2024 & 2032
- Figure 19: North America Geo Marketing Industry Revenue Share (%), by End-User Industry 2024 & 2032
- Figure 20: North America Geo Marketing Industry Revenue (Million), by Country 2024 & 2032
- Figure 21: North America Geo Marketing Industry Revenue Share (%), by Country 2024 & 2032
- Figure 22: Europe Geo Marketing Industry Revenue (Million), by Components 2024 & 2032
- Figure 23: Europe Geo Marketing Industry Revenue Share (%), by Components 2024 & 2032
- Figure 24: Europe Geo Marketing Industry Revenue (Million), by Deployment 2024 & 2032
- Figure 25: Europe Geo Marketing Industry Revenue Share (%), by Deployment 2024 & 2032
- Figure 26: Europe Geo Marketing Industry Revenue (Million), by Location 2024 & 2032
- Figure 27: Europe Geo Marketing Industry Revenue Share (%), by Location 2024 & 2032
- Figure 28: Europe Geo Marketing Industry Revenue (Million), by End-User Industry 2024 & 2032
- Figure 29: Europe Geo Marketing Industry Revenue Share (%), by End-User Industry 2024 & 2032
- Figure 30: Europe Geo Marketing Industry Revenue (Million), by Country 2024 & 2032
- Figure 31: Europe Geo Marketing Industry Revenue Share (%), by Country 2024 & 2032
- Figure 32: Asia Pacific Geo Marketing Industry Revenue (Million), by Components 2024 & 2032
- Figure 33: Asia Pacific Geo Marketing Industry Revenue Share (%), by Components 2024 & 2032
- Figure 34: Asia Pacific Geo Marketing Industry Revenue (Million), by Deployment 2024 & 2032
- Figure 35: Asia Pacific Geo Marketing Industry Revenue Share (%), by Deployment 2024 & 2032
- Figure 36: Asia Pacific Geo Marketing Industry Revenue (Million), by Location 2024 & 2032
- Figure 37: Asia Pacific Geo Marketing Industry Revenue Share (%), by Location 2024 & 2032
- Figure 38: Asia Pacific Geo Marketing Industry Revenue (Million), by End-User Industry 2024 & 2032
- Figure 39: Asia Pacific Geo Marketing Industry Revenue Share (%), by End-User Industry 2024 & 2032
- Figure 40: Asia Pacific Geo Marketing Industry Revenue (Million), by Country 2024 & 2032
- Figure 41: Asia Pacific Geo Marketing Industry Revenue Share (%), by Country 2024 & 2032
- Figure 42: Latin America Geo Marketing Industry Revenue (Million), by Components 2024 & 2032
- Figure 43: Latin America Geo Marketing Industry Revenue Share (%), by Components 2024 & 2032
- Figure 44: Latin America Geo Marketing Industry Revenue (Million), by Deployment 2024 & 2032
- Figure 45: Latin America Geo Marketing Industry Revenue Share (%), by Deployment 2024 & 2032
- Figure 46: Latin America Geo Marketing Industry Revenue (Million), by Location 2024 & 2032
- Figure 47: Latin America Geo Marketing Industry Revenue Share (%), by Location 2024 & 2032
- Figure 48: Latin America Geo Marketing Industry Revenue (Million), by End-User Industry 2024 & 2032
- Figure 49: Latin America Geo Marketing Industry Revenue Share (%), by End-User Industry 2024 & 2032
- Figure 50: Latin America Geo Marketing Industry Revenue (Million), by Country 2024 & 2032
- Figure 51: Latin America Geo Marketing Industry Revenue Share (%), by Country 2024 & 2032
- Figure 52: Middle East and Africa Geo Marketing Industry Revenue (Million), by Components 2024 & 2032
- Figure 53: Middle East and Africa Geo Marketing Industry Revenue Share (%), by Components 2024 & 2032
- Figure 54: Middle East and Africa Geo Marketing Industry Revenue (Million), by Deployment 2024 & 2032
- Figure 55: Middle East and Africa Geo Marketing Industry Revenue Share (%), by Deployment 2024 & 2032
- Figure 56: Middle East and Africa Geo Marketing Industry Revenue (Million), by Location 2024 & 2032
- Figure 57: Middle East and Africa Geo Marketing Industry Revenue Share (%), by Location 2024 & 2032
- Figure 58: Middle East and Africa Geo Marketing Industry Revenue (Million), by End-User Industry 2024 & 2032
- Figure 59: Middle East and Africa Geo Marketing Industry Revenue Share (%), by End-User Industry 2024 & 2032
- Figure 60: Middle East and Africa Geo Marketing Industry Revenue (Million), by Country 2024 & 2032
- Figure 61: Middle East and Africa Geo Marketing Industry Revenue Share (%), by Country 2024 & 2032
List of Tables
- Table 1: Global Geo Marketing Industry Revenue Million Forecast, by Region 2019 & 2032
- Table 2: Global Geo Marketing Industry Revenue Million Forecast, by Components 2019 & 2032
- Table 3: Global Geo Marketing Industry Revenue Million Forecast, by Deployment 2019 & 2032
- Table 4: Global Geo Marketing Industry Revenue Million Forecast, by Location 2019 & 2032
- Table 5: Global Geo Marketing Industry Revenue Million Forecast, by End-User Industry 2019 & 2032
- Table 6: Global Geo Marketing Industry Revenue Million Forecast, by Region 2019 & 2032
- Table 7: Global Geo Marketing Industry Revenue Million Forecast, by Country 2019 & 2032
- Table 8: Geo Marketing Industry Revenue (Million) Forecast, by Application 2019 & 2032
- Table 9: Global Geo Marketing Industry Revenue Million Forecast, by Country 2019 & 2032
- Table 10: Geo Marketing Industry Revenue (Million) Forecast, by Application 2019 & 2032
- Table 11: Global Geo Marketing Industry Revenue Million Forecast, by Country 2019 & 2032
- Table 12: Geo Marketing Industry Revenue (Million) Forecast, by Application 2019 & 2032
- Table 13: Global Geo Marketing Industry Revenue Million Forecast, by Country 2019 & 2032
- Table 14: Geo Marketing Industry Revenue (Million) Forecast, by Application 2019 & 2032
- Table 15: Global Geo Marketing Industry Revenue Million Forecast, by Country 2019 & 2032
- Table 16: Geo Marketing Industry Revenue (Million) Forecast, by Application 2019 & 2032
- Table 17: Global Geo Marketing Industry Revenue Million Forecast, by Components 2019 & 2032
- Table 18: Global Geo Marketing Industry Revenue Million Forecast, by Deployment 2019 & 2032
- Table 19: Global Geo Marketing Industry Revenue Million Forecast, by Location 2019 & 2032
- Table 20: Global Geo Marketing Industry Revenue Million Forecast, by End-User Industry 2019 & 2032
- Table 21: Global Geo Marketing Industry Revenue Million Forecast, by Country 2019 & 2032
- Table 22: Global Geo Marketing Industry Revenue Million Forecast, by Components 2019 & 2032
- Table 23: Global Geo Marketing Industry Revenue Million Forecast, by Deployment 2019 & 2032
- Table 24: Global Geo Marketing Industry Revenue Million Forecast, by Location 2019 & 2032
- Table 25: Global Geo Marketing Industry Revenue Million Forecast, by End-User Industry 2019 & 2032
- Table 26: Global Geo Marketing Industry Revenue Million Forecast, by Country 2019 & 2032
- Table 27: Global Geo Marketing Industry Revenue Million Forecast, by Components 2019 & 2032
- Table 28: Global Geo Marketing Industry Revenue Million Forecast, by Deployment 2019 & 2032
- Table 29: Global Geo Marketing Industry Revenue Million Forecast, by Location 2019 & 2032
- Table 30: Global Geo Marketing Industry Revenue Million Forecast, by End-User Industry 2019 & 2032
- Table 31: Global Geo Marketing Industry Revenue Million Forecast, by Country 2019 & 2032
- Table 32: Global Geo Marketing Industry Revenue Million Forecast, by Components 2019 & 2032
- Table 33: Global Geo Marketing Industry Revenue Million Forecast, by Deployment 2019 & 2032
- Table 34: Global Geo Marketing Industry Revenue Million Forecast, by Location 2019 & 2032
- Table 35: Global Geo Marketing Industry Revenue Million Forecast, by End-User Industry 2019 & 2032
- Table 36: Global Geo Marketing Industry Revenue Million Forecast, by Country 2019 & 2032
- Table 37: Global Geo Marketing Industry Revenue Million Forecast, by Components 2019 & 2032
- Table 38: Global Geo Marketing Industry Revenue Million Forecast, by Deployment 2019 & 2032
- Table 39: Global Geo Marketing Industry Revenue Million Forecast, by Location 2019 & 2032
- Table 40: Global Geo Marketing Industry Revenue Million Forecast, by End-User Industry 2019 & 2032
- Table 41: Global Geo Marketing Industry Revenue Million Forecast, by Country 2019 & 2032
Frequently Asked Questions
1. What is the projected Compound Annual Growth Rate (CAGR) of the Geo Marketing Industry?
The projected CAGR is approximately 20.50%.
2. Which companies are prominent players in the Geo Marketing Industry?
Key companies in the market include Adobe Systems Inc, IBM Corporation, Google LLC, Software AG, Xtremepush Limited, Cisco Systems Inc, Microsoft Corporation, Ericsson Inc, Oracle Corporation, ESRI Business Information Solutions Inc, Qualcomm Inc.
3. What are the main segments of the Geo Marketing Industry?
The market segments include Components, Deployment, Location, End-User Industry.
4. Can you provide details about the market size?
The market size is estimated to be USD 17.29 Million as of 2022.
5. What are some drivers contributing to market growth?
Increasing Adoption of Emerging Technologies in Marketing Sector; Increasing Demand for Location-Based Intelligence to Enhance the Business Revenue.
6. What are the notable trends driving market growth?
Services Components Segment is Expected to Hold Significant Market Share.
7. Are there any restraints impacting market growth?
Increasing Security and Privacy Concerns Among Enterprises.
8. Can you provide examples of recent developments in the market?
Jan 2023: MapZot.AI provides Mobile Location data to assist businesses in increasing foot traffic. MapZot.AI provides site selection, portfolio analytics, and vacancy analysis by providing insights into the exact habits of consumers, allowing company owners to properly estimate customer accessibility. The data provided by MapZot.AI is insightful and simple; by combining detailed metrics such as store saturation and pull rates with a simple UI, any business owner can take advantage of the advanced analytics capabilities that MapZot.AI provides to gain insight into what drives customers to their stores and which potential locations could be advantageous for opening new ones.
9. What pricing options are available for accessing the report?
Pricing options include single-user, multi-user, and enterprise licenses priced at USD 4750, USD 5250, and USD 8750 respectively.
10. Is the market size provided in terms of value or volume?
The market size is provided in terms of value, measured in Million.
11. Are there any specific market keywords associated with the report?
Yes, the market keyword associated with the report is "Geo Marketing Industry," which aids in identifying and referencing the specific market segment covered.
12. How do I determine which pricing option suits my needs best?
The pricing options vary based on user requirements and access needs. Individual users may opt for single-user licenses, while businesses requiring broader access may choose multi-user or enterprise licenses for cost-effective access to the report.
13. Are there any additional resources or data provided in the Geo Marketing Industry report?
While the report offers comprehensive insights, it's advisable to review the specific contents or supplementary materials provided to ascertain if additional resources or data are available.
14. How can I stay updated on further developments or reports in the Geo Marketing Industry?
To stay informed about further developments, trends, and reports in the Geo Marketing Industry, consider subscribing to industry newsletters, following relevant companies and organizations, or regularly checking reputable industry news sources and publications.
Methodology
Step 1 - Identification of Relevant Samples Size from Population Database


Step 2 - Approaches for Defining Global Market Size (Value, Volume* & Price*)

Note*: In applicable scenarios
Step 3 - Data Sources
Primary Research
- Web Analytics
- Survey Reports
- Research Institute
- Latest Research Reports
- Opinion Leaders
Secondary Research
- Annual Reports
- White Paper
- Latest Press Release
- Industry Association
- Paid Database
- Investor Presentations

Step 4 - Data Triangulation
Involves using different sources of information in order to increase the validity of a study
These sources are likely to be stakeholders in a program - participants, other researchers, program staff, other community members, and so on.
Then we put all data in single framework & apply various statistical tools to find out the dynamic on the market.
During the analysis stage, feedback from the stakeholder groups would be compared to determine areas of agreement as well as areas of divergence
