

Key Insights
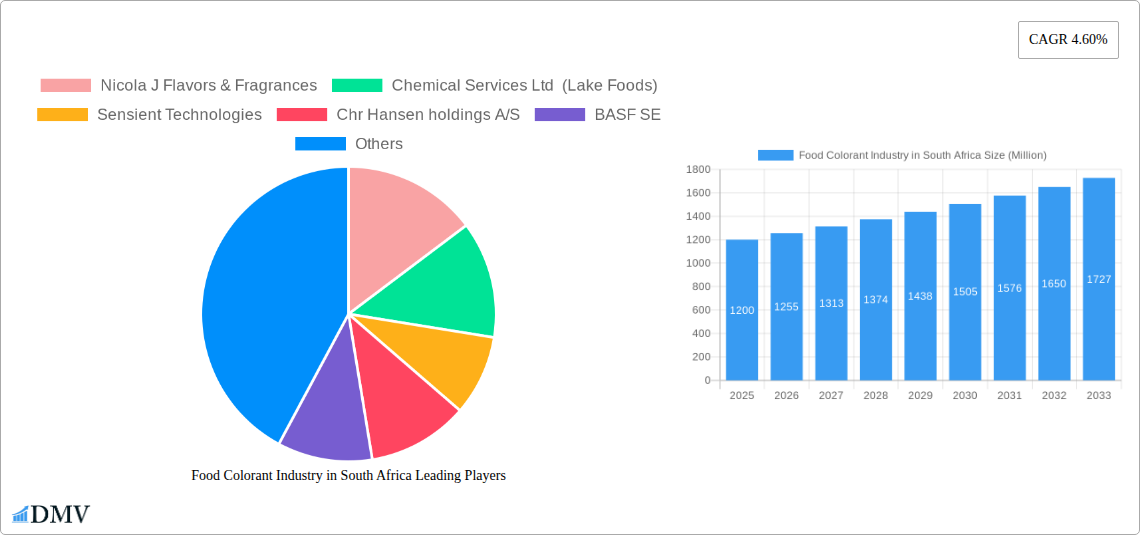
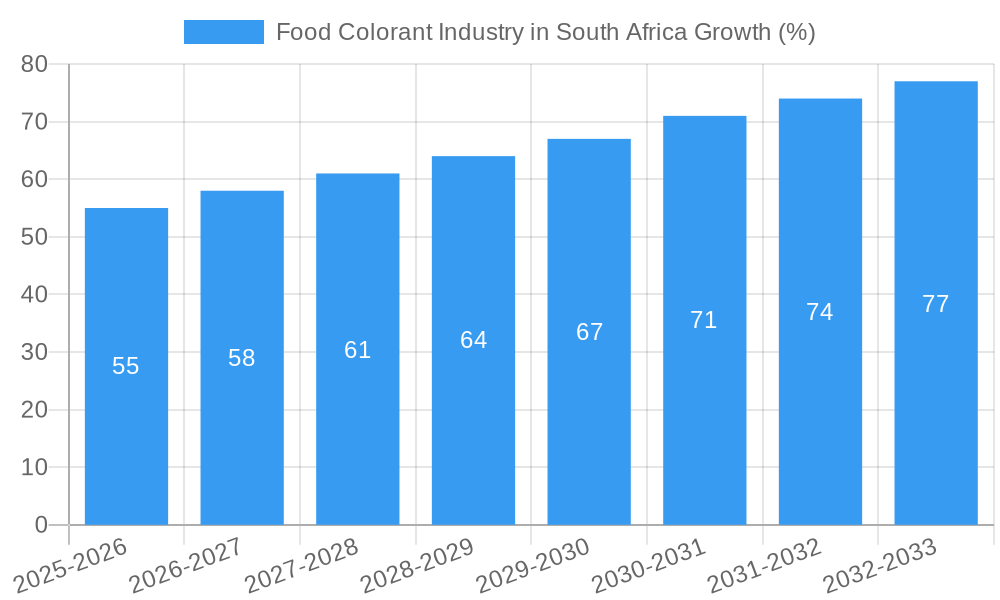
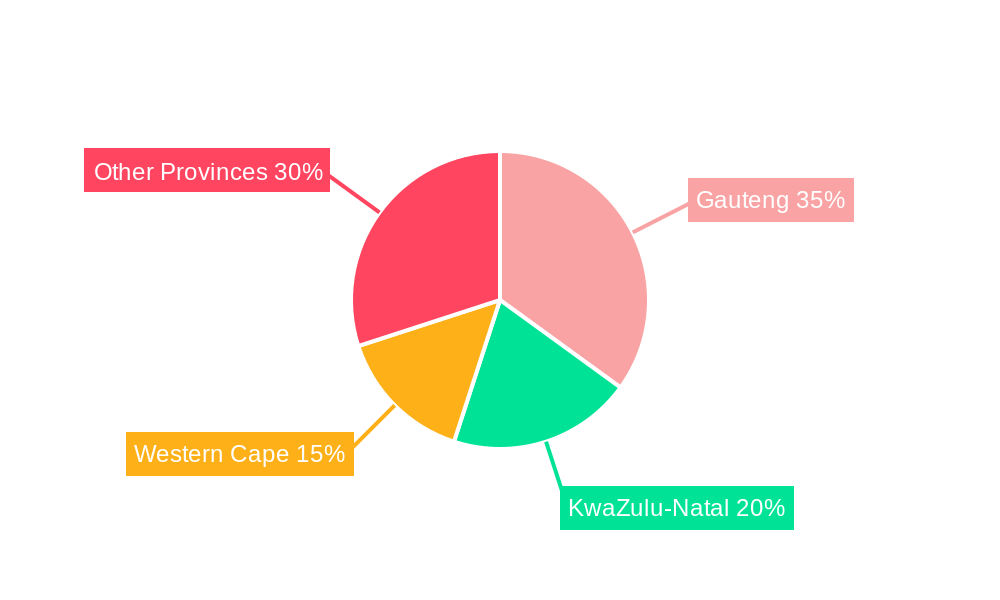
The South African food colorant market, valued at approximately ZAR 1.2 billion (estimated based on global trends and regional economic data) in 2025, is projected to experience steady growth at a Compound Annual Growth Rate (CAGR) of 4.60% from 2025 to 2033. This expansion is fueled by several key drivers. The rising demand for processed foods, particularly in urban areas, is a significant factor, with consumers increasingly seeking visually appealing products. Furthermore, the burgeoning food and beverage industry, including bakery, confectionery, and beverage sectors, significantly contributes to the market's growth. The increasing adoption of natural food colorants driven by health consciousness also shapes market trends, although synthetic colorants still maintain a substantial market share due to their cost-effectiveness and vibrant color properties. However, stringent regulations regarding food safety and the growing awareness of the potential health implications associated with certain synthetic colorants present a challenge. The market is segmented by product type (synthetic and natural) and application (bakery, dairy, confectionery, meat, beverages, etc.). Key players like Nicola J Flavors & Fragrances, Chemical Services Ltd (Lake Foods), and Sensient Technologies compete intensely, employing strategies like product diversification and strategic partnerships to maintain market share. The market's regional distribution within South Africa showcases variations depending on economic development and consumer preferences across different provinces.
The forecast period of 2025-2033 indicates continued expansion, albeit potentially at a slightly moderated pace depending on economic fluctuations and regulatory changes. The growth will likely be driven by innovative product launches featuring natural colorants, catering to health-conscious consumers, along with efforts by manufacturers to optimize cost-effectiveness for synthetic options. The market's future will depend on the balance between consumer preference for natural colorants, the affordability of synthetic alternatives, and the evolving regulatory landscape governing the use of food colorants in South Africa. This dynamic interplay makes accurate projection a complex task, requiring close monitoring of these influencing factors.
South Africa Food Colorant Industry Report: 2019-2033
This comprehensive report provides a detailed analysis of the South African food colorant market, offering invaluable insights for stakeholders seeking to understand market dynamics, growth opportunities, and competitive landscapes. The study period spans from 2019 to 2033, with 2025 serving as both the base and estimated year. The report meticulously examines market trends, leading players, and future prospects, incorporating both historical (2019-2024) and forecasted (2025-2033) data. The market size is predicted to reach xx Million by 2033, exhibiting a robust Compound Annual Growth Rate (CAGR) of xx%.
Food Colorant Industry in South Africa Market Composition & Trends
This section delves into the competitive landscape of the South African food colorant market, analyzing market concentration, innovation drivers, regulatory influences, substitute products, end-user preferences, and merger & acquisition (M&A) activities. The market is characterized by a moderate level of concentration, with key players such as BASF SE, Sensient Technologies, and Chr. Hansen holding significant market share. However, smaller, specialized companies like Nicola J Flavors & Fragrances and EDCOL also contribute significantly, catering to niche demands.
- Market Share Distribution (2025): BASF SE (xx%), Sensient Technologies (xx%), Chr. Hansen (xx%), Others (xx%).
- Innovation Catalysts: Growing demand for natural colorants, increasing focus on clean-label products, and advancements in color stabilization technologies are driving innovation.
- Regulatory Landscape: Stringent regulations regarding food safety and labeling are shaping the market, favoring companies compliant with international standards.
- Substitute Products: While natural colorants are gaining traction, synthetic colorants still dominate due to their cost-effectiveness and consistent performance.
- End-User Profiles: Major end-use sectors include beverages, confectionery, bakery, and dairy products. The demand from the growing processed food sector is a key driver.
- M&A Activities (2019-2024): A total of xx M&A deals were recorded, with a total estimated value of xx Million, primarily focused on expanding product portfolios and enhancing market reach.
Food Colorant Industry in South Africa Industry Evolution
This section traces the evolution of the South African food colorant industry, highlighting growth trajectories, technological advancements, and evolving consumer preferences. The market has witnessed consistent growth over the historical period (2019-2024), driven by factors such as rising disposable incomes, changing dietary habits, and increasing demand for processed foods. The adoption of natural food colorants has steadily increased, reaching approximately xx% of the total market share in 2024. Technological advancements, such as improved extraction techniques for natural colorants and the development of more stable synthetic colorants, have also influenced market trends. Shifting consumer preferences towards healthier and cleaner food products has fueled demand for natural colorants, leading to increased investments in research and development in this segment. The forecast period (2025-2033) is projected to witness sustained growth, with a projected CAGR of xx%, driven by a growing middle class and increasing urbanization. The increased awareness of health implications of synthetic colorants is expected to boost the demand for natural colorants further.
Leading Regions, Countries, or Segments in Food Colorant Industry in South Africa
While South Africa itself constitutes the primary market, regional variations exist in consumption patterns and preferences. The major segments within the South African market are:
By Product Type:
- Synthetic Food Colorants: Remains the dominant segment owing to cost-effectiveness and vibrant colors. Key drivers include established supply chains and wide acceptance across food applications.
- Natural Food Colorants: Experiencing significant growth, driven by consumer preference for natural ingredients and clean labels. Key drivers include increasing health awareness and regulatory support for natural products.
By Application:
- Beverages: A leading application segment due to widespread consumption of soft drinks, juices, and alcoholic beverages.
- Confectionery: Significant demand for vibrant colors in candies, chocolates, and other confectionery items.
- Bakery: Strong demand for color in baked goods, driving growth in this application segment.
Dominance Factors: The dominance of specific segments is largely influenced by consumer preferences, technological advancements, regulatory frameworks, and the availability of raw materials. The rise of the natural food colorant segment reflects a global shift towards healthier lifestyles and greater transparency in food products.
Food Colorant Industry in South Africa Product Innovations
Recent product innovations include the development of more stable and versatile natural colorants, extending their application range. Advancements in encapsulation technologies have improved the shelf life and performance of both synthetic and natural colorants. Unique selling propositions focus on clean label certifications, enhanced color intensity, and improved heat and light stability. The use of sustainable sourcing practices for natural colorants is also gaining traction.
Propelling Factors for Food Colorant Industry in South Africa Growth
Key growth drivers include rising disposable incomes and urbanization, fueling demand for processed foods. Technological advancements in color stabilization and extraction techniques have expanded application possibilities. Government support for the food processing industry and regulatory measures promoting food safety also contribute significantly.
Obstacles in the Food Colorant Industry in South Africa Market
Challenges include fluctuating raw material prices, particularly for natural colorants. Supply chain disruptions and stringent regulations regarding food safety and labeling pose significant hurdles. Intense competition and price pressures from both domestic and international players also present difficulties for market participants.
Future Opportunities in Food Colorant Industry in South Africa
Emerging opportunities lie in expanding into niche markets, like functional foods and organic products. Increased adoption of innovative technologies such as nanotechnology and microencapsulation will create new possibilities. Catering to evolving consumer demands for personalized and customized food experiences will also present significant growth prospects.
Major Players in the Food Colorant Industry in South Africa Ecosystem
- Nicola J Flavors & Fragrances
- Chemical Services Ltd (Lake Foods)
- Sensient Technologies
- Chr. Hansen holdings A/S
- BASF SE
- Quantum Colors S
- EDCOL
Key Developments in Food Colorant Industry in South Africa Industry
- 2022 Q3: Launch of a new range of natural colorants by Sensient Technologies.
- 2023 Q1: New regulations implemented regarding the labeling of synthetic colorants.
- 2024 Q2: Acquisition of a smaller local colorant manufacturer by BASF SE.
Strategic Food Colorant Industry in South Africa Market Forecast
The South African food colorant market is poised for significant growth in the coming years, driven by consumer demand for diverse and appealing food products. The increasing adoption of natural colorants, coupled with technological advancements, will create new opportunities for both established players and new entrants. The market's future hinges on the continued growth of the processed food sector, evolving consumer preferences, and the capacity of companies to adapt to changing regulations.
Food Colorant Industry in South Africa Segmentation
-
1. Product Type
- 1.1. Synthetic Food colorants
- 1.2. Natural Food Colorants
-
2. Application
- 2.1. Bakery
- 2.2. Dairy & Frozen products
- 2.3. Confectionery
- 2.4. Meat poultry & Sea Food products
- 2.5. Beverages
- 2.6. Others
Food Colorant Industry in South Africa Segmentation By Geography
-
1. North America
- 1.1. United States
- 1.2. Canada
- 1.3. Mexico
-
2. South America
- 2.1. Brazil
- 2.2. Argentina
- 2.3. Rest of South America
-
3. Europe
- 3.1. United Kingdom
- 3.2. Germany
- 3.3. France
- 3.4. Italy
- 3.5. Spain
- 3.6. Russia
- 3.7. Benelux
- 3.8. Nordics
- 3.9. Rest of Europe
-
4. Middle East & Africa
- 4.1. Turkey
- 4.2. Israel
- 4.3. GCC
- 4.4. North Africa
- 4.5. South Africa
- 4.6. Rest of Middle East & Africa
-
5. Asia Pacific
- 5.1. China
- 5.2. India
- 5.3. Japan
- 5.4. South Korea
- 5.5. ASEAN
- 5.6. Oceania
- 5.7. Rest of Asia Pacific
Food Colorant Industry in South Africa REPORT HIGHLIGHTS
| Aspects | Details |
|---|---|
| Study Period | 2019-2033 |
| Base Year | 2024 |
| Estimated Year | 2025 |
| Forecast Period | 2025-2033 |
| Historical Period | 2019-2024 |
| Growth Rate | CAGR of 4.60% from 2019-2033 |
| Segmentation |
|
Table of Contents
- 1. Introduction
- 1.1. Research Scope
- 1.2. Market Segmentation
- 1.3. Research Methodology
- 1.4. Definitions and Assumptions
- 2. Executive Summary
- 2.1. Introduction
- 3. Market Dynamics
- 3.1. Introduction
- 3.2. Market Drivers
- 3.2.1. Rising Health Consciousness among consumer
- 3.3. Market Restrains
- 3.3.1. High Cost of natural Ingredients
- 3.4. Market Trends
- 3.4.1. Growing Emergence of Natural Color
- 4. Market Factor Analysis
- 4.1. Porters Five Forces
- 4.2. Supply/Value Chain
- 4.3. PESTEL analysis
- 4.4. Market Entropy
- 4.5. Patent/Trademark Analysis
- 5. Global Food Colorant Industry in South Africa Analysis, Insights and Forecast, 2019-2031
- 5.1. Market Analysis, Insights and Forecast - by Product Type
- 5.1.1. Synthetic Food colorants
- 5.1.2. Natural Food Colorants
- 5.2. Market Analysis, Insights and Forecast - by Application
- 5.2.1. Bakery
- 5.2.2. Dairy & Frozen products
- 5.2.3. Confectionery
- 5.2.4. Meat poultry & Sea Food products
- 5.2.5. Beverages
- 5.2.6. Others
- 5.3. Market Analysis, Insights and Forecast - by Region
- 5.3.1. North America
- 5.3.2. South America
- 5.3.3. Europe
- 5.3.4. Middle East & Africa
- 5.3.5. Asia Pacific
- 5.1. Market Analysis, Insights and Forecast - by Product Type
- 6. North America Food Colorant Industry in South Africa Analysis, Insights and Forecast, 2019-2031
- 6.1. Market Analysis, Insights and Forecast - by Product Type
- 6.1.1. Synthetic Food colorants
- 6.1.2. Natural Food Colorants
- 6.2. Market Analysis, Insights and Forecast - by Application
- 6.2.1. Bakery
- 6.2.2. Dairy & Frozen products
- 6.2.3. Confectionery
- 6.2.4. Meat poultry & Sea Food products
- 6.2.5. Beverages
- 6.2.6. Others
- 6.1. Market Analysis, Insights and Forecast - by Product Type
- 7. South America Food Colorant Industry in South Africa Analysis, Insights and Forecast, 2019-2031
- 7.1. Market Analysis, Insights and Forecast - by Product Type
- 7.1.1. Synthetic Food colorants
- 7.1.2. Natural Food Colorants
- 7.2. Market Analysis, Insights and Forecast - by Application
- 7.2.1. Bakery
- 7.2.2. Dairy & Frozen products
- 7.2.3. Confectionery
- 7.2.4. Meat poultry & Sea Food products
- 7.2.5. Beverages
- 7.2.6. Others
- 7.1. Market Analysis, Insights and Forecast - by Product Type
- 8. Europe Food Colorant Industry in South Africa Analysis, Insights and Forecast, 2019-2031
- 8.1. Market Analysis, Insights and Forecast - by Product Type
- 8.1.1. Synthetic Food colorants
- 8.1.2. Natural Food Colorants
- 8.2. Market Analysis, Insights and Forecast - by Application
- 8.2.1. Bakery
- 8.2.2. Dairy & Frozen products
- 8.2.3. Confectionery
- 8.2.4. Meat poultry & Sea Food products
- 8.2.5. Beverages
- 8.2.6. Others
- 8.1. Market Analysis, Insights and Forecast - by Product Type
- 9. Middle East & Africa Food Colorant Industry in South Africa Analysis, Insights and Forecast, 2019-2031
- 9.1. Market Analysis, Insights and Forecast - by Product Type
- 9.1.1. Synthetic Food colorants
- 9.1.2. Natural Food Colorants
- 9.2. Market Analysis, Insights and Forecast - by Application
- 9.2.1. Bakery
- 9.2.2. Dairy & Frozen products
- 9.2.3. Confectionery
- 9.2.4. Meat poultry & Sea Food products
- 9.2.5. Beverages
- 9.2.6. Others
- 9.1. Market Analysis, Insights and Forecast - by Product Type
- 10. Asia Pacific Food Colorant Industry in South Africa Analysis, Insights and Forecast, 2019-2031
- 10.1. Market Analysis, Insights and Forecast - by Product Type
- 10.1.1. Synthetic Food colorants
- 10.1.2. Natural Food Colorants
- 10.2. Market Analysis, Insights and Forecast - by Application
- 10.2.1. Bakery
- 10.2.2. Dairy & Frozen products
- 10.2.3. Confectionery
- 10.2.4. Meat poultry & Sea Food products
- 10.2.5. Beverages
- 10.2.6. Others
- 10.1. Market Analysis, Insights and Forecast - by Product Type
- 11. South Africa Food Colorant Industry in South Africa Analysis, Insights and Forecast, 2019-2031
- 12. Sudan Food Colorant Industry in South Africa Analysis, Insights and Forecast, 2019-2031
- 13. Uganda Food Colorant Industry in South Africa Analysis, Insights and Forecast, 2019-2031
- 14. Tanzania Food Colorant Industry in South Africa Analysis, Insights and Forecast, 2019-2031
- 15. Kenya Food Colorant Industry in South Africa Analysis, Insights and Forecast, 2019-2031
- 16. Rest of Africa Food Colorant Industry in South Africa Analysis, Insights and Forecast, 2019-2031
- 17. Competitive Analysis
- 17.1. Global Market Share Analysis 2024
- 17.2. Company Profiles
- 17.2.1 Nicola J Flavors & Fragrances
- 17.2.1.1. Overview
- 17.2.1.2. Products
- 17.2.1.3. SWOT Analysis
- 17.2.1.4. Recent Developments
- 17.2.1.5. Financials (Based on Availability)
- 17.2.2 Chemical Services Ltd (Lake Foods)
- 17.2.2.1. Overview
- 17.2.2.2. Products
- 17.2.2.3. SWOT Analysis
- 17.2.2.4. Recent Developments
- 17.2.2.5. Financials (Based on Availability)
- 17.2.3 Sensient Technologies
- 17.2.3.1. Overview
- 17.2.3.2. Products
- 17.2.3.3. SWOT Analysis
- 17.2.3.4. Recent Developments
- 17.2.3.5. Financials (Based on Availability)
- 17.2.4 Chr Hansen holdings A/S
- 17.2.4.1. Overview
- 17.2.4.2. Products
- 17.2.4.3. SWOT Analysis
- 17.2.4.4. Recent Developments
- 17.2.4.5. Financials (Based on Availability)
- 17.2.5 BASF SE
- 17.2.5.1. Overview
- 17.2.5.2. Products
- 17.2.5.3. SWOT Analysis
- 17.2.5.4. Recent Developments
- 17.2.5.5. Financials (Based on Availability)
- 17.2.6 Quantum Colors S
- 17.2.6.1. Overview
- 17.2.6.2. Products
- 17.2.6.3. SWOT Analysis
- 17.2.6.4. Recent Developments
- 17.2.6.5. Financials (Based on Availability)
- 17.2.7 EDCOL
- 17.2.7.1. Overview
- 17.2.7.2. Products
- 17.2.7.3. SWOT Analysis
- 17.2.7.4. Recent Developments
- 17.2.7.5. Financials (Based on Availability)
- 17.2.1 Nicola J Flavors & Fragrances
List of Figures
- Figure 1: Global Food Colorant Industry in South Africa Revenue Breakdown (Million, %) by Region 2024 & 2032
- Figure 2: Africa Food Colorant Industry in South Africa Revenue (Million), by Country 2024 & 2032
- Figure 3: Africa Food Colorant Industry in South Africa Revenue Share (%), by Country 2024 & 2032
- Figure 4: North America Food Colorant Industry in South Africa Revenue (Million), by Product Type 2024 & 2032
- Figure 5: North America Food Colorant Industry in South Africa Revenue Share (%), by Product Type 2024 & 2032
- Figure 6: North America Food Colorant Industry in South Africa Revenue (Million), by Application 2024 & 2032
- Figure 7: North America Food Colorant Industry in South Africa Revenue Share (%), by Application 2024 & 2032
- Figure 8: North America Food Colorant Industry in South Africa Revenue (Million), by Country 2024 & 2032
- Figure 9: North America Food Colorant Industry in South Africa Revenue Share (%), by Country 2024 & 2032
- Figure 10: South America Food Colorant Industry in South Africa Revenue (Million), by Product Type 2024 & 2032
- Figure 11: South America Food Colorant Industry in South Africa Revenue Share (%), by Product Type 2024 & 2032
- Figure 12: South America Food Colorant Industry in South Africa Revenue (Million), by Application 2024 & 2032
- Figure 13: South America Food Colorant Industry in South Africa Revenue Share (%), by Application 2024 & 2032
- Figure 14: South America Food Colorant Industry in South Africa Revenue (Million), by Country 2024 & 2032
- Figure 15: South America Food Colorant Industry in South Africa Revenue Share (%), by Country 2024 & 2032
- Figure 16: Europe Food Colorant Industry in South Africa Revenue (Million), by Product Type 2024 & 2032
- Figure 17: Europe Food Colorant Industry in South Africa Revenue Share (%), by Product Type 2024 & 2032
- Figure 18: Europe Food Colorant Industry in South Africa Revenue (Million), by Application 2024 & 2032
- Figure 19: Europe Food Colorant Industry in South Africa Revenue Share (%), by Application 2024 & 2032
- Figure 20: Europe Food Colorant Industry in South Africa Revenue (Million), by Country 2024 & 2032
- Figure 21: Europe Food Colorant Industry in South Africa Revenue Share (%), by Country 2024 & 2032
- Figure 22: Middle East & Africa Food Colorant Industry in South Africa Revenue (Million), by Product Type 2024 & 2032
- Figure 23: Middle East & Africa Food Colorant Industry in South Africa Revenue Share (%), by Product Type 2024 & 2032
- Figure 24: Middle East & Africa Food Colorant Industry in South Africa Revenue (Million), by Application 2024 & 2032
- Figure 25: Middle East & Africa Food Colorant Industry in South Africa Revenue Share (%), by Application 2024 & 2032
- Figure 26: Middle East & Africa Food Colorant Industry in South Africa Revenue (Million), by Country 2024 & 2032
- Figure 27: Middle East & Africa Food Colorant Industry in South Africa Revenue Share (%), by Country 2024 & 2032
- Figure 28: Asia Pacific Food Colorant Industry in South Africa Revenue (Million), by Product Type 2024 & 2032
- Figure 29: Asia Pacific Food Colorant Industry in South Africa Revenue Share (%), by Product Type 2024 & 2032
- Figure 30: Asia Pacific Food Colorant Industry in South Africa Revenue (Million), by Application 2024 & 2032
- Figure 31: Asia Pacific Food Colorant Industry in South Africa Revenue Share (%), by Application 2024 & 2032
- Figure 32: Asia Pacific Food Colorant Industry in South Africa Revenue (Million), by Country 2024 & 2032
- Figure 33: Asia Pacific Food Colorant Industry in South Africa Revenue Share (%), by Country 2024 & 2032
List of Tables
- Table 1: Global Food Colorant Industry in South Africa Revenue Million Forecast, by Region 2019 & 2032
- Table 2: Global Food Colorant Industry in South Africa Revenue Million Forecast, by Product Type 2019 & 2032
- Table 3: Global Food Colorant Industry in South Africa Revenue Million Forecast, by Application 2019 & 2032
- Table 4: Global Food Colorant Industry in South Africa Revenue Million Forecast, by Region 2019 & 2032
- Table 5: Global Food Colorant Industry in South Africa Revenue Million Forecast, by Country 2019 & 2032
- Table 6: South Africa Food Colorant Industry in South Africa Revenue (Million) Forecast, by Application 2019 & 2032
- Table 7: Sudan Food Colorant Industry in South Africa Revenue (Million) Forecast, by Application 2019 & 2032
- Table 8: Uganda Food Colorant Industry in South Africa Revenue (Million) Forecast, by Application 2019 & 2032
- Table 9: Tanzania Food Colorant Industry in South Africa Revenue (Million) Forecast, by Application 2019 & 2032
- Table 10: Kenya Food Colorant Industry in South Africa Revenue (Million) Forecast, by Application 2019 & 2032
- Table 11: Rest of Africa Food Colorant Industry in South Africa Revenue (Million) Forecast, by Application 2019 & 2032
- Table 12: Global Food Colorant Industry in South Africa Revenue Million Forecast, by Product Type 2019 & 2032
- Table 13: Global Food Colorant Industry in South Africa Revenue Million Forecast, by Application 2019 & 2032
- Table 14: Global Food Colorant Industry in South Africa Revenue Million Forecast, by Country 2019 & 2032
- Table 15: United States Food Colorant Industry in South Africa Revenue (Million) Forecast, by Application 2019 & 2032
- Table 16: Canada Food Colorant Industry in South Africa Revenue (Million) Forecast, by Application 2019 & 2032
- Table 17: Mexico Food Colorant Industry in South Africa Revenue (Million) Forecast, by Application 2019 & 2032
- Table 18: Global Food Colorant Industry in South Africa Revenue Million Forecast, by Product Type 2019 & 2032
- Table 19: Global Food Colorant Industry in South Africa Revenue Million Forecast, by Application 2019 & 2032
- Table 20: Global Food Colorant Industry in South Africa Revenue Million Forecast, by Country 2019 & 2032
- Table 21: Brazil Food Colorant Industry in South Africa Revenue (Million) Forecast, by Application 2019 & 2032
- Table 22: Argentina Food Colorant Industry in South Africa Revenue (Million) Forecast, by Application 2019 & 2032
- Table 23: Rest of South America Food Colorant Industry in South Africa Revenue (Million) Forecast, by Application 2019 & 2032
- Table 24: Global Food Colorant Industry in South Africa Revenue Million Forecast, by Product Type 2019 & 2032
- Table 25: Global Food Colorant Industry in South Africa Revenue Million Forecast, by Application 2019 & 2032
- Table 26: Global Food Colorant Industry in South Africa Revenue Million Forecast, by Country 2019 & 2032
- Table 27: United Kingdom Food Colorant Industry in South Africa Revenue (Million) Forecast, by Application 2019 & 2032
- Table 28: Germany Food Colorant Industry in South Africa Revenue (Million) Forecast, by Application 2019 & 2032
- Table 29: France Food Colorant Industry in South Africa Revenue (Million) Forecast, by Application 2019 & 2032
- Table 30: Italy Food Colorant Industry in South Africa Revenue (Million) Forecast, by Application 2019 & 2032
- Table 31: Spain Food Colorant Industry in South Africa Revenue (Million) Forecast, by Application 2019 & 2032
- Table 32: Russia Food Colorant Industry in South Africa Revenue (Million) Forecast, by Application 2019 & 2032
- Table 33: Benelux Food Colorant Industry in South Africa Revenue (Million) Forecast, by Application 2019 & 2032
- Table 34: Nordics Food Colorant Industry in South Africa Revenue (Million) Forecast, by Application 2019 & 2032
- Table 35: Rest of Europe Food Colorant Industry in South Africa Revenue (Million) Forecast, by Application 2019 & 2032
- Table 36: Global Food Colorant Industry in South Africa Revenue Million Forecast, by Product Type 2019 & 2032
- Table 37: Global Food Colorant Industry in South Africa Revenue Million Forecast, by Application 2019 & 2032
- Table 38: Global Food Colorant Industry in South Africa Revenue Million Forecast, by Country 2019 & 2032
- Table 39: Turkey Food Colorant Industry in South Africa Revenue (Million) Forecast, by Application 2019 & 2032
- Table 40: Israel Food Colorant Industry in South Africa Revenue (Million) Forecast, by Application 2019 & 2032
- Table 41: GCC Food Colorant Industry in South Africa Revenue (Million) Forecast, by Application 2019 & 2032
- Table 42: North Africa Food Colorant Industry in South Africa Revenue (Million) Forecast, by Application 2019 & 2032
- Table 43: South Africa Food Colorant Industry in South Africa Revenue (Million) Forecast, by Application 2019 & 2032
- Table 44: Rest of Middle East & Africa Food Colorant Industry in South Africa Revenue (Million) Forecast, by Application 2019 & 2032
- Table 45: Global Food Colorant Industry in South Africa Revenue Million Forecast, by Product Type 2019 & 2032
- Table 46: Global Food Colorant Industry in South Africa Revenue Million Forecast, by Application 2019 & 2032
- Table 47: Global Food Colorant Industry in South Africa Revenue Million Forecast, by Country 2019 & 2032
- Table 48: China Food Colorant Industry in South Africa Revenue (Million) Forecast, by Application 2019 & 2032
- Table 49: India Food Colorant Industry in South Africa Revenue (Million) Forecast, by Application 2019 & 2032
- Table 50: Japan Food Colorant Industry in South Africa Revenue (Million) Forecast, by Application 2019 & 2032
- Table 51: South Korea Food Colorant Industry in South Africa Revenue (Million) Forecast, by Application 2019 & 2032
- Table 52: ASEAN Food Colorant Industry in South Africa Revenue (Million) Forecast, by Application 2019 & 2032
- Table 53: Oceania Food Colorant Industry in South Africa Revenue (Million) Forecast, by Application 2019 & 2032
- Table 54: Rest of Asia Pacific Food Colorant Industry in South Africa Revenue (Million) Forecast, by Application 2019 & 2032
Frequently Asked Questions
1. What is the projected Compound Annual Growth Rate (CAGR) of the Food Colorant Industry in South Africa?
The projected CAGR is approximately 4.60%.
2. Which companies are prominent players in the Food Colorant Industry in South Africa?
Key companies in the market include Nicola J Flavors & Fragrances, Chemical Services Ltd (Lake Foods), Sensient Technologies, Chr Hansen holdings A/S, BASF SE, Quantum Colors S, EDCOL.
3. What are the main segments of the Food Colorant Industry in South Africa?
The market segments include Product Type, Application.
4. Can you provide details about the market size?
The market size is estimated to be USD XX Million as of 2022.
5. What are some drivers contributing to market growth?
Rising Health Consciousness among consumer.
6. What are the notable trends driving market growth?
Growing Emergence of Natural Color.
7. Are there any restraints impacting market growth?
High Cost of natural Ingredients.
8. Can you provide examples of recent developments in the market?
N/A
9. What pricing options are available for accessing the report?
Pricing options include single-user, multi-user, and enterprise licenses priced at USD 3800, USD 4500, and USD 5800 respectively.
10. Is the market size provided in terms of value or volume?
The market size is provided in terms of value, measured in Million.
11. Are there any specific market keywords associated with the report?
Yes, the market keyword associated with the report is "Food Colorant Industry in South Africa," which aids in identifying and referencing the specific market segment covered.
12. How do I determine which pricing option suits my needs best?
The pricing options vary based on user requirements and access needs. Individual users may opt for single-user licenses, while businesses requiring broader access may choose multi-user or enterprise licenses for cost-effective access to the report.
13. Are there any additional resources or data provided in the Food Colorant Industry in South Africa report?
While the report offers comprehensive insights, it's advisable to review the specific contents or supplementary materials provided to ascertain if additional resources or data are available.
14. How can I stay updated on further developments or reports in the Food Colorant Industry in South Africa?
To stay informed about further developments, trends, and reports in the Food Colorant Industry in South Africa, consider subscribing to industry newsletters, following relevant companies and organizations, or regularly checking reputable industry news sources and publications.
Methodology
Step 1 - Identification of Relevant Samples Size from Population Database


Step 2 - Approaches for Defining Global Market Size (Value, Volume* & Price*)

Note*: In applicable scenarios
Step 3 - Data Sources
Primary Research
- Web Analytics
- Survey Reports
- Research Institute
- Latest Research Reports
- Opinion Leaders
Secondary Research
- Annual Reports
- White Paper
- Latest Press Release
- Industry Association
- Paid Database
- Investor Presentations

Step 4 - Data Triangulation
Involves using different sources of information in order to increase the validity of a study
These sources are likely to be stakeholders in a program - participants, other researchers, program staff, other community members, and so on.
Then we put all data in single framework & apply various statistical tools to find out the dynamic on the market.
During the analysis stage, feedback from the stakeholder groups would be compared to determine areas of agreement as well as areas of divergence
