

Key Insights
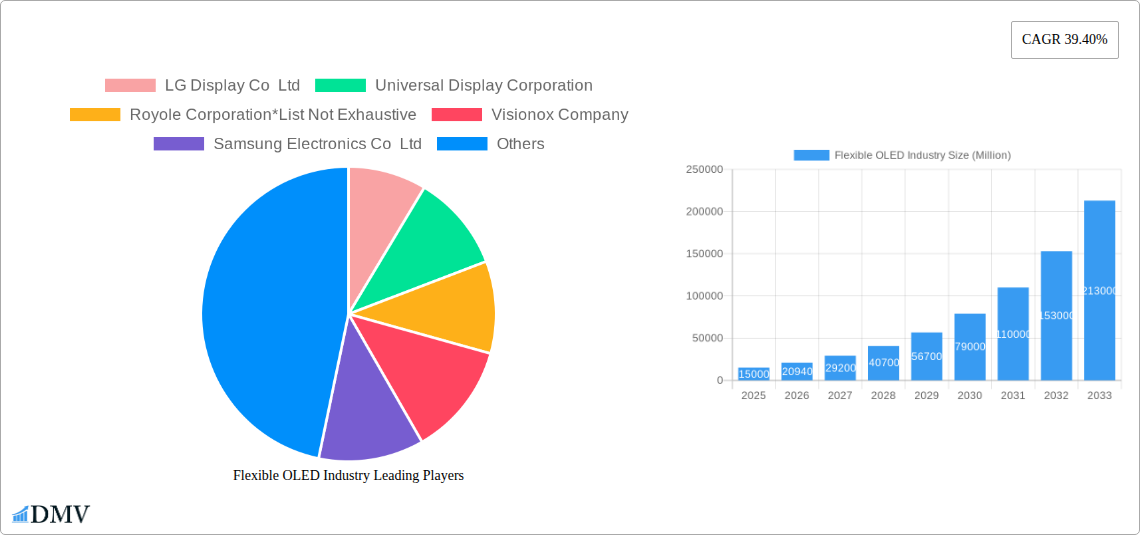
The flexible OLED (Organic Light-Emitting Diode) industry is experiencing explosive growth, driven by the increasing demand for foldable smartphones, flexible displays in wearables, and curved screens in televisions and monitors. A 39.40% Compound Annual Growth Rate (CAGR) from 2019 to 2024 signifies a robust market expansion, indicating significant investor interest and technological advancements. The market segmentation reveals AMOLED and PMOLED technologies as primary drivers, with mobile and tablet applications currently dominating market share. However, the burgeoning wearables sector and the potential for flexible displays in other applications, such as automotive and medical devices, present significant future growth opportunities. Major players like Samsung, LG, and BOE Technology are heavily investing in research and development, leading to innovations in flexible display technology that enhance picture quality, durability, and energy efficiency. This competition fuels market expansion and pushes boundaries in design and functionality. While supply chain constraints and the relatively high manufacturing cost of flexible OLEDs currently pose some restraints, the long-term outlook remains overwhelmingly positive. The continuous improvement in manufacturing processes and economies of scale are expected to alleviate these limitations, further accelerating market penetration.
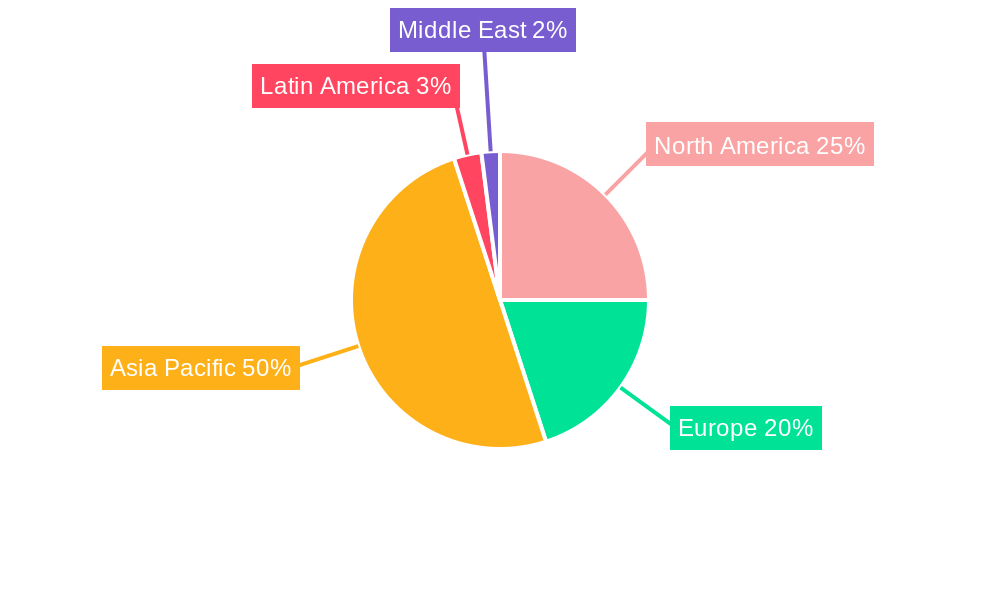
The Asia-Pacific region is anticipated to hold a dominant market share, primarily fueled by the large consumer base and extensive manufacturing capabilities within the region. North America and Europe will also witness considerable growth, primarily driven by increasing consumer spending on premium electronics and the adoption of advanced display technologies. The forecast period of 2025-2033 promises further consolidation as leading companies strategically expand their production capacities and diversify their product portfolios to meet the growing demand from various applications. This dynamic market landscape will continue to reward innovative companies capable of adapting to evolving consumer preferences and technological advancements, shaping the future of flexible display technology.
Flexible OLED Industry: Market Analysis & Forecast 2019-2033
This comprehensive report provides a detailed analysis of the Flexible OLED industry, encompassing market size, trends, key players, and future projections. The study period covers 2019-2033, with a base year of 2025 and a forecast period of 2025-2033. We delve into the market's composition, technological advancements, leading players, and significant industry developments, offering valuable insights for stakeholders across the value chain. The report projects a market value of XXX Million by 2033, driven by increasing demand across diverse applications.
Flexible OLED Industry Market Composition & Trends
This section evaluates the flexible OLED market's competitive landscape, innovation drivers, regulatory factors, and market dynamics. We analyze market concentration, revealing the market share distribution among key players like LG Display Co Ltd, Samsung Electronics Co Ltd, BOE Technology UK Limited, and others. The report also explores the impact of mergers and acquisitions (M&A) activities, including deal values (in Millions), on market consolidation and technological advancements. Innovation catalysts such as advancements in AMOLED and PMOLED technologies are assessed, along with the influence of substitute products and evolving end-user profiles. The regulatory landscape, including regional variations and their influence on market growth, is also analyzed.
- Market Share Distribution (2024): LG Display Co Ltd (xx%), Samsung Electronics Co Ltd (xx%), BOE Technology UK Limited (xx%), Others (xx%).
- M&A Activity (2019-2024): Total deal value estimated at XXX Million, with notable transactions including [Specific examples if available, otherwise "Data not publicly available"].
Flexible OLED Industry Industry Evolution
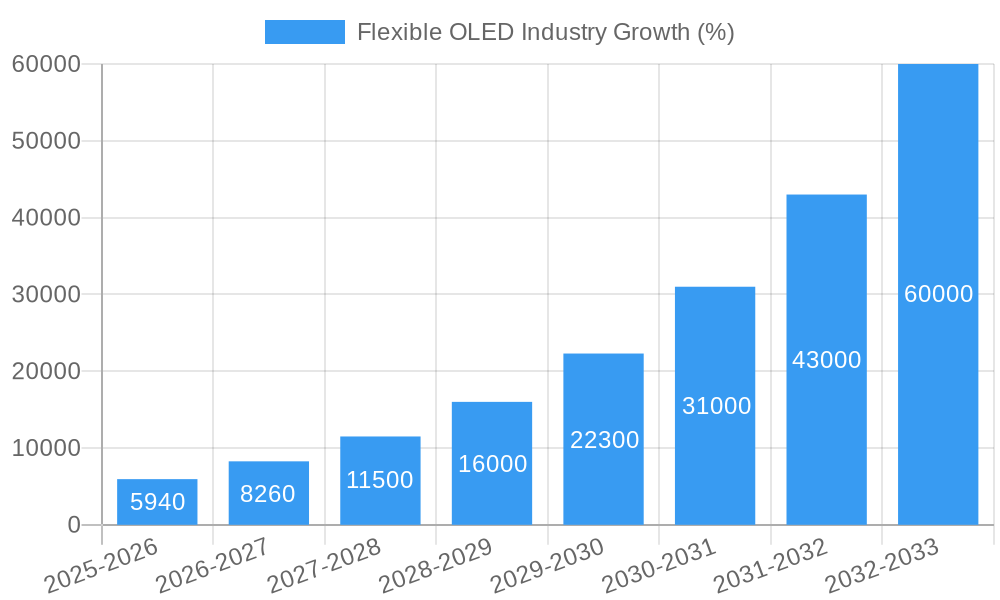
This section examines the flexible OLED industry's growth trajectory from 2019 to 2033. We analyze historical growth rates (2019-2024) and project future growth (2025-2033), considering factors such as technological advancements (e.g., improvements in resolution, flexibility, and power efficiency), shifting consumer demands (e.g., preference for foldable smartphones and larger, higher-resolution displays), and the increasing adoption of flexible OLED displays across various applications. The impact of the COVID-19 pandemic on supply chains and market dynamics is also considered. Growth is expected to be driven primarily by the expansion of the mobile and wearable device markets, along with the adoption of flexible OLED displays in new applications like automotive and healthcare. We project a Compound Annual Growth Rate (CAGR) of xx% during the forecast period.
Leading Regions, Countries, or Segments in Flexible OLED Industry
This section identifies the dominant regions, countries, and segments within the flexible OLED industry. We analyze market performance across different segments (By Technology: AMOLED, PMOLED; By Application: Mobiles and Tablets, Monitors and TVs, Wearables, Other Applications) and geographic regions.
Key Drivers:
- AMOLED Technology: High market share due to superior image quality, power efficiency, and flexibility.
- Mobiles and Tablets: Largest application segment driven by high demand for foldable devices and premium smartphones.
- Asia Pacific: Dominant region fueled by strong manufacturing capabilities and high consumer demand.
Dominance Factors:
The Asia-Pacific region leads in both manufacturing and consumption, driven by significant investments in flexible OLED production facilities and a large consumer base. The strong presence of major players like Samsung and LG in this region contributes significantly to its dominance. AMOLED technology maintains a dominant market share due to its superior features, while the mobile and tablet segment continues to be the leading application area, bolstered by the growing popularity of foldable devices.
Flexible OLED Industry Product Innovations
Recent innovations in flexible OLED technology include advancements in material science, resulting in increased flexibility, durability, and improved color accuracy. Higher resolutions, improved brightness, and thinner display profiles are other key areas of development. The introduction of 1Hz low-power AMOLED displays by companies like Visionox signifies advancements in power efficiency and battery life, a crucial factor for mobile and wearable applications. These innovations are expected to drive further adoption across diverse market segments, enhancing the user experience and opening up new opportunities in several industry verticals.
Propelling Factors for Flexible OLED Industry Growth
The flexible OLED market's growth is fueled by several factors: Technological advancements leading to improved display quality, flexibility, and power efficiency; increasing demand for foldable smartphones, wearables, and high-resolution displays; rising investments in flexible OLED manufacturing facilities; and government support for the development and adoption of advanced display technologies. The ongoing miniaturization of electronics and the expansion into new applications, such as automotive displays and advanced medical equipment, are also significant drivers.
Obstacles in the Flexible OLED Industry Market
Challenges facing the industry include high manufacturing costs, the complexity of the production process, and competition from other display technologies like LCD and MicroLED. Supply chain disruptions, particularly in securing crucial raw materials, also represent a significant risk. Regulatory uncertainties and variations in environmental regulations across different regions could impose additional obstacles for manufacturers and distributors.
Future Opportunities in Flexible OLED Industry
Future opportunities lie in expanding into new applications, including automotive displays, augmented and virtual reality devices, and large-format displays for commercial use. Further technological advancements, such as the development of transparent and stretchable OLED displays, present exciting potential for growth. The rising adoption of foldable devices and the continued miniaturization of electronics are also expected to create significant demand in the years to come.
Major Players in the Flexible OLED Industry Ecosystem
- LG Display Co Ltd (LG Display)
- Universal Display Corporation (Universal Display)
- Royole Corporation
- Visionox Company
- Samsung Electronics Co Ltd (Samsung)
- BOE Technology UK Limited (BOE)
- Ritdisplay Corporation
- AUO Corporation (AUO)
- WiseChip Semiconductor Inc
Key Developments in Flexible OLED Industry Industry
- June 2022: LG Display launches upgraded G2 and C2 OLED TVs, featuring enhanced brightness, clarity, and new screen sizes, expanding market reach with advanced OLED solutions.
- February 2022: Visionox releases China's first 1Hz low-power AMOLED display, utilizing Hybrid-TFT technology for significant power consumption reduction and dynamic refresh rates (1-120Hz).
Strategic Flexible OLED Industry Market Forecast
The flexible OLED market is poised for substantial growth, driven by technological advancements, increasing consumer demand for high-quality displays, and expansion into new application areas. The market is expected to experience robust expansion in the coming years, with significant growth opportunities in emerging economies and across diverse applications, making it an attractive sector for investment and innovation. The continued focus on improving efficiency and reducing production costs will be key to unlocking even greater market potential.
Flexible OLED Industry Segmentation
-
1. Technology
- 1.1. AMOLED
- 1.2. PMOLED
-
2. Application
- 2.1. Mobiles and Tablets
- 2.2. Monitors and TVs
- 2.3. Wearables
- 2.4. Other Applications
Flexible OLED Industry Segmentation By Geography
- 1. North America
- 2. Europe
- 3. Asia Pacific
- 4. Latin America
- 5. Middle East
Flexible OLED Industry REPORT HIGHLIGHTS
| Aspects | Details |
|---|---|
| Study Period | 2019-2033 |
| Base Year | 2024 |
| Estimated Year | 2025 |
| Forecast Period | 2025-2033 |
| Historical Period | 2019-2024 |
| Growth Rate | CAGR of 39.40% from 2019-2033 |
| Segmentation |
|
Table of Contents
- 1. Introduction
- 1.1. Research Scope
- 1.2. Market Segmentation
- 1.3. Research Methodology
- 1.4. Definitions and Assumptions
- 2. Executive Summary
- 2.1. Introduction
- 3. Market Dynamics
- 3.1. Introduction
- 3.2. Market Drivers
- 3.2.1. Increasing Demand for OLED in Smartphone Panels; Technological Advancements in Display Market
- 3.3. Market Restrains
- 3.3.1. ; Competition with Existing Display Technologies
- 3.4. Market Trends
- 3.4.1. Mobiles and Televisions to Witness Significant Growth
- 4. Market Factor Analysis
- 4.1. Porters Five Forces
- 4.2. Supply/Value Chain
- 4.3. PESTEL analysis
- 4.4. Market Entropy
- 4.5. Patent/Trademark Analysis
- 5. Global Flexible OLED Industry Analysis, Insights and Forecast, 2019-2031
- 5.1. Market Analysis, Insights and Forecast - by Technology
- 5.1.1. AMOLED
- 5.1.2. PMOLED
- 5.2. Market Analysis, Insights and Forecast - by Application
- 5.2.1. Mobiles and Tablets
- 5.2.2. Monitors and TVs
- 5.2.3. Wearables
- 5.2.4. Other Applications
- 5.3. Market Analysis, Insights and Forecast - by Region
- 5.3.1. North America
- 5.3.2. Europe
- 5.3.3. Asia Pacific
- 5.3.4. Latin America
- 5.3.5. Middle East
- 5.1. Market Analysis, Insights and Forecast - by Technology
- 6. North America Flexible OLED Industry Analysis, Insights and Forecast, 2019-2031
- 6.1. Market Analysis, Insights and Forecast - by Technology
- 6.1.1. AMOLED
- 6.1.2. PMOLED
- 6.2. Market Analysis, Insights and Forecast - by Application
- 6.2.1. Mobiles and Tablets
- 6.2.2. Monitors and TVs
- 6.2.3. Wearables
- 6.2.4. Other Applications
- 6.1. Market Analysis, Insights and Forecast - by Technology
- 7. Europe Flexible OLED Industry Analysis, Insights and Forecast, 2019-2031
- 7.1. Market Analysis, Insights and Forecast - by Technology
- 7.1.1. AMOLED
- 7.1.2. PMOLED
- 7.2. Market Analysis, Insights and Forecast - by Application
- 7.2.1. Mobiles and Tablets
- 7.2.2. Monitors and TVs
- 7.2.3. Wearables
- 7.2.4. Other Applications
- 7.1. Market Analysis, Insights and Forecast - by Technology
- 8. Asia Pacific Flexible OLED Industry Analysis, Insights and Forecast, 2019-2031
- 8.1. Market Analysis, Insights and Forecast - by Technology
- 8.1.1. AMOLED
- 8.1.2. PMOLED
- 8.2. Market Analysis, Insights and Forecast - by Application
- 8.2.1. Mobiles and Tablets
- 8.2.2. Monitors and TVs
- 8.2.3. Wearables
- 8.2.4. Other Applications
- 8.1. Market Analysis, Insights and Forecast - by Technology
- 9. Latin America Flexible OLED Industry Analysis, Insights and Forecast, 2019-2031
- 9.1. Market Analysis, Insights and Forecast - by Technology
- 9.1.1. AMOLED
- 9.1.2. PMOLED
- 9.2. Market Analysis, Insights and Forecast - by Application
- 9.2.1. Mobiles and Tablets
- 9.2.2. Monitors and TVs
- 9.2.3. Wearables
- 9.2.4. Other Applications
- 9.1. Market Analysis, Insights and Forecast - by Technology
- 10. Middle East Flexible OLED Industry Analysis, Insights and Forecast, 2019-2031
- 10.1. Market Analysis, Insights and Forecast - by Technology
- 10.1.1. AMOLED
- 10.1.2. PMOLED
- 10.2. Market Analysis, Insights and Forecast - by Application
- 10.2.1. Mobiles and Tablets
- 10.2.2. Monitors and TVs
- 10.2.3. Wearables
- 10.2.4. Other Applications
- 10.1. Market Analysis, Insights and Forecast - by Technology
- 11. North America Flexible OLED Industry Analysis, Insights and Forecast, 2019-2031
- 11.1. Market Analysis, Insights and Forecast - By Country/Sub-region
- 11.1.1.
- 12. Europe Flexible OLED Industry Analysis, Insights and Forecast, 2019-2031
- 12.1. Market Analysis, Insights and Forecast - By Country/Sub-region
- 12.1.1.
- 13. Asia Pacific Flexible OLED Industry Analysis, Insights and Forecast, 2019-2031
- 13.1. Market Analysis, Insights and Forecast - By Country/Sub-region
- 13.1.1.
- 14. Latin America Flexible OLED Industry Analysis, Insights and Forecast, 2019-2031
- 14.1. Market Analysis, Insights and Forecast - By Country/Sub-region
- 14.1.1.
- 15. Middle East Flexible OLED Industry Analysis, Insights and Forecast, 2019-2031
- 15.1. Market Analysis, Insights and Forecast - By Country/Sub-region
- 15.1.1.
- 16. Competitive Analysis
- 16.1. Global Market Share Analysis 2024
- 16.2. Company Profiles
- 16.2.1 LG Display Co Ltd
- 16.2.1.1. Overview
- 16.2.1.2. Products
- 16.2.1.3. SWOT Analysis
- 16.2.1.4. Recent Developments
- 16.2.1.5. Financials (Based on Availability)
- 16.2.2 Universal Display Corporation
- 16.2.2.1. Overview
- 16.2.2.2. Products
- 16.2.2.3. SWOT Analysis
- 16.2.2.4. Recent Developments
- 16.2.2.5. Financials (Based on Availability)
- 16.2.3 Royole Corporation*List Not Exhaustive
- 16.2.3.1. Overview
- 16.2.3.2. Products
- 16.2.3.3. SWOT Analysis
- 16.2.3.4. Recent Developments
- 16.2.3.5. Financials (Based on Availability)
- 16.2.4 Visionox Company
- 16.2.4.1. Overview
- 16.2.4.2. Products
- 16.2.4.3. SWOT Analysis
- 16.2.4.4. Recent Developments
- 16.2.4.5. Financials (Based on Availability)
- 16.2.5 Samsung Electronics Co Ltd
- 16.2.5.1. Overview
- 16.2.5.2. Products
- 16.2.5.3. SWOT Analysis
- 16.2.5.4. Recent Developments
- 16.2.5.5. Financials (Based on Availability)
- 16.2.6 BOE Technology UK Limited
- 16.2.6.1. Overview
- 16.2.6.2. Products
- 16.2.6.3. SWOT Analysis
- 16.2.6.4. Recent Developments
- 16.2.6.5. Financials (Based on Availability)
- 16.2.7 Ritdisplay Corporation
- 16.2.7.1. Overview
- 16.2.7.2. Products
- 16.2.7.3. SWOT Analysis
- 16.2.7.4. Recent Developments
- 16.2.7.5. Financials (Based on Availability)
- 16.2.8 AUO Corporation
- 16.2.8.1. Overview
- 16.2.8.2. Products
- 16.2.8.3. SWOT Analysis
- 16.2.8.4. Recent Developments
- 16.2.8.5. Financials (Based on Availability)
- 16.2.9 WiseChip Semiconductor Inc
- 16.2.9.1. Overview
- 16.2.9.2. Products
- 16.2.9.3. SWOT Analysis
- 16.2.9.4. Recent Developments
- 16.2.9.5. Financials (Based on Availability)
- 16.2.1 LG Display Co Ltd
List of Figures
- Figure 1: Global Flexible OLED Industry Revenue Breakdown (Million, %) by Region 2024 & 2032
- Figure 2: North America Flexible OLED Industry Revenue (Million), by Country 2024 & 2032
- Figure 3: North America Flexible OLED Industry Revenue Share (%), by Country 2024 & 2032
- Figure 4: Europe Flexible OLED Industry Revenue (Million), by Country 2024 & 2032
- Figure 5: Europe Flexible OLED Industry Revenue Share (%), by Country 2024 & 2032
- Figure 6: Asia Pacific Flexible OLED Industry Revenue (Million), by Country 2024 & 2032
- Figure 7: Asia Pacific Flexible OLED Industry Revenue Share (%), by Country 2024 & 2032
- Figure 8: Latin America Flexible OLED Industry Revenue (Million), by Country 2024 & 2032
- Figure 9: Latin America Flexible OLED Industry Revenue Share (%), by Country 2024 & 2032
- Figure 10: Middle East Flexible OLED Industry Revenue (Million), by Country 2024 & 2032
- Figure 11: Middle East Flexible OLED Industry Revenue Share (%), by Country 2024 & 2032
- Figure 12: North America Flexible OLED Industry Revenue (Million), by Technology 2024 & 2032
- Figure 13: North America Flexible OLED Industry Revenue Share (%), by Technology 2024 & 2032
- Figure 14: North America Flexible OLED Industry Revenue (Million), by Application 2024 & 2032
- Figure 15: North America Flexible OLED Industry Revenue Share (%), by Application 2024 & 2032
- Figure 16: North America Flexible OLED Industry Revenue (Million), by Country 2024 & 2032
- Figure 17: North America Flexible OLED Industry Revenue Share (%), by Country 2024 & 2032
- Figure 18: Europe Flexible OLED Industry Revenue (Million), by Technology 2024 & 2032
- Figure 19: Europe Flexible OLED Industry Revenue Share (%), by Technology 2024 & 2032
- Figure 20: Europe Flexible OLED Industry Revenue (Million), by Application 2024 & 2032
- Figure 21: Europe Flexible OLED Industry Revenue Share (%), by Application 2024 & 2032
- Figure 22: Europe Flexible OLED Industry Revenue (Million), by Country 2024 & 2032
- Figure 23: Europe Flexible OLED Industry Revenue Share (%), by Country 2024 & 2032
- Figure 24: Asia Pacific Flexible OLED Industry Revenue (Million), by Technology 2024 & 2032
- Figure 25: Asia Pacific Flexible OLED Industry Revenue Share (%), by Technology 2024 & 2032
- Figure 26: Asia Pacific Flexible OLED Industry Revenue (Million), by Application 2024 & 2032
- Figure 27: Asia Pacific Flexible OLED Industry Revenue Share (%), by Application 2024 & 2032
- Figure 28: Asia Pacific Flexible OLED Industry Revenue (Million), by Country 2024 & 2032
- Figure 29: Asia Pacific Flexible OLED Industry Revenue Share (%), by Country 2024 & 2032
- Figure 30: Latin America Flexible OLED Industry Revenue (Million), by Technology 2024 & 2032
- Figure 31: Latin America Flexible OLED Industry Revenue Share (%), by Technology 2024 & 2032
- Figure 32: Latin America Flexible OLED Industry Revenue (Million), by Application 2024 & 2032
- Figure 33: Latin America Flexible OLED Industry Revenue Share (%), by Application 2024 & 2032
- Figure 34: Latin America Flexible OLED Industry Revenue (Million), by Country 2024 & 2032
- Figure 35: Latin America Flexible OLED Industry Revenue Share (%), by Country 2024 & 2032
- Figure 36: Middle East Flexible OLED Industry Revenue (Million), by Technology 2024 & 2032
- Figure 37: Middle East Flexible OLED Industry Revenue Share (%), by Technology 2024 & 2032
- Figure 38: Middle East Flexible OLED Industry Revenue (Million), by Application 2024 & 2032
- Figure 39: Middle East Flexible OLED Industry Revenue Share (%), by Application 2024 & 2032
- Figure 40: Middle East Flexible OLED Industry Revenue (Million), by Country 2024 & 2032
- Figure 41: Middle East Flexible OLED Industry Revenue Share (%), by Country 2024 & 2032
List of Tables
- Table 1: Global Flexible OLED Industry Revenue Million Forecast, by Region 2019 & 2032
- Table 2: Global Flexible OLED Industry Revenue Million Forecast, by Technology 2019 & 2032
- Table 3: Global Flexible OLED Industry Revenue Million Forecast, by Application 2019 & 2032
- Table 4: Global Flexible OLED Industry Revenue Million Forecast, by Region 2019 & 2032
- Table 5: Global Flexible OLED Industry Revenue Million Forecast, by Country 2019 & 2032
- Table 6: Flexible OLED Industry Revenue (Million) Forecast, by Application 2019 & 2032
- Table 7: Global Flexible OLED Industry Revenue Million Forecast, by Country 2019 & 2032
- Table 8: Flexible OLED Industry Revenue (Million) Forecast, by Application 2019 & 2032
- Table 9: Global Flexible OLED Industry Revenue Million Forecast, by Country 2019 & 2032
- Table 10: Flexible OLED Industry Revenue (Million) Forecast, by Application 2019 & 2032
- Table 11: Global Flexible OLED Industry Revenue Million Forecast, by Country 2019 & 2032
- Table 12: Flexible OLED Industry Revenue (Million) Forecast, by Application 2019 & 2032
- Table 13: Global Flexible OLED Industry Revenue Million Forecast, by Country 2019 & 2032
- Table 14: Flexible OLED Industry Revenue (Million) Forecast, by Application 2019 & 2032
- Table 15: Global Flexible OLED Industry Revenue Million Forecast, by Technology 2019 & 2032
- Table 16: Global Flexible OLED Industry Revenue Million Forecast, by Application 2019 & 2032
- Table 17: Global Flexible OLED Industry Revenue Million Forecast, by Country 2019 & 2032
- Table 18: Global Flexible OLED Industry Revenue Million Forecast, by Technology 2019 & 2032
- Table 19: Global Flexible OLED Industry Revenue Million Forecast, by Application 2019 & 2032
- Table 20: Global Flexible OLED Industry Revenue Million Forecast, by Country 2019 & 2032
- Table 21: Global Flexible OLED Industry Revenue Million Forecast, by Technology 2019 & 2032
- Table 22: Global Flexible OLED Industry Revenue Million Forecast, by Application 2019 & 2032
- Table 23: Global Flexible OLED Industry Revenue Million Forecast, by Country 2019 & 2032
- Table 24: Global Flexible OLED Industry Revenue Million Forecast, by Technology 2019 & 2032
- Table 25: Global Flexible OLED Industry Revenue Million Forecast, by Application 2019 & 2032
- Table 26: Global Flexible OLED Industry Revenue Million Forecast, by Country 2019 & 2032
- Table 27: Global Flexible OLED Industry Revenue Million Forecast, by Technology 2019 & 2032
- Table 28: Global Flexible OLED Industry Revenue Million Forecast, by Application 2019 & 2032
- Table 29: Global Flexible OLED Industry Revenue Million Forecast, by Country 2019 & 2032
Frequently Asked Questions
1. What is the projected Compound Annual Growth Rate (CAGR) of the Flexible OLED Industry?
The projected CAGR is approximately 39.40%.
2. Which companies are prominent players in the Flexible OLED Industry?
Key companies in the market include LG Display Co Ltd, Universal Display Corporation, Royole Corporation*List Not Exhaustive, Visionox Company, Samsung Electronics Co Ltd, BOE Technology UK Limited, Ritdisplay Corporation, AUO Corporation, WiseChip Semiconductor Inc.
3. What are the main segments of the Flexible OLED Industry?
The market segments include Technology, Application.
4. Can you provide details about the market size?
The market size is estimated to be USD XX Million as of 2022.
5. What are some drivers contributing to market growth?
Increasing Demand for OLED in Smartphone Panels; Technological Advancements in Display Market.
6. What are the notable trends driving market growth?
Mobiles and Televisions to Witness Significant Growth.
7. Are there any restraints impacting market growth?
; Competition with Existing Display Technologies.
8. Can you provide examples of recent developments in the market?
June 2022 - LG Display creates new markets with cutting-edge OLED solutions. The company launched upgraded versions of G2& C2 televisions. Both versions are making use of upgraded OLED technology to create even better visuals. This technology enables the displays to deliver higher brightness with greater clarity and detail. The new sizes of the G2 series are introduced alongside three other sizes (55", 65", and 77"). The C2 series gets a total of 6 display sizes.
9. What pricing options are available for accessing the report?
Pricing options include single-user, multi-user, and enterprise licenses priced at USD 4750, USD 5250, and USD 8750 respectively.
10. Is the market size provided in terms of value or volume?
The market size is provided in terms of value, measured in Million.
11. Are there any specific market keywords associated with the report?
Yes, the market keyword associated with the report is "Flexible OLED Industry," which aids in identifying and referencing the specific market segment covered.
12. How do I determine which pricing option suits my needs best?
The pricing options vary based on user requirements and access needs. Individual users may opt for single-user licenses, while businesses requiring broader access may choose multi-user or enterprise licenses for cost-effective access to the report.
13. Are there any additional resources or data provided in the Flexible OLED Industry report?
While the report offers comprehensive insights, it's advisable to review the specific contents or supplementary materials provided to ascertain if additional resources or data are available.
14. How can I stay updated on further developments or reports in the Flexible OLED Industry?
To stay informed about further developments, trends, and reports in the Flexible OLED Industry, consider subscribing to industry newsletters, following relevant companies and organizations, or regularly checking reputable industry news sources and publications.
Methodology
Step 1 - Identification of Relevant Samples Size from Population Database


Step 2 - Approaches for Defining Global Market Size (Value, Volume* & Price*)

Note*: In applicable scenarios
Step 3 - Data Sources
Primary Research
- Web Analytics
- Survey Reports
- Research Institute
- Latest Research Reports
- Opinion Leaders
Secondary Research
- Annual Reports
- White Paper
- Latest Press Release
- Industry Association
- Paid Database
- Investor Presentations

Step 4 - Data Triangulation
Involves using different sources of information in order to increase the validity of a study
These sources are likely to be stakeholders in a program - participants, other researchers, program staff, other community members, and so on.
Then we put all data in single framework & apply various statistical tools to find out the dynamic on the market.
During the analysis stage, feedback from the stakeholder groups would be compared to determine areas of agreement as well as areas of divergence
