

Key Insights
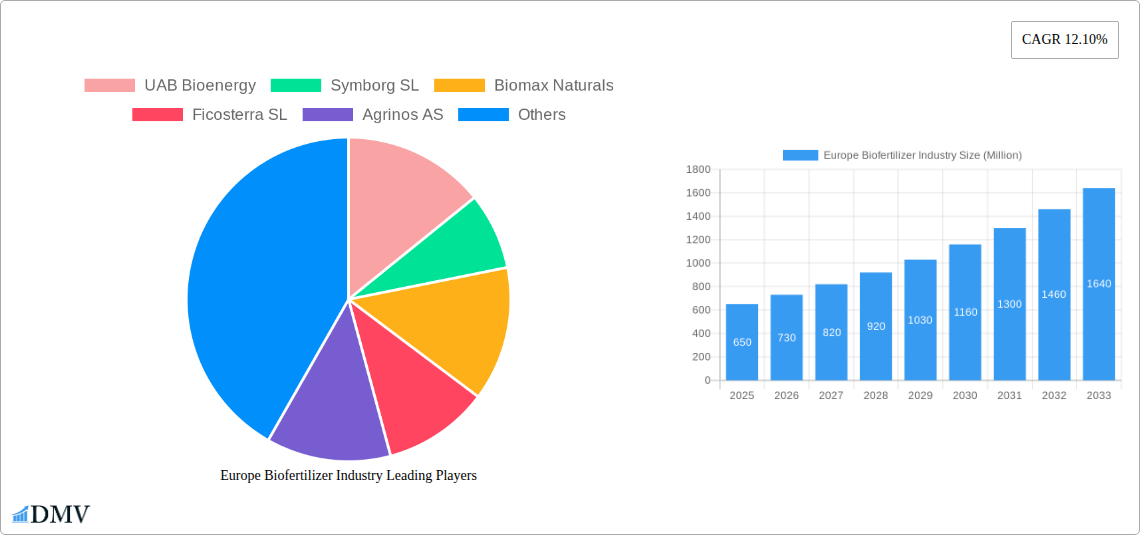
The European biofertilizer market, valued at €650 million in 2025, is projected to experience robust growth, exhibiting a Compound Annual Growth Rate (CAGR) of 12.10% from 2025 to 2033. This expansion is driven by several key factors. Increasing awareness of the environmental impacts of synthetic fertilizers, coupled with the growing demand for sustainable and organic agricultural practices across Europe, is fueling the adoption of biofertilizers. Stringent regulations aimed at reducing chemical fertilizer usage further bolster this trend. The market is segmented by application (soil treatment dominating), crop type (grains and cereals holding a significant share), technology (carrier-enriched and liquid biofertilizers leading), and microorganism type (Rhizobium, Azospirillum, and Phosphate Solubilizing Bacteria being prominent). Germany, France, and the United Kingdom represent the largest national markets within Europe, benefiting from established agricultural sectors and supportive government policies promoting sustainable farming. However, the high initial investment costs associated with biofertilizer adoption and the sometimes inconsistent efficacy compared to synthetic fertilizers represent potential restraints to market growth. Further research and development focusing on enhancing biofertilizer performance and reducing production costs are crucial for unlocking the market's full potential.
The competitive landscape is characterized by a mix of established players and emerging companies. Key players like UAB Bioenergy, Symborg SL, Biomax Naturals, and others are focusing on innovation, strategic partnerships, and expanding their product portfolios to cater to diverse agricultural needs. The future growth trajectory hinges on overcoming the challenges related to standardization, quality control, and farmer education. Successful market penetration requires targeted marketing efforts to educate farmers on the benefits of biofertilizers and provide technical support for their optimal application. Continued government support through subsidies and incentives will also play a significant role in driving market adoption and realizing the full potential of this sustainable agricultural solution within the European context. Future projections suggest that market segmentation will become more nuanced, driven by crop-specific formulations and advancements in biofertilizer technologies.
This comprehensive report provides an in-depth analysis of the Europe biofertilizer industry, covering market size, growth drivers, challenges, and future opportunities. With a study period spanning 2019-2033, a base year of 2025, and a forecast period of 2025-2033, this report is an essential resource for stakeholders seeking to understand and navigate this dynamic market. The report leverages extensive primary and secondary research, encompassing detailed analysis across various segments, including application, crop type, technology, and microorganisms.
Europe Biofertilizer Industry Market Composition & Trends
The European biofertilizer market, valued at xx Million in 2024, is projected to reach xx Million by 2033, exhibiting a CAGR of xx%. Market concentration is moderate, with several key players holding significant shares, but a fragmented landscape also exists among smaller, specialized firms. Innovation is driven by the increasing demand for sustainable agricultural practices and stricter regulations on chemical fertilizers. The regulatory landscape varies across European countries, influencing adoption rates and product development. Substitute products include conventional chemical fertilizers, but biofertilizers offer advantages in terms of environmental sustainability and long-term soil health. End-users primarily comprise farmers across various crop types. M&A activities have been relatively modest in recent years, with deal values averaging xx Million per transaction (2019-2024).
- Market Share Distribution (2024): Symborg SL (xx%), Agrinos AS (xx%), UAB Bioenergy (xx%), others (xx%).
- M&A Activity (2019-2024): Total deal value approximately xx Million.
Europe Biofertilizer Industry Industry Evolution
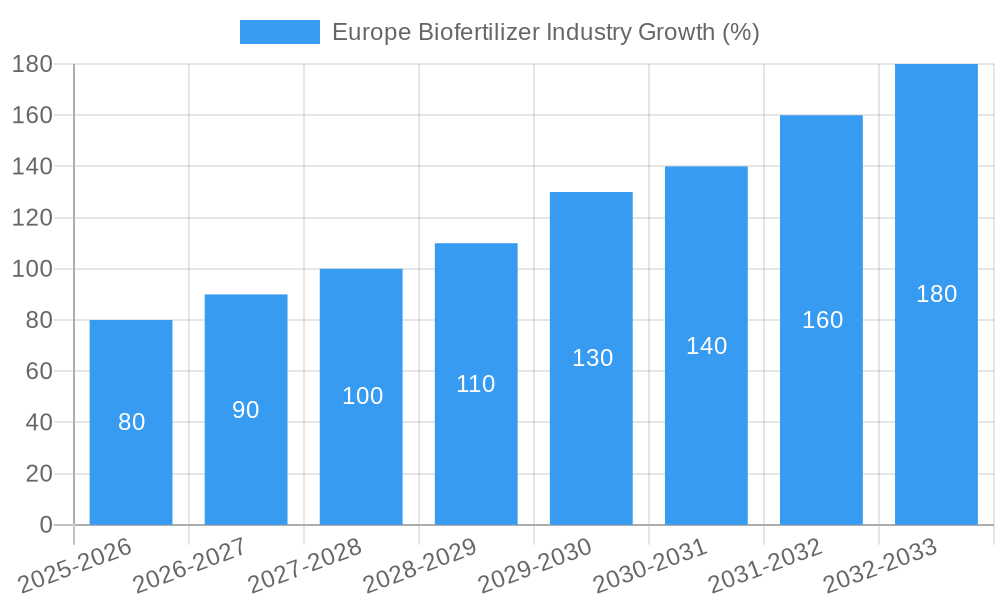
The European biofertilizer market has experienced significant growth driven by increasing consumer awareness of sustainable agriculture and stricter environmental regulations limiting chemical fertilizer use. Technological advancements in biofertilizer production, such as enhanced carrier systems and improved formulation techniques, are fueling market expansion. Growing consumer demand for organic and sustainably produced food is creating a positive market environment for biofertilizers. The historical period (2019-2024) saw a CAGR of approximately xx%, primarily driven by increasing awareness of the benefits of biofertilizers and government support for sustainable agriculture. The forecast period (2025-2033) is expected to see continued growth, driven by ongoing technological advancements and increasing consumer demand, with projected CAGRs in the range of xx%. Adoption metrics indicate strong growth in specific segments, particularly in soil treatment and the use of liquid biofertilizers.
Leading Regions, Countries, or Segments in Europe Biofertilizer Industry
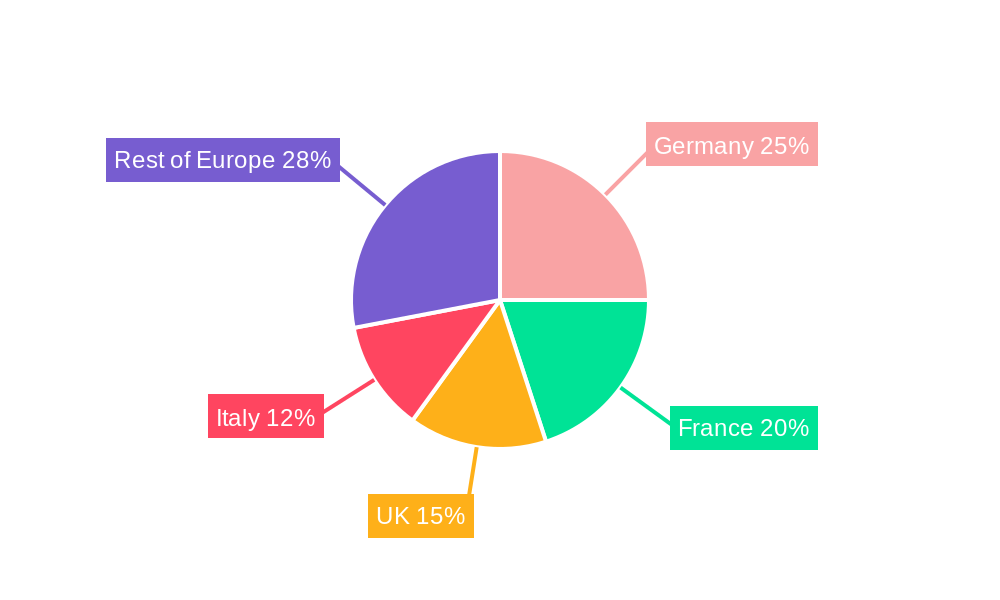
Western Europe (specifically Germany, France, and Spain) currently dominates the market due to:
- High Agricultural Output: These countries have significant agricultural sectors and a high demand for agricultural inputs.
- Strong Regulatory Support: Supportive government policies and incentives for sustainable agriculture are promoting biofertilizer adoption.
- High Consumer Demand: Growing consumer preference for organic and sustainably produced food drives demand for biofertilizers.
Dominant Segments:
- Application: Soil treatment holds the largest market share, owing to its established role in improving soil health.
- Crop Type: Grains and cereals represent the largest application segment due to extensive acreage and relatively high profitability.
- Technology: Liquid biofertilizers are gaining popularity due to their ease of application and consistent formulation.
- Microorganism: Rhizobium and Phosphate Solubilizing Bacteria are widely used due to their established efficacy in improving nutrient uptake.
Europe Biofertilizer Industry Product Innovations
Recent innovations include the development of carrier-enriched biofertilizers that improve storage stability and application efficiency. Improved formulations targeting specific crops and soil types are enhancing performance. Focus on specific microbial consortia offering synergistic effects is delivering superior results. Unique selling propositions emphasize enhanced nutrient uptake, improved crop yield, and reduced environmental impact compared to chemical fertilizers.
Propelling Factors for Europe Biofertilizer Industry Growth
Several factors fuel market growth:
- Growing Consumer Demand for Sustainable Agriculture: The rising preference for organically produced food boosts the demand for biofertilizers.
- Stringent Environmental Regulations: Restrictions on chemical fertilizers are driving a shift towards eco-friendly alternatives.
- Government Support and Incentives: Subsidies and programs supporting sustainable farming practices accelerate biofertilizer adoption.
- Technological Advancements: Improvements in biofertilizer production, formulation, and application methods enhance efficiency.
Obstacles in the Europe Biofertilizer Industry Market
Challenges include:
- High Initial Investment Costs: Adopting biofertilizers can involve initial investments that may deter some farmers.
- Lack of Awareness: Limited awareness among some farmers regarding the benefits of biofertilizers slows down market penetration.
- Inconsistency in Product Quality: Variations in quality across different brands and manufacturers can affect farmer confidence.
Future Opportunities in Europe Biofertilizer Industry
Future opportunities include:
- Expansion into New Crop Types: Exploring the application of biofertilizers in niche and less explored crops.
- Development of Novel Biofertilizers: Creating formulations targeting specific soil conditions and nutrient deficiencies.
- Integration with Precision Agriculture: Combining biofertilizers with advanced technologies to optimize their application.
Major Players in the Europe Biofertilizer Industry Ecosystem
- UAB Bioenergy
- Symborg SL
- Biomax Naturals
- Ficosterra SL
- Agrinos AS
- Rizobacter Argentina S
- Biocorrection AS
- ASB Greenworld
Key Developments in Europe Biofertilizer Industry Industry
- March 2021: Symborg Corporate SL opened a new manufacturing facility in Spain, boosting production capacity for sustainable agricultural products, including biofertilizers.
- July 2021: Symborg Corporate SL signed a distribution agreement with Corteva Agrisciences, significantly expanding its market reach within the European Union.
- June 2022: Novozymes A/S and AgroFresh formed a partnership to develop biological solutions and enhance post-harvest food quality, indirectly influencing the biofertilizer market by improving overall agricultural efficiency.
Strategic Europe Biofertilizer Industry Market Forecast
The European biofertilizer market is poised for significant growth in the coming years. Driving factors include continued consumer preference for sustainable agriculture, stringent environmental regulations, and technological advancements in biofertilizer production. The market's potential is substantial, with significant opportunities for innovation and expansion across various segments. Continued investment in research and development, coupled with effective marketing and outreach strategies, will play a crucial role in shaping the future of the European biofertilizer industry.
Europe Biofertilizer Industry Segmentation
- 1. Production Analysis
- 2. Consumption Analysis
- 3. Import Market Analysis (Value & Volume)
- 4. Export Market Analysis (Value & Volume)
- 5. Price Trend Analysis
Europe Biofertilizer Industry Segmentation By Geography
-
1. Europe
- 1.1. United Kingdom
- 1.2. Germany
- 1.3. France
- 1.4. Italy
- 1.5. Spain
- 1.6. Netherlands
- 1.7. Belgium
- 1.8. Sweden
- 1.9. Norway
- 1.10. Poland
- 1.11. Denmark
Europe Biofertilizer Industry REPORT HIGHLIGHTS
| Aspects | Details |
|---|---|
| Study Period | 2019-2033 |
| Base Year | 2024 |
| Estimated Year | 2025 |
| Forecast Period | 2025-2033 |
| Historical Period | 2019-2024 |
| Growth Rate | CAGR of 12.10% from 2019-2033 |
| Segmentation |
|
Table of Contents
- 1. Introduction
- 1.1. Research Scope
- 1.2. Market Segmentation
- 1.3. Research Methodology
- 1.4. Definitions and Assumptions
- 2. Executive Summary
- 2.1. Introduction
- 3. Market Dynamics
- 3.1. Introduction
- 3.2. Market Drivers
- 3.2.1. Need for Custom Product Development; Use of CROs for Regulatory Services
- 3.3. Market Restrains
- 3.3.1. Data and Cyber Security Concerns; Lack of Experts and Professionals in this Industry
- 3.4. Market Trends
- 3.4.1. Adoption of Organic Farming Practice
- 4. Market Factor Analysis
- 4.1. Porters Five Forces
- 4.2. Supply/Value Chain
- 4.3. PESTEL analysis
- 4.4. Market Entropy
- 4.5. Patent/Trademark Analysis
- 5. Europe Biofertilizer Industry Analysis, Insights and Forecast, 2019-2031
- 5.1. Market Analysis, Insights and Forecast - by Production Analysis
- 5.2. Market Analysis, Insights and Forecast - by Consumption Analysis
- 5.3. Market Analysis, Insights and Forecast - by Import Market Analysis (Value & Volume)
- 5.4. Market Analysis, Insights and Forecast - by Export Market Analysis (Value & Volume)
- 5.5. Market Analysis, Insights and Forecast - by Price Trend Analysis
- 5.6. Market Analysis, Insights and Forecast - by Region
- 5.6.1. Europe
- 5.1. Market Analysis, Insights and Forecast - by Production Analysis
- 6. Germany Europe Biofertilizer Industry Analysis, Insights and Forecast, 2019-2031
- 7. France Europe Biofertilizer Industry Analysis, Insights and Forecast, 2019-2031
- 8. Italy Europe Biofertilizer Industry Analysis, Insights and Forecast, 2019-2031
- 9. United Kingdom Europe Biofertilizer Industry Analysis, Insights and Forecast, 2019-2031
- 10. Netherlands Europe Biofertilizer Industry Analysis, Insights and Forecast, 2019-2031
- 11. Sweden Europe Biofertilizer Industry Analysis, Insights and Forecast, 2019-2031
- 12. Rest of Europe Europe Biofertilizer Industry Analysis, Insights and Forecast, 2019-2031
- 13. Competitive Analysis
- 13.1. Market Share Analysis 2024
- 13.2. Company Profiles
- 13.2.1 UAB Bioenergy
- 13.2.1.1. Overview
- 13.2.1.2. Products
- 13.2.1.3. SWOT Analysis
- 13.2.1.4. Recent Developments
- 13.2.1.5. Financials (Based on Availability)
- 13.2.2 Symborg SL
- 13.2.2.1. Overview
- 13.2.2.2. Products
- 13.2.2.3. SWOT Analysis
- 13.2.2.4. Recent Developments
- 13.2.2.5. Financials (Based on Availability)
- 13.2.3 Biomax Naturals
- 13.2.3.1. Overview
- 13.2.3.2. Products
- 13.2.3.3. SWOT Analysis
- 13.2.3.4. Recent Developments
- 13.2.3.5. Financials (Based on Availability)
- 13.2.4 Ficosterra SL
- 13.2.4.1. Overview
- 13.2.4.2. Products
- 13.2.4.3. SWOT Analysis
- 13.2.4.4. Recent Developments
- 13.2.4.5. Financials (Based on Availability)
- 13.2.5 Agrinos AS
- 13.2.5.1. Overview
- 13.2.5.2. Products
- 13.2.5.3. SWOT Analysis
- 13.2.5.4. Recent Developments
- 13.2.5.5. Financials (Based on Availability)
- 13.2.6 Rizobacter Argentina S
- 13.2.6.1. Overview
- 13.2.6.2. Products
- 13.2.6.3. SWOT Analysis
- 13.2.6.4. Recent Developments
- 13.2.6.5. Financials (Based on Availability)
- 13.2.7 Biocorrection AS
- 13.2.7.1. Overview
- 13.2.7.2. Products
- 13.2.7.3. SWOT Analysis
- 13.2.7.4. Recent Developments
- 13.2.7.5. Financials (Based on Availability)
- 13.2.8 ASB Greenworld
- 13.2.8.1. Overview
- 13.2.8.2. Products
- 13.2.8.3. SWOT Analysis
- 13.2.8.4. Recent Developments
- 13.2.8.5. Financials (Based on Availability)
- 13.2.1 UAB Bioenergy
List of Figures
- Figure 1: Europe Biofertilizer Industry Revenue Breakdown (Million, %) by Product 2024 & 2032
- Figure 2: Europe Biofertilizer Industry Share (%) by Company 2024
List of Tables
- Table 1: Europe Biofertilizer Industry Revenue Million Forecast, by Region 2019 & 2032
- Table 2: Europe Biofertilizer Industry Revenue Million Forecast, by Production Analysis 2019 & 2032
- Table 3: Europe Biofertilizer Industry Revenue Million Forecast, by Consumption Analysis 2019 & 2032
- Table 4: Europe Biofertilizer Industry Revenue Million Forecast, by Import Market Analysis (Value & Volume) 2019 & 2032
- Table 5: Europe Biofertilizer Industry Revenue Million Forecast, by Export Market Analysis (Value & Volume) 2019 & 2032
- Table 6: Europe Biofertilizer Industry Revenue Million Forecast, by Price Trend Analysis 2019 & 2032
- Table 7: Europe Biofertilizer Industry Revenue Million Forecast, by Region 2019 & 2032
- Table 8: Europe Biofertilizer Industry Revenue Million Forecast, by Country 2019 & 2032
- Table 9: Germany Europe Biofertilizer Industry Revenue (Million) Forecast, by Application 2019 & 2032
- Table 10: France Europe Biofertilizer Industry Revenue (Million) Forecast, by Application 2019 & 2032
- Table 11: Italy Europe Biofertilizer Industry Revenue (Million) Forecast, by Application 2019 & 2032
- Table 12: United Kingdom Europe Biofertilizer Industry Revenue (Million) Forecast, by Application 2019 & 2032
- Table 13: Netherlands Europe Biofertilizer Industry Revenue (Million) Forecast, by Application 2019 & 2032
- Table 14: Sweden Europe Biofertilizer Industry Revenue (Million) Forecast, by Application 2019 & 2032
- Table 15: Rest of Europe Europe Biofertilizer Industry Revenue (Million) Forecast, by Application 2019 & 2032
- Table 16: Europe Biofertilizer Industry Revenue Million Forecast, by Production Analysis 2019 & 2032
- Table 17: Europe Biofertilizer Industry Revenue Million Forecast, by Consumption Analysis 2019 & 2032
- Table 18: Europe Biofertilizer Industry Revenue Million Forecast, by Import Market Analysis (Value & Volume) 2019 & 2032
- Table 19: Europe Biofertilizer Industry Revenue Million Forecast, by Export Market Analysis (Value & Volume) 2019 & 2032
- Table 20: Europe Biofertilizer Industry Revenue Million Forecast, by Price Trend Analysis 2019 & 2032
- Table 21: Europe Biofertilizer Industry Revenue Million Forecast, by Country 2019 & 2032
- Table 22: United Kingdom Europe Biofertilizer Industry Revenue (Million) Forecast, by Application 2019 & 2032
- Table 23: Germany Europe Biofertilizer Industry Revenue (Million) Forecast, by Application 2019 & 2032
- Table 24: France Europe Biofertilizer Industry Revenue (Million) Forecast, by Application 2019 & 2032
- Table 25: Italy Europe Biofertilizer Industry Revenue (Million) Forecast, by Application 2019 & 2032
- Table 26: Spain Europe Biofertilizer Industry Revenue (Million) Forecast, by Application 2019 & 2032
- Table 27: Netherlands Europe Biofertilizer Industry Revenue (Million) Forecast, by Application 2019 & 2032
- Table 28: Belgium Europe Biofertilizer Industry Revenue (Million) Forecast, by Application 2019 & 2032
- Table 29: Sweden Europe Biofertilizer Industry Revenue (Million) Forecast, by Application 2019 & 2032
- Table 30: Norway Europe Biofertilizer Industry Revenue (Million) Forecast, by Application 2019 & 2032
- Table 31: Poland Europe Biofertilizer Industry Revenue (Million) Forecast, by Application 2019 & 2032
- Table 32: Denmark Europe Biofertilizer Industry Revenue (Million) Forecast, by Application 2019 & 2032
Frequently Asked Questions
1. What is the projected Compound Annual Growth Rate (CAGR) of the Europe Biofertilizer Industry?
The projected CAGR is approximately 12.10%.
2. Which companies are prominent players in the Europe Biofertilizer Industry?
Key companies in the market include UAB Bioenergy, Symborg SL, Biomax Naturals, Ficosterra SL, Agrinos AS, Rizobacter Argentina S, Biocorrection AS, ASB Greenworld.
3. What are the main segments of the Europe Biofertilizer Industry?
The market segments include Production Analysis, Consumption Analysis, Import Market Analysis (Value & Volume), Export Market Analysis (Value & Volume), Price Trend Analysis.
4. Can you provide details about the market size?
The market size is estimated to be USD 0.65 Million as of 2022.
5. What are some drivers contributing to market growth?
Need for Custom Product Development; Use of CROs for Regulatory Services.
6. What are the notable trends driving market growth?
Adoption of Organic Farming Practice.
7. Are there any restraints impacting market growth?
Data and Cyber Security Concerns; Lack of Experts and Professionals in this Industry.
8. Can you provide examples of recent developments in the market?
June 2022: Novozymes A/S and AgroFresh form a partnership to develop biological solutions and improve post-harvest food quality.
9. What pricing options are available for accessing the report?
Pricing options include single-user, multi-user, and enterprise licenses priced at USD 4750, USD 5250, and USD 8750 respectively.
10. Is the market size provided in terms of value or volume?
The market size is provided in terms of value, measured in Million.
11. Are there any specific market keywords associated with the report?
Yes, the market keyword associated with the report is "Europe Biofertilizer Industry," which aids in identifying and referencing the specific market segment covered.
12. How do I determine which pricing option suits my needs best?
The pricing options vary based on user requirements and access needs. Individual users may opt for single-user licenses, while businesses requiring broader access may choose multi-user or enterprise licenses for cost-effective access to the report.
13. Are there any additional resources or data provided in the Europe Biofertilizer Industry report?
While the report offers comprehensive insights, it's advisable to review the specific contents or supplementary materials provided to ascertain if additional resources or data are available.
14. How can I stay updated on further developments or reports in the Europe Biofertilizer Industry?
To stay informed about further developments, trends, and reports in the Europe Biofertilizer Industry, consider subscribing to industry newsletters, following relevant companies and organizations, or regularly checking reputable industry news sources and publications.
Methodology
Step 1 - Identification of Relevant Samples Size from Population Database


Step 2 - Approaches for Defining Global Market Size (Value, Volume* & Price*)

Note*: In applicable scenarios
Step 3 - Data Sources
Primary Research
- Web Analytics
- Survey Reports
- Research Institute
- Latest Research Reports
- Opinion Leaders
Secondary Research
- Annual Reports
- White Paper
- Latest Press Release
- Industry Association
- Paid Database
- Investor Presentations

Step 4 - Data Triangulation
Involves using different sources of information in order to increase the validity of a study
These sources are likely to be stakeholders in a program - participants, other researchers, program staff, other community members, and so on.
Then we put all data in single framework & apply various statistical tools to find out the dynamic on the market.
During the analysis stage, feedback from the stakeholder groups would be compared to determine areas of agreement as well as areas of divergence
