

Key Insights
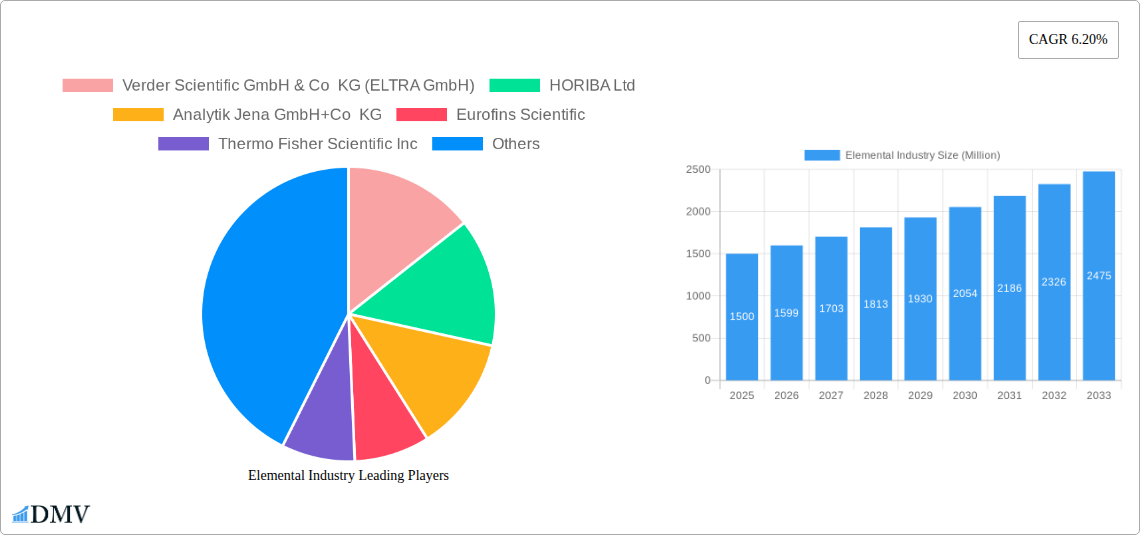
The elemental analysis market, valued at approximately $XX million in 2025, is projected to experience robust growth, exhibiting a Compound Annual Growth Rate (CAGR) of 6.20% from 2025 to 2033. This expansion is driven by several key factors. The increasing demand for precise elemental composition analysis across diverse industries, particularly in pharmaceuticals and biotechnology, fuels market growth. Stringent regulatory requirements for quality control and product safety necessitate advanced elemental analysis techniques, further boosting demand. Technological advancements in both destructive and non-destructive technologies, such as improvements in sensitivity and speed of analysis, are contributing to market expansion. Furthermore, the rising adoption of elemental analysis in research organizations for materials science and environmental monitoring applications provides a significant growth opportunity. The market is segmented by type (organic and inorganic elemental analysis), technology (destructive and non-destructive), and end-user (pharmaceutical and biotechnology companies, research organizations, and others). North America and Europe currently hold significant market share, driven by established research infrastructure and stringent regulatory frameworks. However, the Asia-Pacific region is poised for rapid growth due to increasing industrialization and investments in research and development.
The competitive landscape is characterized by a mix of established players like Thermo Fisher Scientific, Agilent Technologies, and PerkinElmer, alongside specialized companies like ELTRA GmbH and Angstrom Advanced Inc. These companies are continuously innovating to enhance the capabilities of their analytical instruments, including improvements in automation, data analysis software, and miniaturization for ease of use. Market restraints include the high initial investment costs associated with purchasing advanced elemental analyzers, and the need for skilled personnel to operate and maintain these sophisticated instruments. However, the long-term benefits of improved product quality, reduced production costs, and enhanced regulatory compliance are expected to outweigh these challenges, ensuring consistent market growth throughout the forecast period. The continued advancements in technology and increasing demand across various sectors point towards a positive outlook for the elemental analysis market.
Elemental Industry Market Report: 2019-2033
This comprehensive report provides a detailed analysis of the global elemental analysis market, projecting a market value exceeding $XX Million by 2033. It offers invaluable insights for stakeholders, including manufacturers, researchers, investors, and regulatory bodies, to navigate this dynamic industry. The study period covers 2019-2033, with 2025 as the base and estimated year, and a forecast period of 2025-2033. The historical period analyzed is 2019-2024.
Elemental Industry Market Composition & Trends
This section delves into the intricate structure of the elemental analysis market, evaluating its concentration, innovation drivers, regulatory environment, substitute products, end-user profiles, and mergers & acquisitions (M&A) activities. The market is characterized by a moderately concentrated landscape, with key players such as Thermo Fisher Scientific, Agilent Technologies, and PerkinElmer holding significant market share. However, smaller specialized companies continue to innovate and compete effectively.
- Market Share Distribution: Thermo Fisher Scientific holds an estimated xx% market share, followed by Agilent Technologies at xx% and PerkinElmer at xx%. The remaining share is distributed among other key players and smaller niche businesses.
- M&A Activity: The elemental analysis market has witnessed a moderate level of M&A activity in recent years, with deal values totaling approximately $XX Million between 2019 and 2024. These activities primarily focus on expanding product portfolios, technological capabilities, and geographical reach.
- Innovation Catalysts: Stringent environmental regulations and the growing demand for precise elemental analysis in various industries are driving continuous innovation in analytical technologies.
- Regulatory Landscape: Stringent regulations regarding environmental monitoring and safety standards significantly influence the market's growth and technological advancements.
- Substitute Products: While other analytical techniques exist, elemental analysis remains the gold standard for precise elemental quantification in many applications due to its accuracy and sensitivity.
- End-User Profiles: The key end-users include pharmaceutical and biotechnology companies, research organizations, environmental agencies, and various industrial sectors.
Elemental Industry Industry Evolution
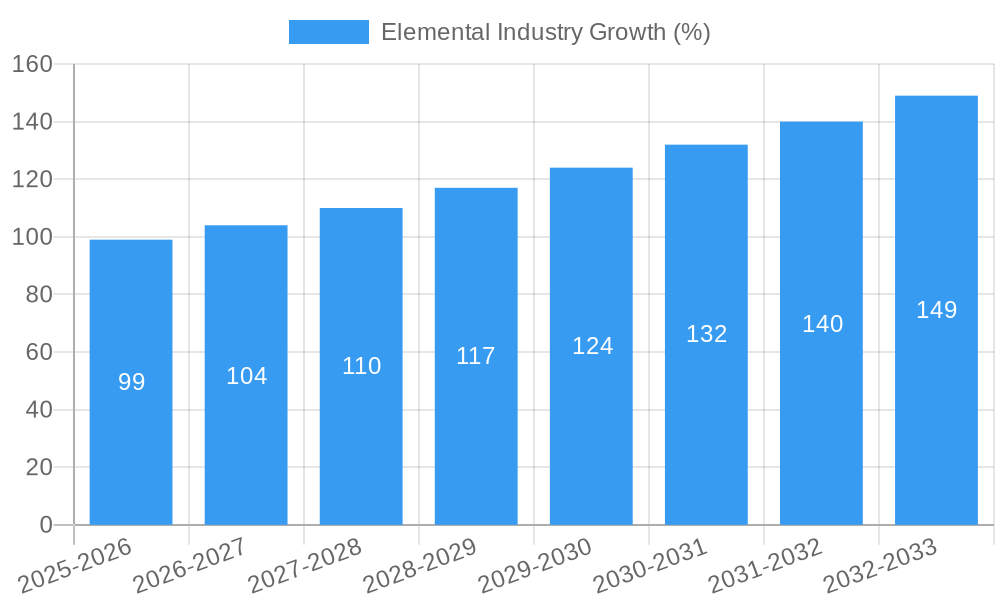
The elemental analysis market has witnessed substantial growth, driven by technological advancements and increasing demand across diverse sectors. From 2019 to 2024, the market exhibited a Compound Annual Growth Rate (CAGR) of approximately xx%, reaching a value of $XX Million in 2024. This growth trajectory is anticipated to continue, driven by technological advancements and the expansion of applications across various sectors. The adoption of advanced techniques such as ICP-MS and laser ablation-ICP-MS is steadily increasing, contributing to the market expansion. The increasing demand for high-throughput analysis is prompting the development of automated and high-throughput systems.
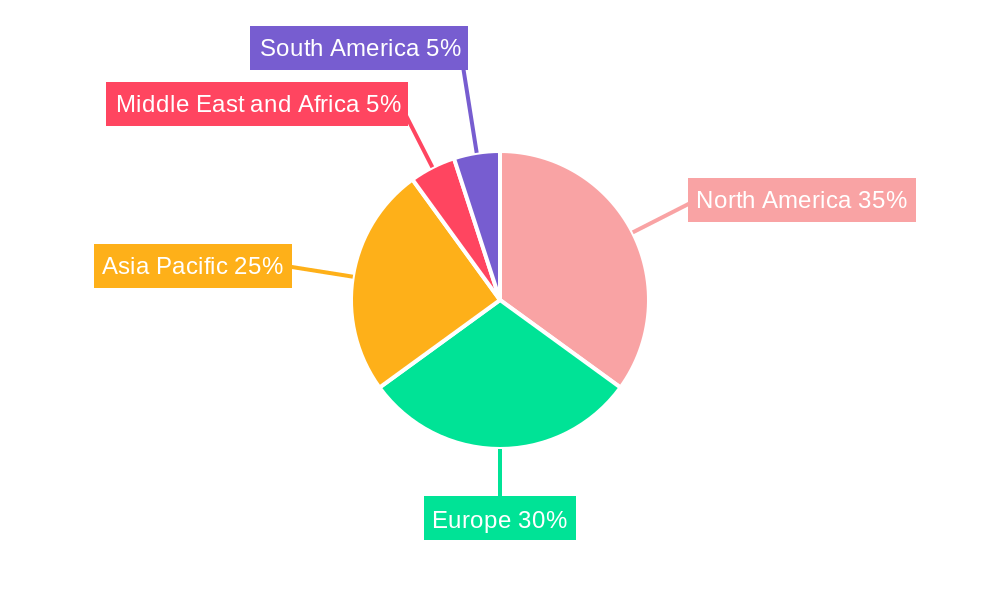
Leading Regions, Countries, or Segments in Elemental Industry
North America currently dominates the global elemental analysis market, driven by substantial investments in research and development, strong regulatory frameworks, and a large presence of key players. However, regions such as Asia-Pacific are experiencing rapid growth due to increased industrialization and rising government spending on environmental monitoring and research.
- By Type: Inorganic elemental analysis currently holds a larger market share compared to organic elemental analysis, mainly due to its extensive applications in various industrial sectors.
- By Technology: Destructive technologies currently dominate the market due to their high accuracy and reliability. However, non-destructive technologies are gaining traction, owing to their advantages in preserving samples and minimizing sample preparation.
- By End User: Pharmaceutical and biotechnology companies are among the largest consumers of elemental analysis services due to the stringent quality control requirements in the pharmaceutical industry. Research organizations also represent a significant end-user segment, fueling demand for advanced analytical techniques.
- Key Drivers: High government funding for research & development in developed regions, stringent environmental regulations, and the increasing demand for high-throughput testing.
Elemental Industry Product Innovations
Recent years have witnessed significant advancements in elemental analysis instrumentation, including the development of more sensitive detectors, improved sample introduction systems, and enhanced software capabilities. These innovations have resulted in increased speed, accuracy, and precision of analysis, facilitating the adoption of elemental analysis in various applications. Unique selling propositions now include improved limits of detection (LODs), wider calibration ranges, faster analysis times, and user-friendly software interfaces.
Propelling Factors for Elemental Industry Growth
Several factors contribute to the growth of the elemental analysis market. Technological advancements, particularly in ICP-MS and XRF technologies, are driving improved accuracy, speed, and ease of use. Increased government regulations aimed at environmental protection and food safety are fueling the demand for elemental analysis services. Furthermore, expanding industrial sectors, like pharmaceuticals and semiconductors, require precise elemental analysis for quality control and process optimization.
Obstacles in the Elemental Industry Market
Despite its significant growth, the elemental analysis market faces challenges, including the high cost of advanced instruments, the complexity of sample preparation, and the need for skilled personnel to operate the equipment. The market is also subject to supply chain disruptions that can impact the availability of consumables and components. Furthermore, increasing competitive pressure from established and emerging players also poses a challenge.
Future Opportunities in Elemental Industry
Emerging opportunities exist in the elemental analysis market, particularly in the development of miniaturized and portable instruments, online analysis techniques, and the application of elemental analysis in new fields, such as materials science and nanotechnology. There is also substantial potential in developing advanced data analysis tools to interpret complex elemental data and improve decision-making.
Major Players in the Elemental Industry Ecosystem
- Verder Scientific GmbH & Co KG (ELTRA GmbH)
- HORIBA Ltd
- Analytik Jena GmbH+Co KG
- Eurofins Scientific
- Thermo Fisher Scientific Inc
- Bruker
- Agilent Technologies Inc
- Elemental Analysis Inc
- PerkinElmer Inc
- Angstrom Advanced Inc
- Shimadzu Corporation
- Rigaku Corporation
Key Developments in Elemental Industry Industry
- July 2022: SPECTRO Analytical Instruments launched the SPECTROMAXx LMX10 arc/spark OES analyzer, featuring improved LODs and extended calibration ranges, significantly impacting metal analysis.
- May 2022: Analytik Jena introduced optimal solutions for drinking water analysis using ICP-MS, enhancing efficiency and accuracy in water quality monitoring.
Strategic Elemental Industry Market Forecast
The elemental analysis market is poised for continued growth, driven by technological advancements, increasing regulatory scrutiny, and expanding applications across diverse sectors. The market's future potential is significant, with projections indicating substantial growth in the coming years, driven by continued adoption of innovative technologies and rising demand in key end-use segments.
Elemental Industry Segmentation
-
1. Type
- 1.1. Organic Elemental Analysis
- 1.2. Inorganic Elemental Analysis
-
2. Technology
-
2.1. Destructive Technologies
- 2.1.1. Wet Digestion
- 2.1.2. Combustion Analysis
- 2.1.3. Others
-
2.2. Nondestructive Technologies
- 2.2.1. X-Ray Fluorescence Spectroscopy (XRF)
- 2.2.2. Fourier Transform Infrared Spectroscopy (FTIR)
-
2.1. Destructive Technologies
-
3. End User
- 3.1. Pharmaceutical and Biotechnology Companies
- 3.2. Research Organizations
- 3.3. Others
Elemental Industry Segmentation By Geography
-
1. North America
- 1.1. United States
- 1.2. Canada
- 1.3. Mexico
-
2. Europe
- 2.1. Germany
- 2.2. United Kingdom
- 2.3. France
- 2.4. Italy
- 2.5. Spain
- 2.6. Rest of Europe
-
3. Asia Pacific
- 3.1. China
- 3.2. Japan
- 3.3. India
- 3.4. Australia
- 3.5. South Korea
- 3.6. Rest of Asia Pacific
-
4. Middle East and Africa
- 4.1. GCC
- 4.2. South Africa
- 4.3. Rest of Middle East and Africa
-
5. South America
- 5.1. Brazil
- 5.2. Argentina
- 5.3. Rest of South America
Elemental Industry REPORT HIGHLIGHTS
| Aspects | Details |
|---|---|
| Study Period | 2019-2033 |
| Base Year | 2024 |
| Estimated Year | 2025 |
| Forecast Period | 2025-2033 |
| Historical Period | 2019-2024 |
| Growth Rate | CAGR of 6.20% from 2019-2033 |
| Segmentation |
|
Table of Contents
- 1. Introduction
- 1.1. Research Scope
- 1.2. Market Segmentation
- 1.3. Research Methodology
- 1.4. Definitions and Assumptions
- 2. Executive Summary
- 2.1. Introduction
- 3. Market Dynamics
- 3.1. Introduction
- 3.2. Market Drivers
- 3.2.1. Growing R&D Funding in Life Sciences; Mandating Government Regulations for Elemental Analysis of Pharmaceutical and Healthcare Products
- 3.3. Market Restrains
- 3.3.1. Lack of Skilled Personnel
- 3.4. Market Trends
- 3.4.1. Inorganic Elemental Analysis Dominate the Global Elemental Analysis Market During the Forecast Period
- 4. Market Factor Analysis
- 4.1. Porters Five Forces
- 4.2. Supply/Value Chain
- 4.3. PESTEL analysis
- 4.4. Market Entropy
- 4.5. Patent/Trademark Analysis
- 5. Global Elemental Industry Analysis, Insights and Forecast, 2019-2031
- 5.1. Market Analysis, Insights and Forecast - by Type
- 5.1.1. Organic Elemental Analysis
- 5.1.2. Inorganic Elemental Analysis
- 5.2. Market Analysis, Insights and Forecast - by Technology
- 5.2.1. Destructive Technologies
- 5.2.1.1. Wet Digestion
- 5.2.1.2. Combustion Analysis
- 5.2.1.3. Others
- 5.2.2. Nondestructive Technologies
- 5.2.2.1. X-Ray Fluorescence Spectroscopy (XRF)
- 5.2.2.2. Fourier Transform Infrared Spectroscopy (FTIR)
- 5.2.1. Destructive Technologies
- 5.3. Market Analysis, Insights and Forecast - by End User
- 5.3.1. Pharmaceutical and Biotechnology Companies
- 5.3.2. Research Organizations
- 5.3.3. Others
- 5.4. Market Analysis, Insights and Forecast - by Region
- 5.4.1. North America
- 5.4.2. Europe
- 5.4.3. Asia Pacific
- 5.4.4. Middle East and Africa
- 5.4.5. South America
- 5.1. Market Analysis, Insights and Forecast - by Type
- 6. North America Elemental Industry Analysis, Insights and Forecast, 2019-2031
- 6.1. Market Analysis, Insights and Forecast - by Type
- 6.1.1. Organic Elemental Analysis
- 6.1.2. Inorganic Elemental Analysis
- 6.2. Market Analysis, Insights and Forecast - by Technology
- 6.2.1. Destructive Technologies
- 6.2.1.1. Wet Digestion
- 6.2.1.2. Combustion Analysis
- 6.2.1.3. Others
- 6.2.2. Nondestructive Technologies
- 6.2.2.1. X-Ray Fluorescence Spectroscopy (XRF)
- 6.2.2.2. Fourier Transform Infrared Spectroscopy (FTIR)
- 6.2.1. Destructive Technologies
- 6.3. Market Analysis, Insights and Forecast - by End User
- 6.3.1. Pharmaceutical and Biotechnology Companies
- 6.3.2. Research Organizations
- 6.3.3. Others
- 6.1. Market Analysis, Insights and Forecast - by Type
- 7. Europe Elemental Industry Analysis, Insights and Forecast, 2019-2031
- 7.1. Market Analysis, Insights and Forecast - by Type
- 7.1.1. Organic Elemental Analysis
- 7.1.2. Inorganic Elemental Analysis
- 7.2. Market Analysis, Insights and Forecast - by Technology
- 7.2.1. Destructive Technologies
- 7.2.1.1. Wet Digestion
- 7.2.1.2. Combustion Analysis
- 7.2.1.3. Others
- 7.2.2. Nondestructive Technologies
- 7.2.2.1. X-Ray Fluorescence Spectroscopy (XRF)
- 7.2.2.2. Fourier Transform Infrared Spectroscopy (FTIR)
- 7.2.1. Destructive Technologies
- 7.3. Market Analysis, Insights and Forecast - by End User
- 7.3.1. Pharmaceutical and Biotechnology Companies
- 7.3.2. Research Organizations
- 7.3.3. Others
- 7.1. Market Analysis, Insights and Forecast - by Type
- 8. Asia Pacific Elemental Industry Analysis, Insights and Forecast, 2019-2031
- 8.1. Market Analysis, Insights and Forecast - by Type
- 8.1.1. Organic Elemental Analysis
- 8.1.2. Inorganic Elemental Analysis
- 8.2. Market Analysis, Insights and Forecast - by Technology
- 8.2.1. Destructive Technologies
- 8.2.1.1. Wet Digestion
- 8.2.1.2. Combustion Analysis
- 8.2.1.3. Others
- 8.2.2. Nondestructive Technologies
- 8.2.2.1. X-Ray Fluorescence Spectroscopy (XRF)
- 8.2.2.2. Fourier Transform Infrared Spectroscopy (FTIR)
- 8.2.1. Destructive Technologies
- 8.3. Market Analysis, Insights and Forecast - by End User
- 8.3.1. Pharmaceutical and Biotechnology Companies
- 8.3.2. Research Organizations
- 8.3.3. Others
- 8.1. Market Analysis, Insights and Forecast - by Type
- 9. Middle East and Africa Elemental Industry Analysis, Insights and Forecast, 2019-2031
- 9.1. Market Analysis, Insights and Forecast - by Type
- 9.1.1. Organic Elemental Analysis
- 9.1.2. Inorganic Elemental Analysis
- 9.2. Market Analysis, Insights and Forecast - by Technology
- 9.2.1. Destructive Technologies
- 9.2.1.1. Wet Digestion
- 9.2.1.2. Combustion Analysis
- 9.2.1.3. Others
- 9.2.2. Nondestructive Technologies
- 9.2.2.1. X-Ray Fluorescence Spectroscopy (XRF)
- 9.2.2.2. Fourier Transform Infrared Spectroscopy (FTIR)
- 9.2.1. Destructive Technologies
- 9.3. Market Analysis, Insights and Forecast - by End User
- 9.3.1. Pharmaceutical and Biotechnology Companies
- 9.3.2. Research Organizations
- 9.3.3. Others
- 9.1. Market Analysis, Insights and Forecast - by Type
- 10. South America Elemental Industry Analysis, Insights and Forecast, 2019-2031
- 10.1. Market Analysis, Insights and Forecast - by Type
- 10.1.1. Organic Elemental Analysis
- 10.1.2. Inorganic Elemental Analysis
- 10.2. Market Analysis, Insights and Forecast - by Technology
- 10.2.1. Destructive Technologies
- 10.2.1.1. Wet Digestion
- 10.2.1.2. Combustion Analysis
- 10.2.1.3. Others
- 10.2.2. Nondestructive Technologies
- 10.2.2.1. X-Ray Fluorescence Spectroscopy (XRF)
- 10.2.2.2. Fourier Transform Infrared Spectroscopy (FTIR)
- 10.2.1. Destructive Technologies
- 10.3. Market Analysis, Insights and Forecast - by End User
- 10.3.1. Pharmaceutical and Biotechnology Companies
- 10.3.2. Research Organizations
- 10.3.3. Others
- 10.1. Market Analysis, Insights and Forecast - by Type
- 11. North America Elemental Industry Analysis, Insights and Forecast, 2019-2031
- 11.1. Market Analysis, Insights and Forecast - By Country/Sub-region
- 11.1.1 United States
- 11.1.2 Canada
- 11.1.3 Mexico
- 12. Europe Elemental Industry Analysis, Insights and Forecast, 2019-2031
- 12.1. Market Analysis, Insights and Forecast - By Country/Sub-region
- 12.1.1 Germany
- 12.1.2 United Kingdom
- 12.1.3 France
- 12.1.4 Italy
- 12.1.5 Spain
- 12.1.6 Rest of Europe
- 13. Asia Pacific Elemental Industry Analysis, Insights and Forecast, 2019-2031
- 13.1. Market Analysis, Insights and Forecast - By Country/Sub-region
- 13.1.1 China
- 13.1.2 Japan
- 13.1.3 India
- 13.1.4 Australia
- 13.1.5 South Korea
- 13.1.6 Rest of Asia Pacific
- 14. Middle East and Africa Elemental Industry Analysis, Insights and Forecast, 2019-2031
- 14.1. Market Analysis, Insights and Forecast - By Country/Sub-region
- 14.1.1 GCC
- 14.1.2 South Africa
- 14.1.3 Rest of Middle East and Africa
- 15. South America Elemental Industry Analysis, Insights and Forecast, 2019-2031
- 15.1. Market Analysis, Insights and Forecast - By Country/Sub-region
- 15.1.1 Brazil
- 15.1.2 Argentina
- 15.1.3 Rest of South America
- 16. Competitive Analysis
- 16.1. Global Market Share Analysis 2024
- 16.2. Company Profiles
- 16.2.1 Verder Scientific GmbH & Co KG (ELTRA GmbH)
- 16.2.1.1. Overview
- 16.2.1.2. Products
- 16.2.1.3. SWOT Analysis
- 16.2.1.4. Recent Developments
- 16.2.1.5. Financials (Based on Availability)
- 16.2.2 HORIBA Ltd
- 16.2.2.1. Overview
- 16.2.2.2. Products
- 16.2.2.3. SWOT Analysis
- 16.2.2.4. Recent Developments
- 16.2.2.5. Financials (Based on Availability)
- 16.2.3 Analytik Jena GmbH+Co KG
- 16.2.3.1. Overview
- 16.2.3.2. Products
- 16.2.3.3. SWOT Analysis
- 16.2.3.4. Recent Developments
- 16.2.3.5. Financials (Based on Availability)
- 16.2.4 Eurofins Scientific
- 16.2.4.1. Overview
- 16.2.4.2. Products
- 16.2.4.3. SWOT Analysis
- 16.2.4.4. Recent Developments
- 16.2.4.5. Financials (Based on Availability)
- 16.2.5 Thermo Fisher Scientific Inc
- 16.2.5.1. Overview
- 16.2.5.2. Products
- 16.2.5.3. SWOT Analysis
- 16.2.5.4. Recent Developments
- 16.2.5.5. Financials (Based on Availability)
- 16.2.6 Bruker
- 16.2.6.1. Overview
- 16.2.6.2. Products
- 16.2.6.3. SWOT Analysis
- 16.2.6.4. Recent Developments
- 16.2.6.5. Financials (Based on Availability)
- 16.2.7 Agilent Technologies Inc
- 16.2.7.1. Overview
- 16.2.7.2. Products
- 16.2.7.3. SWOT Analysis
- 16.2.7.4. Recent Developments
- 16.2.7.5. Financials (Based on Availability)
- 16.2.8 Elemental Analysis Inc
- 16.2.8.1. Overview
- 16.2.8.2. Products
- 16.2.8.3. SWOT Analysis
- 16.2.8.4. Recent Developments
- 16.2.8.5. Financials (Based on Availability)
- 16.2.9 PerkinElmer Inc
- 16.2.9.1. Overview
- 16.2.9.2. Products
- 16.2.9.3. SWOT Analysis
- 16.2.9.4. Recent Developments
- 16.2.9.5. Financials (Based on Availability)
- 16.2.10 Angstrom Advanced Inc
- 16.2.10.1. Overview
- 16.2.10.2. Products
- 16.2.10.3. SWOT Analysis
- 16.2.10.4. Recent Developments
- 16.2.10.5. Financials (Based on Availability)
- 16.2.11 Shimadzu Corporation
- 16.2.11.1. Overview
- 16.2.11.2. Products
- 16.2.11.3. SWOT Analysis
- 16.2.11.4. Recent Developments
- 16.2.11.5. Financials (Based on Availability)
- 16.2.12 Rigaku Corporation
- 16.2.12.1. Overview
- 16.2.12.2. Products
- 16.2.12.3. SWOT Analysis
- 16.2.12.4. Recent Developments
- 16.2.12.5. Financials (Based on Availability)
- 16.2.1 Verder Scientific GmbH & Co KG (ELTRA GmbH)
List of Figures
- Figure 1: Global Elemental Industry Revenue Breakdown (Million, %) by Region 2024 & 2032
- Figure 2: Global Elemental Industry Volume Breakdown (K Unit, %) by Region 2024 & 2032
- Figure 3: North America Elemental Industry Revenue (Million), by Country 2024 & 2032
- Figure 4: North America Elemental Industry Volume (K Unit), by Country 2024 & 2032
- Figure 5: North America Elemental Industry Revenue Share (%), by Country 2024 & 2032
- Figure 6: North America Elemental Industry Volume Share (%), by Country 2024 & 2032
- Figure 7: Europe Elemental Industry Revenue (Million), by Country 2024 & 2032
- Figure 8: Europe Elemental Industry Volume (K Unit), by Country 2024 & 2032
- Figure 9: Europe Elemental Industry Revenue Share (%), by Country 2024 & 2032
- Figure 10: Europe Elemental Industry Volume Share (%), by Country 2024 & 2032
- Figure 11: Asia Pacific Elemental Industry Revenue (Million), by Country 2024 & 2032
- Figure 12: Asia Pacific Elemental Industry Volume (K Unit), by Country 2024 & 2032
- Figure 13: Asia Pacific Elemental Industry Revenue Share (%), by Country 2024 & 2032
- Figure 14: Asia Pacific Elemental Industry Volume Share (%), by Country 2024 & 2032
- Figure 15: Middle East and Africa Elemental Industry Revenue (Million), by Country 2024 & 2032
- Figure 16: Middle East and Africa Elemental Industry Volume (K Unit), by Country 2024 & 2032
- Figure 17: Middle East and Africa Elemental Industry Revenue Share (%), by Country 2024 & 2032
- Figure 18: Middle East and Africa Elemental Industry Volume Share (%), by Country 2024 & 2032
- Figure 19: South America Elemental Industry Revenue (Million), by Country 2024 & 2032
- Figure 20: South America Elemental Industry Volume (K Unit), by Country 2024 & 2032
- Figure 21: South America Elemental Industry Revenue Share (%), by Country 2024 & 2032
- Figure 22: South America Elemental Industry Volume Share (%), by Country 2024 & 2032
- Figure 23: North America Elemental Industry Revenue (Million), by Type 2024 & 2032
- Figure 24: North America Elemental Industry Volume (K Unit), by Type 2024 & 2032
- Figure 25: North America Elemental Industry Revenue Share (%), by Type 2024 & 2032
- Figure 26: North America Elemental Industry Volume Share (%), by Type 2024 & 2032
- Figure 27: North America Elemental Industry Revenue (Million), by Technology 2024 & 2032
- Figure 28: North America Elemental Industry Volume (K Unit), by Technology 2024 & 2032
- Figure 29: North America Elemental Industry Revenue Share (%), by Technology 2024 & 2032
- Figure 30: North America Elemental Industry Volume Share (%), by Technology 2024 & 2032
- Figure 31: North America Elemental Industry Revenue (Million), by End User 2024 & 2032
- Figure 32: North America Elemental Industry Volume (K Unit), by End User 2024 & 2032
- Figure 33: North America Elemental Industry Revenue Share (%), by End User 2024 & 2032
- Figure 34: North America Elemental Industry Volume Share (%), by End User 2024 & 2032
- Figure 35: North America Elemental Industry Revenue (Million), by Country 2024 & 2032
- Figure 36: North America Elemental Industry Volume (K Unit), by Country 2024 & 2032
- Figure 37: North America Elemental Industry Revenue Share (%), by Country 2024 & 2032
- Figure 38: North America Elemental Industry Volume Share (%), by Country 2024 & 2032
- Figure 39: Europe Elemental Industry Revenue (Million), by Type 2024 & 2032
- Figure 40: Europe Elemental Industry Volume (K Unit), by Type 2024 & 2032
- Figure 41: Europe Elemental Industry Revenue Share (%), by Type 2024 & 2032
- Figure 42: Europe Elemental Industry Volume Share (%), by Type 2024 & 2032
- Figure 43: Europe Elemental Industry Revenue (Million), by Technology 2024 & 2032
- Figure 44: Europe Elemental Industry Volume (K Unit), by Technology 2024 & 2032
- Figure 45: Europe Elemental Industry Revenue Share (%), by Technology 2024 & 2032
- Figure 46: Europe Elemental Industry Volume Share (%), by Technology 2024 & 2032
- Figure 47: Europe Elemental Industry Revenue (Million), by End User 2024 & 2032
- Figure 48: Europe Elemental Industry Volume (K Unit), by End User 2024 & 2032
- Figure 49: Europe Elemental Industry Revenue Share (%), by End User 2024 & 2032
- Figure 50: Europe Elemental Industry Volume Share (%), by End User 2024 & 2032
- Figure 51: Europe Elemental Industry Revenue (Million), by Country 2024 & 2032
- Figure 52: Europe Elemental Industry Volume (K Unit), by Country 2024 & 2032
- Figure 53: Europe Elemental Industry Revenue Share (%), by Country 2024 & 2032
- Figure 54: Europe Elemental Industry Volume Share (%), by Country 2024 & 2032
- Figure 55: Asia Pacific Elemental Industry Revenue (Million), by Type 2024 & 2032
- Figure 56: Asia Pacific Elemental Industry Volume (K Unit), by Type 2024 & 2032
- Figure 57: Asia Pacific Elemental Industry Revenue Share (%), by Type 2024 & 2032
- Figure 58: Asia Pacific Elemental Industry Volume Share (%), by Type 2024 & 2032
- Figure 59: Asia Pacific Elemental Industry Revenue (Million), by Technology 2024 & 2032
- Figure 60: Asia Pacific Elemental Industry Volume (K Unit), by Technology 2024 & 2032
- Figure 61: Asia Pacific Elemental Industry Revenue Share (%), by Technology 2024 & 2032
- Figure 62: Asia Pacific Elemental Industry Volume Share (%), by Technology 2024 & 2032
- Figure 63: Asia Pacific Elemental Industry Revenue (Million), by End User 2024 & 2032
- Figure 64: Asia Pacific Elemental Industry Volume (K Unit), by End User 2024 & 2032
- Figure 65: Asia Pacific Elemental Industry Revenue Share (%), by End User 2024 & 2032
- Figure 66: Asia Pacific Elemental Industry Volume Share (%), by End User 2024 & 2032
- Figure 67: Asia Pacific Elemental Industry Revenue (Million), by Country 2024 & 2032
- Figure 68: Asia Pacific Elemental Industry Volume (K Unit), by Country 2024 & 2032
- Figure 69: Asia Pacific Elemental Industry Revenue Share (%), by Country 2024 & 2032
- Figure 70: Asia Pacific Elemental Industry Volume Share (%), by Country 2024 & 2032
- Figure 71: Middle East and Africa Elemental Industry Revenue (Million), by Type 2024 & 2032
- Figure 72: Middle East and Africa Elemental Industry Volume (K Unit), by Type 2024 & 2032
- Figure 73: Middle East and Africa Elemental Industry Revenue Share (%), by Type 2024 & 2032
- Figure 74: Middle East and Africa Elemental Industry Volume Share (%), by Type 2024 & 2032
- Figure 75: Middle East and Africa Elemental Industry Revenue (Million), by Technology 2024 & 2032
- Figure 76: Middle East and Africa Elemental Industry Volume (K Unit), by Technology 2024 & 2032
- Figure 77: Middle East and Africa Elemental Industry Revenue Share (%), by Technology 2024 & 2032
- Figure 78: Middle East and Africa Elemental Industry Volume Share (%), by Technology 2024 & 2032
- Figure 79: Middle East and Africa Elemental Industry Revenue (Million), by End User 2024 & 2032
- Figure 80: Middle East and Africa Elemental Industry Volume (K Unit), by End User 2024 & 2032
- Figure 81: Middle East and Africa Elemental Industry Revenue Share (%), by End User 2024 & 2032
- Figure 82: Middle East and Africa Elemental Industry Volume Share (%), by End User 2024 & 2032
- Figure 83: Middle East and Africa Elemental Industry Revenue (Million), by Country 2024 & 2032
- Figure 84: Middle East and Africa Elemental Industry Volume (K Unit), by Country 2024 & 2032
- Figure 85: Middle East and Africa Elemental Industry Revenue Share (%), by Country 2024 & 2032
- Figure 86: Middle East and Africa Elemental Industry Volume Share (%), by Country 2024 & 2032
- Figure 87: South America Elemental Industry Revenue (Million), by Type 2024 & 2032
- Figure 88: South America Elemental Industry Volume (K Unit), by Type 2024 & 2032
- Figure 89: South America Elemental Industry Revenue Share (%), by Type 2024 & 2032
- Figure 90: South America Elemental Industry Volume Share (%), by Type 2024 & 2032
- Figure 91: South America Elemental Industry Revenue (Million), by Technology 2024 & 2032
- Figure 92: South America Elemental Industry Volume (K Unit), by Technology 2024 & 2032
- Figure 93: South America Elemental Industry Revenue Share (%), by Technology 2024 & 2032
- Figure 94: South America Elemental Industry Volume Share (%), by Technology 2024 & 2032
- Figure 95: South America Elemental Industry Revenue (Million), by End User 2024 & 2032
- Figure 96: South America Elemental Industry Volume (K Unit), by End User 2024 & 2032
- Figure 97: South America Elemental Industry Revenue Share (%), by End User 2024 & 2032
- Figure 98: South America Elemental Industry Volume Share (%), by End User 2024 & 2032
- Figure 99: South America Elemental Industry Revenue (Million), by Country 2024 & 2032
- Figure 100: South America Elemental Industry Volume (K Unit), by Country 2024 & 2032
- Figure 101: South America Elemental Industry Revenue Share (%), by Country 2024 & 2032
- Figure 102: South America Elemental Industry Volume Share (%), by Country 2024 & 2032
List of Tables
- Table 1: Global Elemental Industry Revenue Million Forecast, by Region 2019 & 2032
- Table 2: Global Elemental Industry Volume K Unit Forecast, by Region 2019 & 2032
- Table 3: Global Elemental Industry Revenue Million Forecast, by Type 2019 & 2032
- Table 4: Global Elemental Industry Volume K Unit Forecast, by Type 2019 & 2032
- Table 5: Global Elemental Industry Revenue Million Forecast, by Technology 2019 & 2032
- Table 6: Global Elemental Industry Volume K Unit Forecast, by Technology 2019 & 2032
- Table 7: Global Elemental Industry Revenue Million Forecast, by End User 2019 & 2032
- Table 8: Global Elemental Industry Volume K Unit Forecast, by End User 2019 & 2032
- Table 9: Global Elemental Industry Revenue Million Forecast, by Region 2019 & 2032
- Table 10: Global Elemental Industry Volume K Unit Forecast, by Region 2019 & 2032
- Table 11: Global Elemental Industry Revenue Million Forecast, by Country 2019 & 2032
- Table 12: Global Elemental Industry Volume K Unit Forecast, by Country 2019 & 2032
- Table 13: United States Elemental Industry Revenue (Million) Forecast, by Application 2019 & 2032
- Table 14: United States Elemental Industry Volume (K Unit) Forecast, by Application 2019 & 2032
- Table 15: Canada Elemental Industry Revenue (Million) Forecast, by Application 2019 & 2032
- Table 16: Canada Elemental Industry Volume (K Unit) Forecast, by Application 2019 & 2032
- Table 17: Mexico Elemental Industry Revenue (Million) Forecast, by Application 2019 & 2032
- Table 18: Mexico Elemental Industry Volume (K Unit) Forecast, by Application 2019 & 2032
- Table 19: Global Elemental Industry Revenue Million Forecast, by Country 2019 & 2032
- Table 20: Global Elemental Industry Volume K Unit Forecast, by Country 2019 & 2032
- Table 21: Germany Elemental Industry Revenue (Million) Forecast, by Application 2019 & 2032
- Table 22: Germany Elemental Industry Volume (K Unit) Forecast, by Application 2019 & 2032
- Table 23: United Kingdom Elemental Industry Revenue (Million) Forecast, by Application 2019 & 2032
- Table 24: United Kingdom Elemental Industry Volume (K Unit) Forecast, by Application 2019 & 2032
- Table 25: France Elemental Industry Revenue (Million) Forecast, by Application 2019 & 2032
- Table 26: France Elemental Industry Volume (K Unit) Forecast, by Application 2019 & 2032
- Table 27: Italy Elemental Industry Revenue (Million) Forecast, by Application 2019 & 2032
- Table 28: Italy Elemental Industry Volume (K Unit) Forecast, by Application 2019 & 2032
- Table 29: Spain Elemental Industry Revenue (Million) Forecast, by Application 2019 & 2032
- Table 30: Spain Elemental Industry Volume (K Unit) Forecast, by Application 2019 & 2032
- Table 31: Rest of Europe Elemental Industry Revenue (Million) Forecast, by Application 2019 & 2032
- Table 32: Rest of Europe Elemental Industry Volume (K Unit) Forecast, by Application 2019 & 2032
- Table 33: Global Elemental Industry Revenue Million Forecast, by Country 2019 & 2032
- Table 34: Global Elemental Industry Volume K Unit Forecast, by Country 2019 & 2032
- Table 35: China Elemental Industry Revenue (Million) Forecast, by Application 2019 & 2032
- Table 36: China Elemental Industry Volume (K Unit) Forecast, by Application 2019 & 2032
- Table 37: Japan Elemental Industry Revenue (Million) Forecast, by Application 2019 & 2032
- Table 38: Japan Elemental Industry Volume (K Unit) Forecast, by Application 2019 & 2032
- Table 39: India Elemental Industry Revenue (Million) Forecast, by Application 2019 & 2032
- Table 40: India Elemental Industry Volume (K Unit) Forecast, by Application 2019 & 2032
- Table 41: Australia Elemental Industry Revenue (Million) Forecast, by Application 2019 & 2032
- Table 42: Australia Elemental Industry Volume (K Unit) Forecast, by Application 2019 & 2032
- Table 43: South Korea Elemental Industry Revenue (Million) Forecast, by Application 2019 & 2032
- Table 44: South Korea Elemental Industry Volume (K Unit) Forecast, by Application 2019 & 2032
- Table 45: Rest of Asia Pacific Elemental Industry Revenue (Million) Forecast, by Application 2019 & 2032
- Table 46: Rest of Asia Pacific Elemental Industry Volume (K Unit) Forecast, by Application 2019 & 2032
- Table 47: Global Elemental Industry Revenue Million Forecast, by Country 2019 & 2032
- Table 48: Global Elemental Industry Volume K Unit Forecast, by Country 2019 & 2032
- Table 49: GCC Elemental Industry Revenue (Million) Forecast, by Application 2019 & 2032
- Table 50: GCC Elemental Industry Volume (K Unit) Forecast, by Application 2019 & 2032
- Table 51: South Africa Elemental Industry Revenue (Million) Forecast, by Application 2019 & 2032
- Table 52: South Africa Elemental Industry Volume (K Unit) Forecast, by Application 2019 & 2032
- Table 53: Rest of Middle East and Africa Elemental Industry Revenue (Million) Forecast, by Application 2019 & 2032
- Table 54: Rest of Middle East and Africa Elemental Industry Volume (K Unit) Forecast, by Application 2019 & 2032
- Table 55: Global Elemental Industry Revenue Million Forecast, by Country 2019 & 2032
- Table 56: Global Elemental Industry Volume K Unit Forecast, by Country 2019 & 2032
- Table 57: Brazil Elemental Industry Revenue (Million) Forecast, by Application 2019 & 2032
- Table 58: Brazil Elemental Industry Volume (K Unit) Forecast, by Application 2019 & 2032
- Table 59: Argentina Elemental Industry Revenue (Million) Forecast, by Application 2019 & 2032
- Table 60: Argentina Elemental Industry Volume (K Unit) Forecast, by Application 2019 & 2032
- Table 61: Rest of South America Elemental Industry Revenue (Million) Forecast, by Application 2019 & 2032
- Table 62: Rest of South America Elemental Industry Volume (K Unit) Forecast, by Application 2019 & 2032
- Table 63: Global Elemental Industry Revenue Million Forecast, by Type 2019 & 2032
- Table 64: Global Elemental Industry Volume K Unit Forecast, by Type 2019 & 2032
- Table 65: Global Elemental Industry Revenue Million Forecast, by Technology 2019 & 2032
- Table 66: Global Elemental Industry Volume K Unit Forecast, by Technology 2019 & 2032
- Table 67: Global Elemental Industry Revenue Million Forecast, by End User 2019 & 2032
- Table 68: Global Elemental Industry Volume K Unit Forecast, by End User 2019 & 2032
- Table 69: Global Elemental Industry Revenue Million Forecast, by Country 2019 & 2032
- Table 70: Global Elemental Industry Volume K Unit Forecast, by Country 2019 & 2032
- Table 71: United States Elemental Industry Revenue (Million) Forecast, by Application 2019 & 2032
- Table 72: United States Elemental Industry Volume (K Unit) Forecast, by Application 2019 & 2032
- Table 73: Canada Elemental Industry Revenue (Million) Forecast, by Application 2019 & 2032
- Table 74: Canada Elemental Industry Volume (K Unit) Forecast, by Application 2019 & 2032
- Table 75: Mexico Elemental Industry Revenue (Million) Forecast, by Application 2019 & 2032
- Table 76: Mexico Elemental Industry Volume (K Unit) Forecast, by Application 2019 & 2032
- Table 77: Global Elemental Industry Revenue Million Forecast, by Type 2019 & 2032
- Table 78: Global Elemental Industry Volume K Unit Forecast, by Type 2019 & 2032
- Table 79: Global Elemental Industry Revenue Million Forecast, by Technology 2019 & 2032
- Table 80: Global Elemental Industry Volume K Unit Forecast, by Technology 2019 & 2032
- Table 81: Global Elemental Industry Revenue Million Forecast, by End User 2019 & 2032
- Table 82: Global Elemental Industry Volume K Unit Forecast, by End User 2019 & 2032
- Table 83: Global Elemental Industry Revenue Million Forecast, by Country 2019 & 2032
- Table 84: Global Elemental Industry Volume K Unit Forecast, by Country 2019 & 2032
- Table 85: Germany Elemental Industry Revenue (Million) Forecast, by Application 2019 & 2032
- Table 86: Germany Elemental Industry Volume (K Unit) Forecast, by Application 2019 & 2032
- Table 87: United Kingdom Elemental Industry Revenue (Million) Forecast, by Application 2019 & 2032
- Table 88: United Kingdom Elemental Industry Volume (K Unit) Forecast, by Application 2019 & 2032
- Table 89: France Elemental Industry Revenue (Million) Forecast, by Application 2019 & 2032
- Table 90: France Elemental Industry Volume (K Unit) Forecast, by Application 2019 & 2032
- Table 91: Italy Elemental Industry Revenue (Million) Forecast, by Application 2019 & 2032
- Table 92: Italy Elemental Industry Volume (K Unit) Forecast, by Application 2019 & 2032
- Table 93: Spain Elemental Industry Revenue (Million) Forecast, by Application 2019 & 2032
- Table 94: Spain Elemental Industry Volume (K Unit) Forecast, by Application 2019 & 2032
- Table 95: Rest of Europe Elemental Industry Revenue (Million) Forecast, by Application 2019 & 2032
- Table 96: Rest of Europe Elemental Industry Volume (K Unit) Forecast, by Application 2019 & 2032
- Table 97: Global Elemental Industry Revenue Million Forecast, by Type 2019 & 2032
- Table 98: Global Elemental Industry Volume K Unit Forecast, by Type 2019 & 2032
- Table 99: Global Elemental Industry Revenue Million Forecast, by Technology 2019 & 2032
- Table 100: Global Elemental Industry Volume K Unit Forecast, by Technology 2019 & 2032
- Table 101: Global Elemental Industry Revenue Million Forecast, by End User 2019 & 2032
- Table 102: Global Elemental Industry Volume K Unit Forecast, by End User 2019 & 2032
- Table 103: Global Elemental Industry Revenue Million Forecast, by Country 2019 & 2032
- Table 104: Global Elemental Industry Volume K Unit Forecast, by Country 2019 & 2032
- Table 105: China Elemental Industry Revenue (Million) Forecast, by Application 2019 & 2032
- Table 106: China Elemental Industry Volume (K Unit) Forecast, by Application 2019 & 2032
- Table 107: Japan Elemental Industry Revenue (Million) Forecast, by Application 2019 & 2032
- Table 108: Japan Elemental Industry Volume (K Unit) Forecast, by Application 2019 & 2032
- Table 109: India Elemental Industry Revenue (Million) Forecast, by Application 2019 & 2032
- Table 110: India Elemental Industry Volume (K Unit) Forecast, by Application 2019 & 2032
- Table 111: Australia Elemental Industry Revenue (Million) Forecast, by Application 2019 & 2032
- Table 112: Australia Elemental Industry Volume (K Unit) Forecast, by Application 2019 & 2032
- Table 113: South Korea Elemental Industry Revenue (Million) Forecast, by Application 2019 & 2032
- Table 114: South Korea Elemental Industry Volume (K Unit) Forecast, by Application 2019 & 2032
- Table 115: Rest of Asia Pacific Elemental Industry Revenue (Million) Forecast, by Application 2019 & 2032
- Table 116: Rest of Asia Pacific Elemental Industry Volume (K Unit) Forecast, by Application 2019 & 2032
- Table 117: Global Elemental Industry Revenue Million Forecast, by Type 2019 & 2032
- Table 118: Global Elemental Industry Volume K Unit Forecast, by Type 2019 & 2032
- Table 119: Global Elemental Industry Revenue Million Forecast, by Technology 2019 & 2032
- Table 120: Global Elemental Industry Volume K Unit Forecast, by Technology 2019 & 2032
- Table 121: Global Elemental Industry Revenue Million Forecast, by End User 2019 & 2032
- Table 122: Global Elemental Industry Volume K Unit Forecast, by End User 2019 & 2032
- Table 123: Global Elemental Industry Revenue Million Forecast, by Country 2019 & 2032
- Table 124: Global Elemental Industry Volume K Unit Forecast, by Country 2019 & 2032
- Table 125: GCC Elemental Industry Revenue (Million) Forecast, by Application 2019 & 2032
- Table 126: GCC Elemental Industry Volume (K Unit) Forecast, by Application 2019 & 2032
- Table 127: South Africa Elemental Industry Revenue (Million) Forecast, by Application 2019 & 2032
- Table 128: South Africa Elemental Industry Volume (K Unit) Forecast, by Application 2019 & 2032
- Table 129: Rest of Middle East and Africa Elemental Industry Revenue (Million) Forecast, by Application 2019 & 2032
- Table 130: Rest of Middle East and Africa Elemental Industry Volume (K Unit) Forecast, by Application 2019 & 2032
- Table 131: Global Elemental Industry Revenue Million Forecast, by Type 2019 & 2032
- Table 132: Global Elemental Industry Volume K Unit Forecast, by Type 2019 & 2032
- Table 133: Global Elemental Industry Revenue Million Forecast, by Technology 2019 & 2032
- Table 134: Global Elemental Industry Volume K Unit Forecast, by Technology 2019 & 2032
- Table 135: Global Elemental Industry Revenue Million Forecast, by End User 2019 & 2032
- Table 136: Global Elemental Industry Volume K Unit Forecast, by End User 2019 & 2032
- Table 137: Global Elemental Industry Revenue Million Forecast, by Country 2019 & 2032
- Table 138: Global Elemental Industry Volume K Unit Forecast, by Country 2019 & 2032
- Table 139: Brazil Elemental Industry Revenue (Million) Forecast, by Application 2019 & 2032
- Table 140: Brazil Elemental Industry Volume (K Unit) Forecast, by Application 2019 & 2032
- Table 141: Argentina Elemental Industry Revenue (Million) Forecast, by Application 2019 & 2032
- Table 142: Argentina Elemental Industry Volume (K Unit) Forecast, by Application 2019 & 2032
- Table 143: Rest of South America Elemental Industry Revenue (Million) Forecast, by Application 2019 & 2032
- Table 144: Rest of South America Elemental Industry Volume (K Unit) Forecast, by Application 2019 & 2032
Frequently Asked Questions
1. What is the projected Compound Annual Growth Rate (CAGR) of the Elemental Industry?
The projected CAGR is approximately 6.20%.
2. Which companies are prominent players in the Elemental Industry?
Key companies in the market include Verder Scientific GmbH & Co KG (ELTRA GmbH), HORIBA Ltd, Analytik Jena GmbH+Co KG, Eurofins Scientific, Thermo Fisher Scientific Inc, Bruker, Agilent Technologies Inc, Elemental Analysis Inc, PerkinElmer Inc, Angstrom Advanced Inc, Shimadzu Corporation, Rigaku Corporation.
3. What are the main segments of the Elemental Industry?
The market segments include Type, Technology, End User.
4. Can you provide details about the market size?
The market size is estimated to be USD XX Million as of 2022.
5. What are some drivers contributing to market growth?
Growing R&D Funding in Life Sciences; Mandating Government Regulations for Elemental Analysis of Pharmaceutical and Healthcare Products.
6. What are the notable trends driving market growth?
Inorganic Elemental Analysis Dominate the Global Elemental Analysis Market During the Forecast Period.
7. Are there any restraints impacting market growth?
Lack of Skilled Personnel.
8. Can you provide examples of recent developments in the market?
In July 2022, SPECTRO Analytical Instruments launched the SPECTROMAXx LMX10 arc/spark OES analyzer for elemental analysis in metal-producing and fabricating plants and iron and non-ferrous foundries. The LMX10 has new advancements, including complete new factory calibrations, extended calibration ranges and element selections, optimized source excitation parameters, and improved limits of detection (LODs).
9. What pricing options are available for accessing the report?
Pricing options include single-user, multi-user, and enterprise licenses priced at USD 4750, USD 5250, and USD 8750 respectively.
10. Is the market size provided in terms of value or volume?
The market size is provided in terms of value, measured in Million and volume, measured in K Unit.
11. Are there any specific market keywords associated with the report?
Yes, the market keyword associated with the report is "Elemental Industry," which aids in identifying and referencing the specific market segment covered.
12. How do I determine which pricing option suits my needs best?
The pricing options vary based on user requirements and access needs. Individual users may opt for single-user licenses, while businesses requiring broader access may choose multi-user or enterprise licenses for cost-effective access to the report.
13. Are there any additional resources or data provided in the Elemental Industry report?
While the report offers comprehensive insights, it's advisable to review the specific contents or supplementary materials provided to ascertain if additional resources or data are available.
14. How can I stay updated on further developments or reports in the Elemental Industry?
To stay informed about further developments, trends, and reports in the Elemental Industry, consider subscribing to industry newsletters, following relevant companies and organizations, or regularly checking reputable industry news sources and publications.
Methodology
Step 1 - Identification of Relevant Samples Size from Population Database


Step 2 - Approaches for Defining Global Market Size (Value, Volume* & Price*)

Note*: In applicable scenarios
Step 3 - Data Sources
Primary Research
- Web Analytics
- Survey Reports
- Research Institute
- Latest Research Reports
- Opinion Leaders
Secondary Research
- Annual Reports
- White Paper
- Latest Press Release
- Industry Association
- Paid Database
- Investor Presentations

Step 4 - Data Triangulation
Involves using different sources of information in order to increase the validity of a study
These sources are likely to be stakeholders in a program - participants, other researchers, program staff, other community members, and so on.
Then we put all data in single framework & apply various statistical tools to find out the dynamic on the market.
During the analysis stage, feedback from the stakeholder groups would be compared to determine areas of agreement as well as areas of divergence
