

Key Insights
The Disaster Recovery as a Service (DRAAS) market is experiencing robust growth, driven by the increasing need for robust business continuity and disaster recovery plans among organizations of all sizes. The market's compound annual growth rate (CAGR) of 12.32% from 2019 to 2024 indicates a significant upward trajectory, projected to continue through 2033. This growth is fueled by several key factors. The rising adoption of cloud computing, coupled with increasing cyber threats and regulatory compliance mandates, is pushing businesses to adopt DRaaS solutions for data protection and business continuity. Furthermore, the scalability and cost-effectiveness of DRaaS compared to traditional on-premise solutions are proving highly attractive. Key end-user verticals driving market expansion include BFSI (Banking, Financial Services, and Insurance), IT, Government, and Healthcare, all of which are highly sensitive to data loss and require stringent recovery capabilities. The competitive landscape is dynamic, with a mix of established players like IBM and Microsoft, along with specialized DRaaS providers like TierPoint and Flexential. Regional growth is expected to be geographically diverse, with North America and Europe maintaining significant market share, while Asia-Pacific is projected to demonstrate rapid expansion due to increasing digitalization and cloud adoption across developing economies. While some restraints might exist due to initial implementation complexities or security concerns, the overall market outlook remains positive, reflecting a strong ongoing demand for reliable and efficient disaster recovery solutions.
The future of the DRaaS market promises continued innovation and expansion. We can anticipate more sophisticated solutions incorporating artificial intelligence (AI) and machine learning (ML) for enhanced automation and predictive capabilities. The integration of DRaaS with other cloud-based services will further improve efficiency and reduce overall costs. Furthermore, the growing adoption of hybrid and multi-cloud strategies will likely lead to increased demand for DRaaS solutions that support diverse cloud environments. The expanding regulatory landscape, particularly concerning data privacy and security, will also continue to drive the adoption of compliant DRaaS solutions. Competition among providers is expected to remain intense, resulting in continuous innovation and improvements in service offerings, pricing, and customer support. The geographical expansion of DRaaS services into emerging markets will further contribute to the overall growth of the industry. Ultimately, the DRaaS market is poised for sustained growth driven by the increasing reliance on digital infrastructure and the imperative for robust business continuity.
DRAAS Industry Market Report: 2019-2033
This comprehensive report provides an in-depth analysis of the Disaster Recovery as a Service (DRaaS) industry, forecasting robust growth and highlighting key market trends from 2019 to 2033. With a focus on market composition, technological advancements, and leading players, this report is an invaluable resource for stakeholders seeking to understand and capitalize on the burgeoning DRaaS landscape. The report incorporates data from the historical period (2019-2024), uses 2025 as the base and estimated year, and projects market trends until 2033. The total market value is predicted to reach xx Million by 2033.
DRAAS Industry Market Composition & Trends
This section evaluates the competitive landscape, innovation drivers, regulatory factors, and market dynamics within the DRaaS industry. We analyze market concentration, identifying key players and their respective market share distribution. The report also delves into the impact of mergers and acquisitions (M&A) activities, analyzing deal values and their influence on market consolidation. Innovation catalysts, such as advancements in cloud technology and evolving cybersecurity threats, are examined alongside the regulatory landscape and its influence on DRaaS adoption. Finally, the report profiles end-users across various verticals, providing insights into their DRaaS needs and preferences.
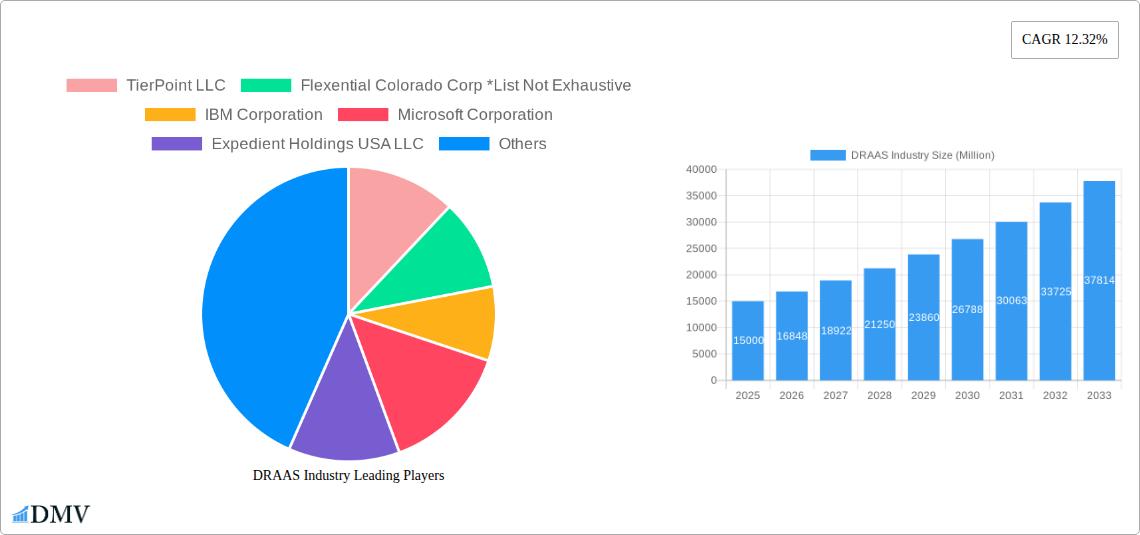
- Market Concentration: The DRaaS market exhibits a moderately concentrated structure, with a few major players holding significant market share. The top 5 players are estimated to collectively control xx% of the market in 2025.
- M&A Activity: The historical period (2019-2024) witnessed significant M&A activity, with total deal values exceeding xx Million. This consolidation is expected to continue, driving further market concentration. Examples include the February 2022 acquisition of Global Data Vault by Dataprise.
- Innovation Catalysts: Advancements in cloud computing, virtualization, and automation are key drivers of innovation in the DRaaS market. The increasing sophistication of cyberattacks fuels demand for robust DRaaS solutions.
- Regulatory Landscape: Data privacy regulations like GDPR and CCPA significantly influence DRaaS adoption, creating a demand for compliant solutions.
- Substitute Products: Traditional on-premise disaster recovery solutions remain a substitute, but their limitations in scalability and cost-effectiveness are driving migration to DRaaS.
DRAAS Industry Evolution
This section analyzes the trajectory of the DRaaS market, examining growth rates, technological advancements, and shifting consumer demands. The report presents a detailed analysis of market growth, highlighting key milestones and inflection points. Technological advancements, such as the integration of AI and machine learning for automated recovery and improved RPO/RTO (Recovery Point Objective/Recovery Time Objective), are analyzed for their impact on market evolution. We also explore the evolving needs of consumers, noting a growing preference for cloud-based, scalable, and cost-effective solutions.
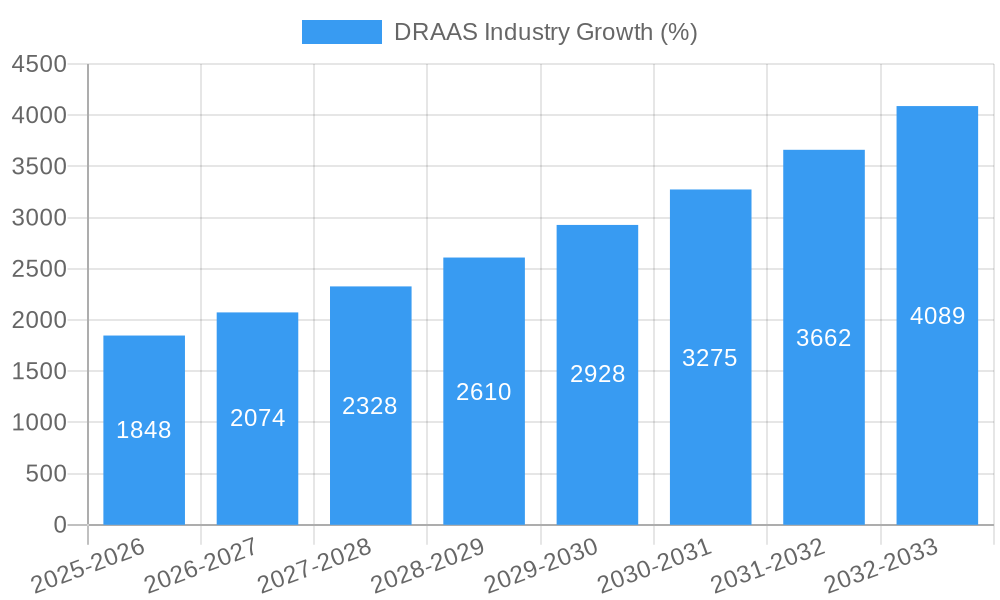
The DRaaS market experienced a Compound Annual Growth Rate (CAGR) of xx% during the historical period (2019-2024). We project a CAGR of xx% during the forecast period (2025-2033), driven by factors such as increasing cloud adoption, growing cybersecurity concerns, and rising demand for business continuity solutions. Adoption rates are expected to increase significantly across all end-user verticals. The market is expected to reach xx Million by 2033.
Leading Regions, Countries, or Segments in DRAAS Industry
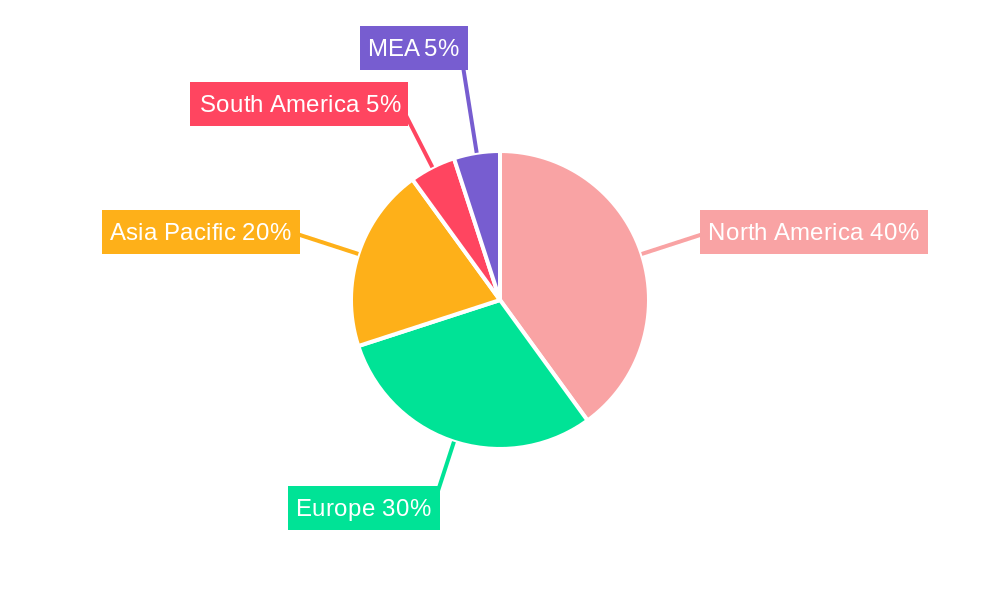
This section identifies the dominant regions, countries, and end-user segments within the DRaaS market. The report provides a detailed analysis of the factors driving market dominance in each segment, including investment trends, regulatory support, and technological adoption rates. North America currently holds the largest market share due to high cloud adoption and stringent data protection regulations.
- Key Drivers for North American Dominance:
- High levels of cloud infrastructure investment.
- Stringent data privacy and security regulations.
- Strong presence of major DRaaS providers.
- BFSI Segment: The BFSI (Banking, Financial Services, and Insurance) sector is a significant adopter of DRaaS due to stringent regulatory compliance requirements and the need for high availability of financial services.
- IT Segment: The IT sector exhibits high DRaaS adoption due to its reliance on critical data and applications.
DRAAS Industry Product Innovations
Recent advancements in DRaaS have focused on improved automation, reduced RPO/RTO, and enhanced security features. The integration of AI and machine learning enables intelligent monitoring and automated failover, minimizing downtime. Innovative solutions offer features such as application-aware recovery, granular recovery options, and enhanced security functionalities, including encryption and access controls. Unique selling propositions include customized solutions, superior customer support, and comprehensive service level agreements (SLAs).
Propelling Factors for DRAAS Industry Growth
Several factors contribute to the rapid growth of the DRaaS market. Technological advancements, like automation and AI-driven recovery, enhance efficiency and reduce costs. The increasing frequency and severity of cyberattacks drive demand for robust data protection solutions. Stringent data privacy regulations also fuel the adoption of compliant DRaaS solutions. Economic factors, such as the decreasing cost of cloud computing, make DRaaS more accessible to organizations of all sizes.
Obstacles in the DRAAS Industry Market
Despite the promising outlook, the DRaaS market faces certain challenges. Regulatory compliance requirements across different geographies can be complex and costly. Supply chain disruptions can impact the availability of resources, potentially affecting service delivery. Intense competition among established players and new entrants creates price pressures and necessitates continuous innovation. These factors can collectively impact market growth by xx% in the next 5 years.
Future Opportunities in DRAAS Industry
Future opportunities lie in expanding into emerging markets, particularly in developing economies with growing digitalization. The integration of new technologies, such as blockchain for enhanced security, offers further growth potential. Meeting evolving consumer demands for greater flexibility, scalability, and cost optimization will drive innovation and market expansion. Furthermore, specialized DRaaS solutions tailored to specific industry needs, like healthcare and IoT, present significant untapped opportunities.
Major Players in the DRAAS Industry Ecosystem
- TierPoint LLC
- Flexential Colorado Corp
- IBM Corporation
- Microsoft Corporation
- Expedient Holdings USA LLC
- Cloudhpt
- Recovery Point Systems Inc
- Phoenixnap LLC
- C and W Business Ltd
- Intervision Systems LLC
- Evolve IP LLC
- iLand Internet Solutions Corporation
- Sungard Availability Services LP
Key Developments in DRAAS Industry Industry
- November 2022: CyberFortress launched 24/7 live support for its managed data backup and recovery products and services, including Managed DRaaS powered by Veeam. This enhances customer support and strengthens its competitive positioning.
- February 2022: Otava's VMware-validated cloud-based Disaster Recovery solution achieved VMware certification, strengthening its market credibility and appeal to VMware users. Its low RPO (as low as five minutes) is a key differentiator.
- February 2022: The acquisition of Global Data Vault by Dataprise expanded Dataprise's data protection and cybersecurity portfolio, increasing its market share and service offerings.
Strategic DRAAS Industry Market Forecast
The DRaaS market is poised for sustained growth, driven by increasing digital transformation, growing cybersecurity threats, and the rising demand for robust business continuity solutions. The expansion into emerging markets and the integration of innovative technologies, such as AI and blockchain, will further fuel market expansion. We project significant market growth over the forecast period (2025-2033), with xx Million in total revenue predicted by 2033. This presents considerable opportunities for existing players and new entrants alike.
DRAAS Industry Segmentation
-
1. End-user Vertical
- 1.1. BFSI
- 1.2. IT
- 1.3. Government
- 1.4. Healthcare
- 1.5. Other End-user Verticals
DRAAS Industry Segmentation By Geography
- 1. North America
- 2. Europe
- 3. Asia Pacific
- 4. Rest of the World
DRAAS Industry REPORT HIGHLIGHTS
| Aspects | Details |
|---|---|
| Study Period | 2019-2033 |
| Base Year | 2024 |
| Estimated Year | 2025 |
| Forecast Period | 2025-2033 |
| Historical Period | 2019-2024 |
| Growth Rate | CAGR of 12.32% from 2019-2033 |
| Segmentation |
|
Table of Contents
- 1. Introduction
- 1.1. Research Scope
- 1.2. Market Segmentation
- 1.3. Research Methodology
- 1.4. Definitions and Assumptions
- 2. Executive Summary
- 2.1. Introduction
- 3. Market Dynamics
- 3.1. Introduction
- 3.2. Market Drivers
- 3.2.1. Increasing Data Breach and Ransomware Attacks Creating a Need For Robust Data Protection Solutions; Reducing Operational Cost of DRaaS Solutions Compared to Traditional Solutions
- 3.3. Market Restrains
- 3.3.1. Complexity of Deployment and Setting Terms
- 3.4. Market Trends
- 3.4.1. The BFSI Sector is Driving the Market
- 4. Market Factor Analysis
- 4.1. Porters Five Forces
- 4.2. Supply/Value Chain
- 4.3. PESTEL analysis
- 4.4. Market Entropy
- 4.5. Patent/Trademark Analysis
- 5. Global DRAAS Industry Analysis, Insights and Forecast, 2019-2031
- 5.1. Market Analysis, Insights and Forecast - by End-user Vertical
- 5.1.1. BFSI
- 5.1.2. IT
- 5.1.3. Government
- 5.1.4. Healthcare
- 5.1.5. Other End-user Verticals
- 5.2. Market Analysis, Insights and Forecast - by Region
- 5.2.1. North America
- 5.2.2. Europe
- 5.2.3. Asia Pacific
- 5.2.4. Rest of the World
- 5.1. Market Analysis, Insights and Forecast - by End-user Vertical
- 6. North America DRAAS Industry Analysis, Insights and Forecast, 2019-2031
- 6.1. Market Analysis, Insights and Forecast - by End-user Vertical
- 6.1.1. BFSI
- 6.1.2. IT
- 6.1.3. Government
- 6.1.4. Healthcare
- 6.1.5. Other End-user Verticals
- 6.1. Market Analysis, Insights and Forecast - by End-user Vertical
- 7. Europe DRAAS Industry Analysis, Insights and Forecast, 2019-2031
- 7.1. Market Analysis, Insights and Forecast - by End-user Vertical
- 7.1.1. BFSI
- 7.1.2. IT
- 7.1.3. Government
- 7.1.4. Healthcare
- 7.1.5. Other End-user Verticals
- 7.1. Market Analysis, Insights and Forecast - by End-user Vertical
- 8. Asia Pacific DRAAS Industry Analysis, Insights and Forecast, 2019-2031
- 8.1. Market Analysis, Insights and Forecast - by End-user Vertical
- 8.1.1. BFSI
- 8.1.2. IT
- 8.1.3. Government
- 8.1.4. Healthcare
- 8.1.5. Other End-user Verticals
- 8.1. Market Analysis, Insights and Forecast - by End-user Vertical
- 9. Rest of the World DRAAS Industry Analysis, Insights and Forecast, 2019-2031
- 9.1. Market Analysis, Insights and Forecast - by End-user Vertical
- 9.1.1. BFSI
- 9.1.2. IT
- 9.1.3. Government
- 9.1.4. Healthcare
- 9.1.5. Other End-user Verticals
- 9.1. Market Analysis, Insights and Forecast - by End-user Vertical
- 10. North America DRAAS Industry Analysis, Insights and Forecast, 2019-2031
- 10.1. Market Analysis, Insights and Forecast - By Country/Sub-region
- 10.1.1 United States
- 10.1.2 Canada
- 10.1.3 Mexico
- 11. Europe DRAAS Industry Analysis, Insights and Forecast, 2019-2031
- 11.1. Market Analysis, Insights and Forecast - By Country/Sub-region
- 11.1.1 Germany
- 11.1.2 United Kingdom
- 11.1.3 France
- 11.1.4 Spain
- 11.1.5 Italy
- 11.1.6 Spain
- 11.1.7 Belgium
- 11.1.8 Netherland
- 11.1.9 Nordics
- 11.1.10 Rest of Europe
- 12. Asia Pacific DRAAS Industry Analysis, Insights and Forecast, 2019-2031
- 12.1. Market Analysis, Insights and Forecast - By Country/Sub-region
- 12.1.1 China
- 12.1.2 Japan
- 12.1.3 India
- 12.1.4 South Korea
- 12.1.5 Southeast Asia
- 12.1.6 Australia
- 12.1.7 Indonesia
- 12.1.8 Phillipes
- 12.1.9 Singapore
- 12.1.10 Thailandc
- 12.1.11 Rest of Asia Pacific
- 13. South America DRAAS Industry Analysis, Insights and Forecast, 2019-2031
- 13.1. Market Analysis, Insights and Forecast - By Country/Sub-region
- 13.1.1 Brazil
- 13.1.2 Argentina
- 13.1.3 Peru
- 13.1.4 Chile
- 13.1.5 Colombia
- 13.1.6 Ecuador
- 13.1.7 Venezuela
- 13.1.8 Rest of South America
- 14. North America DRAAS Industry Analysis, Insights and Forecast, 2019-2031
- 14.1. Market Analysis, Insights and Forecast - By Country/Sub-region
- 14.1.1 United States
- 14.1.2 Canada
- 14.1.3 Mexico
- 15. MEA DRAAS Industry Analysis, Insights and Forecast, 2019-2031
- 15.1. Market Analysis, Insights and Forecast - By Country/Sub-region
- 15.1.1 United Arab Emirates
- 15.1.2 Saudi Arabia
- 15.1.3 South Africa
- 15.1.4 Rest of Middle East and Africa
- 16. Competitive Analysis
- 16.1. Global Market Share Analysis 2024
- 16.2. Company Profiles
- 16.2.1 TierPoint LLC
- 16.2.1.1. Overview
- 16.2.1.2. Products
- 16.2.1.3. SWOT Analysis
- 16.2.1.4. Recent Developments
- 16.2.1.5. Financials (Based on Availability)
- 16.2.2 Flexential Colorado Corp *List Not Exhaustive
- 16.2.2.1. Overview
- 16.2.2.2. Products
- 16.2.2.3. SWOT Analysis
- 16.2.2.4. Recent Developments
- 16.2.2.5. Financials (Based on Availability)
- 16.2.3 IBM Corporation
- 16.2.3.1. Overview
- 16.2.3.2. Products
- 16.2.3.3. SWOT Analysis
- 16.2.3.4. Recent Developments
- 16.2.3.5. Financials (Based on Availability)
- 16.2.4 Microsoft Corporation
- 16.2.4.1. Overview
- 16.2.4.2. Products
- 16.2.4.3. SWOT Analysis
- 16.2.4.4. Recent Developments
- 16.2.4.5. Financials (Based on Availability)
- 16.2.5 Expedient Holdings USA LLC
- 16.2.5.1. Overview
- 16.2.5.2. Products
- 16.2.5.3. SWOT Analysis
- 16.2.5.4. Recent Developments
- 16.2.5.5. Financials (Based on Availability)
- 16.2.6 Cloudhpt
- 16.2.6.1. Overview
- 16.2.6.2. Products
- 16.2.6.3. SWOT Analysis
- 16.2.6.4. Recent Developments
- 16.2.6.5. Financials (Based on Availability)
- 16.2.7 Recovery Point Systems Inc
- 16.2.7.1. Overview
- 16.2.7.2. Products
- 16.2.7.3. SWOT Analysis
- 16.2.7.4. Recent Developments
- 16.2.7.5. Financials (Based on Availability)
- 16.2.8 Phoenixnap LLC
- 16.2.8.1. Overview
- 16.2.8.2. Products
- 16.2.8.3. SWOT Analysis
- 16.2.8.4. Recent Developments
- 16.2.8.5. Financials (Based on Availability)
- 16.2.9 C and W Business Ltd
- 16.2.9.1. Overview
- 16.2.9.2. Products
- 16.2.9.3. SWOT Analysis
- 16.2.9.4. Recent Developments
- 16.2.9.5. Financials (Based on Availability)
- 16.2.10 Intervision Systems LLC
- 16.2.10.1. Overview
- 16.2.10.2. Products
- 16.2.10.3. SWOT Analysis
- 16.2.10.4. Recent Developments
- 16.2.10.5. Financials (Based on Availability)
- 16.2.11 Evolve IP LLC
- 16.2.11.1. Overview
- 16.2.11.2. Products
- 16.2.11.3. SWOT Analysis
- 16.2.11.4. Recent Developments
- 16.2.11.5. Financials (Based on Availability)
- 16.2.12 iLand Internet Solutions Corporation
- 16.2.12.1. Overview
- 16.2.12.2. Products
- 16.2.12.3. SWOT Analysis
- 16.2.12.4. Recent Developments
- 16.2.12.5. Financials (Based on Availability)
- 16.2.13 Sungard Availability Services LP
- 16.2.13.1. Overview
- 16.2.13.2. Products
- 16.2.13.3. SWOT Analysis
- 16.2.13.4. Recent Developments
- 16.2.13.5. Financials (Based on Availability)
- 16.2.1 TierPoint LLC
List of Figures
- Figure 1: Global DRAAS Industry Revenue Breakdown (Million, %) by Region 2024 & 2032
- Figure 2: North America DRAAS Industry Revenue (Million), by Country 2024 & 2032
- Figure 3: North America DRAAS Industry Revenue Share (%), by Country 2024 & 2032
- Figure 4: Europe DRAAS Industry Revenue (Million), by Country 2024 & 2032
- Figure 5: Europe DRAAS Industry Revenue Share (%), by Country 2024 & 2032
- Figure 6: Asia Pacific DRAAS Industry Revenue (Million), by Country 2024 & 2032
- Figure 7: Asia Pacific DRAAS Industry Revenue Share (%), by Country 2024 & 2032
- Figure 8: South America DRAAS Industry Revenue (Million), by Country 2024 & 2032
- Figure 9: South America DRAAS Industry Revenue Share (%), by Country 2024 & 2032
- Figure 10: North America DRAAS Industry Revenue (Million), by Country 2024 & 2032
- Figure 11: North America DRAAS Industry Revenue Share (%), by Country 2024 & 2032
- Figure 12: MEA DRAAS Industry Revenue (Million), by Country 2024 & 2032
- Figure 13: MEA DRAAS Industry Revenue Share (%), by Country 2024 & 2032
- Figure 14: North America DRAAS Industry Revenue (Million), by End-user Vertical 2024 & 2032
- Figure 15: North America DRAAS Industry Revenue Share (%), by End-user Vertical 2024 & 2032
- Figure 16: North America DRAAS Industry Revenue (Million), by Country 2024 & 2032
- Figure 17: North America DRAAS Industry Revenue Share (%), by Country 2024 & 2032
- Figure 18: Europe DRAAS Industry Revenue (Million), by End-user Vertical 2024 & 2032
- Figure 19: Europe DRAAS Industry Revenue Share (%), by End-user Vertical 2024 & 2032
- Figure 20: Europe DRAAS Industry Revenue (Million), by Country 2024 & 2032
- Figure 21: Europe DRAAS Industry Revenue Share (%), by Country 2024 & 2032
- Figure 22: Asia Pacific DRAAS Industry Revenue (Million), by End-user Vertical 2024 & 2032
- Figure 23: Asia Pacific DRAAS Industry Revenue Share (%), by End-user Vertical 2024 & 2032
- Figure 24: Asia Pacific DRAAS Industry Revenue (Million), by Country 2024 & 2032
- Figure 25: Asia Pacific DRAAS Industry Revenue Share (%), by Country 2024 & 2032
- Figure 26: Rest of the World DRAAS Industry Revenue (Million), by End-user Vertical 2024 & 2032
- Figure 27: Rest of the World DRAAS Industry Revenue Share (%), by End-user Vertical 2024 & 2032
- Figure 28: Rest of the World DRAAS Industry Revenue (Million), by Country 2024 & 2032
- Figure 29: Rest of the World DRAAS Industry Revenue Share (%), by Country 2024 & 2032
List of Tables
- Table 1: Global DRAAS Industry Revenue Million Forecast, by Region 2019 & 2032
- Table 2: Global DRAAS Industry Revenue Million Forecast, by End-user Vertical 2019 & 2032
- Table 3: Global DRAAS Industry Revenue Million Forecast, by Region 2019 & 2032
- Table 4: Global DRAAS Industry Revenue Million Forecast, by Country 2019 & 2032
- Table 5: United States DRAAS Industry Revenue (Million) Forecast, by Application 2019 & 2032
- Table 6: Canada DRAAS Industry Revenue (Million) Forecast, by Application 2019 & 2032
- Table 7: Mexico DRAAS Industry Revenue (Million) Forecast, by Application 2019 & 2032
- Table 8: Global DRAAS Industry Revenue Million Forecast, by Country 2019 & 2032
- Table 9: Germany DRAAS Industry Revenue (Million) Forecast, by Application 2019 & 2032
- Table 10: United Kingdom DRAAS Industry Revenue (Million) Forecast, by Application 2019 & 2032
- Table 11: France DRAAS Industry Revenue (Million) Forecast, by Application 2019 & 2032
- Table 12: Spain DRAAS Industry Revenue (Million) Forecast, by Application 2019 & 2032
- Table 13: Italy DRAAS Industry Revenue (Million) Forecast, by Application 2019 & 2032
- Table 14: Spain DRAAS Industry Revenue (Million) Forecast, by Application 2019 & 2032
- Table 15: Belgium DRAAS Industry Revenue (Million) Forecast, by Application 2019 & 2032
- Table 16: Netherland DRAAS Industry Revenue (Million) Forecast, by Application 2019 & 2032
- Table 17: Nordics DRAAS Industry Revenue (Million) Forecast, by Application 2019 & 2032
- Table 18: Rest of Europe DRAAS Industry Revenue (Million) Forecast, by Application 2019 & 2032
- Table 19: Global DRAAS Industry Revenue Million Forecast, by Country 2019 & 2032
- Table 20: China DRAAS Industry Revenue (Million) Forecast, by Application 2019 & 2032
- Table 21: Japan DRAAS Industry Revenue (Million) Forecast, by Application 2019 & 2032
- Table 22: India DRAAS Industry Revenue (Million) Forecast, by Application 2019 & 2032
- Table 23: South Korea DRAAS Industry Revenue (Million) Forecast, by Application 2019 & 2032
- Table 24: Southeast Asia DRAAS Industry Revenue (Million) Forecast, by Application 2019 & 2032
- Table 25: Australia DRAAS Industry Revenue (Million) Forecast, by Application 2019 & 2032
- Table 26: Indonesia DRAAS Industry Revenue (Million) Forecast, by Application 2019 & 2032
- Table 27: Phillipes DRAAS Industry Revenue (Million) Forecast, by Application 2019 & 2032
- Table 28: Singapore DRAAS Industry Revenue (Million) Forecast, by Application 2019 & 2032
- Table 29: Thailandc DRAAS Industry Revenue (Million) Forecast, by Application 2019 & 2032
- Table 30: Rest of Asia Pacific DRAAS Industry Revenue (Million) Forecast, by Application 2019 & 2032
- Table 31: Global DRAAS Industry Revenue Million Forecast, by Country 2019 & 2032
- Table 32: Brazil DRAAS Industry Revenue (Million) Forecast, by Application 2019 & 2032
- Table 33: Argentina DRAAS Industry Revenue (Million) Forecast, by Application 2019 & 2032
- Table 34: Peru DRAAS Industry Revenue (Million) Forecast, by Application 2019 & 2032
- Table 35: Chile DRAAS Industry Revenue (Million) Forecast, by Application 2019 & 2032
- Table 36: Colombia DRAAS Industry Revenue (Million) Forecast, by Application 2019 & 2032
- Table 37: Ecuador DRAAS Industry Revenue (Million) Forecast, by Application 2019 & 2032
- Table 38: Venezuela DRAAS Industry Revenue (Million) Forecast, by Application 2019 & 2032
- Table 39: Rest of South America DRAAS Industry Revenue (Million) Forecast, by Application 2019 & 2032
- Table 40: Global DRAAS Industry Revenue Million Forecast, by Country 2019 & 2032
- Table 41: United States DRAAS Industry Revenue (Million) Forecast, by Application 2019 & 2032
- Table 42: Canada DRAAS Industry Revenue (Million) Forecast, by Application 2019 & 2032
- Table 43: Mexico DRAAS Industry Revenue (Million) Forecast, by Application 2019 & 2032
- Table 44: Global DRAAS Industry Revenue Million Forecast, by Country 2019 & 2032
- Table 45: United Arab Emirates DRAAS Industry Revenue (Million) Forecast, by Application 2019 & 2032
- Table 46: Saudi Arabia DRAAS Industry Revenue (Million) Forecast, by Application 2019 & 2032
- Table 47: South Africa DRAAS Industry Revenue (Million) Forecast, by Application 2019 & 2032
- Table 48: Rest of Middle East and Africa DRAAS Industry Revenue (Million) Forecast, by Application 2019 & 2032
- Table 49: Global DRAAS Industry Revenue Million Forecast, by End-user Vertical 2019 & 2032
- Table 50: Global DRAAS Industry Revenue Million Forecast, by Country 2019 & 2032
- Table 51: Global DRAAS Industry Revenue Million Forecast, by End-user Vertical 2019 & 2032
- Table 52: Global DRAAS Industry Revenue Million Forecast, by Country 2019 & 2032
- Table 53: Global DRAAS Industry Revenue Million Forecast, by End-user Vertical 2019 & 2032
- Table 54: Global DRAAS Industry Revenue Million Forecast, by Country 2019 & 2032
- Table 55: Global DRAAS Industry Revenue Million Forecast, by End-user Vertical 2019 & 2032
- Table 56: Global DRAAS Industry Revenue Million Forecast, by Country 2019 & 2032
Frequently Asked Questions
1. What is the projected Compound Annual Growth Rate (CAGR) of the DRAAS Industry?
The projected CAGR is approximately 12.32%.
2. Which companies are prominent players in the DRAAS Industry?
Key companies in the market include TierPoint LLC, Flexential Colorado Corp *List Not Exhaustive, IBM Corporation, Microsoft Corporation, Expedient Holdings USA LLC, Cloudhpt, Recovery Point Systems Inc, Phoenixnap LLC, C and W Business Ltd, Intervision Systems LLC, Evolve IP LLC, iLand Internet Solutions Corporation, Sungard Availability Services LP.
3. What are the main segments of the DRAAS Industry?
The market segments include End-user Vertical.
4. Can you provide details about the market size?
The market size is estimated to be USD XX Million as of 2022.
5. What are some drivers contributing to market growth?
Increasing Data Breach and Ransomware Attacks Creating a Need For Robust Data Protection Solutions; Reducing Operational Cost of DRaaS Solutions Compared to Traditional Solutions.
6. What are the notable trends driving market growth?
The BFSI Sector is Driving the Market.
7. Are there any restraints impacting market growth?
Complexity of Deployment and Setting Terms.
8. Can you provide examples of recent developments in the market?
November 2022: CyberFortress, a managed data backup built to prevent business disruption through a rapid recovery provider, announced the launch of the company's 247 live support for all backup and recovery products and services. The company provides a complete suite of solutions and services, including Managed DRaaS powered by Veeam.
9. What pricing options are available for accessing the report?
Pricing options include single-user, multi-user, and enterprise licenses priced at USD 4750, USD 5250, and USD 8750 respectively.
10. Is the market size provided in terms of value or volume?
The market size is provided in terms of value, measured in Million.
11. Are there any specific market keywords associated with the report?
Yes, the market keyword associated with the report is "DRAAS Industry," which aids in identifying and referencing the specific market segment covered.
12. How do I determine which pricing option suits my needs best?
The pricing options vary based on user requirements and access needs. Individual users may opt for single-user licenses, while businesses requiring broader access may choose multi-user or enterprise licenses for cost-effective access to the report.
13. Are there any additional resources or data provided in the DRAAS Industry report?
While the report offers comprehensive insights, it's advisable to review the specific contents or supplementary materials provided to ascertain if additional resources or data are available.
14. How can I stay updated on further developments or reports in the DRAAS Industry?
To stay informed about further developments, trends, and reports in the DRAAS Industry, consider subscribing to industry newsletters, following relevant companies and organizations, or regularly checking reputable industry news sources and publications.
Methodology
Step 1 - Identification of Relevant Samples Size from Population Database


Step 2 - Approaches for Defining Global Market Size (Value, Volume* & Price*)

Note*: In applicable scenarios
Step 3 - Data Sources
Primary Research
- Web Analytics
- Survey Reports
- Research Institute
- Latest Research Reports
- Opinion Leaders
Secondary Research
- Annual Reports
- White Paper
- Latest Press Release
- Industry Association
- Paid Database
- Investor Presentations

Step 4 - Data Triangulation
Involves using different sources of information in order to increase the validity of a study
These sources are likely to be stakeholders in a program - participants, other researchers, program staff, other community members, and so on.
Then we put all data in single framework & apply various statistical tools to find out the dynamic on the market.
During the analysis stage, feedback from the stakeholder groups would be compared to determine areas of agreement as well as areas of divergence
