

Key Insights
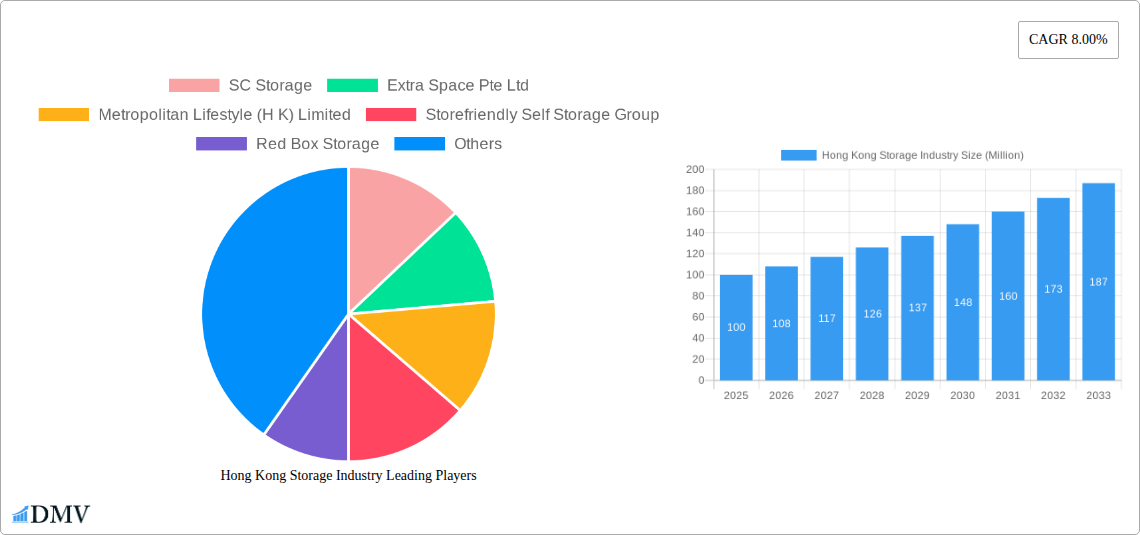
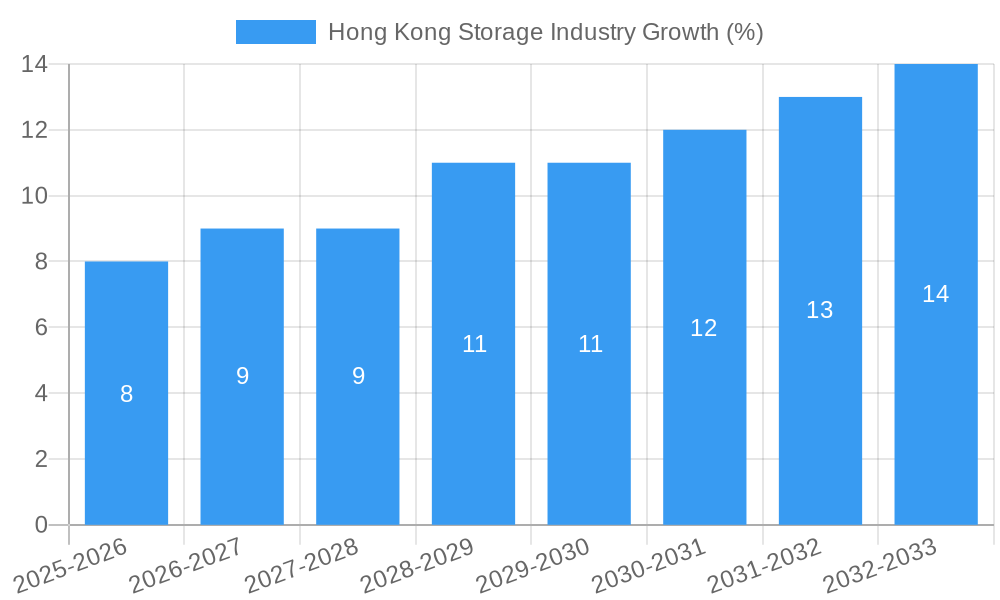
The Hong Kong self-storage market, valued at approximately $XX million in 2025, is experiencing robust growth, projected to expand at a compound annual growth rate (CAGR) of 8.00% from 2025 to 2033. This growth is fueled by several key factors. The increasing urbanization and high population density in Hong Kong contribute to limited living space, driving demand for off-site storage solutions for both personal and business needs. Furthermore, the thriving e-commerce sector and the rise of small and medium-sized enterprises (SMEs) necessitate efficient inventory management and warehousing solutions, boosting the demand for self-storage facilities. The market's segmentation into personal and business users reflects the diverse applications of self-storage. The competitive landscape is characterized by a mix of established players like SC Storage, Extra Space Pte Ltd, and Metropolitan Lifestyle (H K) Limited, alongside smaller operators. These companies are constantly innovating to cater to evolving customer needs, offering diverse unit sizes, flexible lease terms, and enhanced security features.
However, the market also faces certain challenges. High land prices in Hong Kong can increase operational costs for storage facilities. Stringent regulations and building codes can limit the expansion and development of new storage units, potentially hindering market growth. Despite these constraints, the long-term outlook for the Hong Kong self-storage industry remains positive. Continued urbanization, evolving lifestyles, and the expansion of the business sector are expected to fuel consistent demand, ensuring market expansion throughout the forecast period (2025-2033). Strategic partnerships and technological advancements, such as online booking platforms and automated storage systems, will further enhance market competitiveness and accessibility.
Hong Kong Storage Industry: Market Report 2019-2033
This comprehensive report provides an in-depth analysis of the Hong Kong storage industry, encompassing market size, trends, competitive landscape, and future projections from 2019 to 2033. With a base year of 2025 and a forecast period spanning 2025-2033, this study is an essential resource for investors, industry players, and strategic decision-makers seeking to understand and capitalize on the opportunities within this dynamic sector. The report leverages extensive primary and secondary research, incorporating data on market share, M&A activities, and technological advancements to deliver actionable insights. The total market value is predicted to reach xx Million by 2033.
Hong Kong Storage Industry Market Composition & Trends
This section dissects the Hong Kong storage market's structure, analyzing key dynamics influencing its evolution. The market exhibits a moderately concentrated landscape, with several major players vying for market share. The top five operators—including SC Storage, Extra Space Pte Ltd, and Storefriendly Self Storage Group—currently hold an estimated xx% of the overall market, while numerous smaller players account for the remaining share. Innovation is largely driven by technological advancements in storage solutions, such as climate-controlled units and enhanced security systems. Regulatory frameworks, while generally supportive, continue to evolve, impacting operational costs and expansion strategies. Substitute products such as cloud storage partially compete, while the overall industry benefits from Hong Kong's dense population and limited living space. M&A activity has increased significantly in recent years, as evidenced by the USD 72 Million acquisition detailed later in this report.
- Market Share Distribution (2024): SC Storage (xx%), Extra Space Pte Ltd (xx%), Storefriendly Self Storage Group (xx%), Others (xx%).
- Average M&A Deal Value (2019-2024): USD xx Million
- Key Regulatory Factors: Land use policies, building codes, and environmental regulations.
- End-User Segmentation: Primarily split between Personal (xx%) and Business (xx%) storage needs.
Hong Kong Storage Industry Industry Evolution
The Hong Kong storage industry has experienced significant growth since 2019, driven by several factors. The historical period (2019-2024) witnessed a Compound Annual Growth Rate (CAGR) of xx%, with substantial expansion expected in the forecast period (2025-2033). Technological advancements, including online booking platforms, automated storage retrieval systems, and enhanced security features, have significantly improved efficiency and customer experience. Changing consumer demands, particularly among younger demographics, have fueled demand for flexible, short-term rental options. The increasing adoption of self-storage as a solution for business needs, such as inventory management and document archiving, also contributes to overall market expansion. The industry's growth trajectory is further strengthened by increasing urbanization and a limited housing supply, leading to greater demand for offsite storage solutions.
Leading Regions, Countries, or Segments in Hong Kong Storage Industry
Within Hong Kong, the most dominant segment is Personal storage, driven by limited living space in densely populated areas and increased adoption of minimalist lifestyles. This is further fueled by growing e-commerce activity and associated needs for inventory management. Business storage is also experiencing healthy growth, supported by the rising number of small and medium-sized enterprises (SMEs) and their need for efficient storage solutions.
- Key Drivers for Personal Storage:
- High population density and limited living space.
- Increasing popularity of minimalist living.
- Growing e-commerce adoption leading to increased parcel volumes.
- Key Drivers for Business Storage:
- Expansion of SMEs and startups.
- Need for efficient inventory and document management.
- Greater flexibility and cost-effectiveness compared to traditional warehousing.
Hong Kong Storage Industry Product Innovations
Recent innovations have focused on enhancing customer convenience and security. This includes the introduction of climate-controlled units to protect temperature-sensitive goods, improved security measures such as 24/7 surveillance and access control systems, and user-friendly online booking and management platforms. Value-added services such as packing supplies and delivery options are also becoming increasingly prevalent, enhancing the overall customer experience and creating a competitive advantage.
Propelling Factors for Hong Kong Storage Industry Growth
Several factors contribute to the industry's robust growth. Technological advancements, particularly in online booking and management systems, have streamlined operations and improved customer experience. The burgeoning e-commerce sector fuels demand for storage space for inventory and logistics. Furthermore, government initiatives aimed at improving infrastructure and supporting business development indirectly contribute to the growth of the storage sector.
Obstacles in the Hong Kong Storage Industry Market
The primary challenges faced by the industry include high land costs in Hong Kong, which constrain expansion and increase operating costs. Competition from existing and new entrants can put pressure on pricing and profitability. The availability of skilled labor can also be a factor, especially as the industry seeks to adopt more advanced technologies. Supply chain disruptions, a global issue, impact the availability of materials and construction timelines.
Future Opportunities in Hong Kong Storage Industry
The future holds promising opportunities for growth, particularly with the increased adoption of technology. Expansion into niche markets, such as specialized storage for artwork or valuable items, offers potential. Strategic partnerships with logistics providers and e-commerce companies can unlock new avenues for growth. Exploring innovative pricing models, such as subscription-based services, can attract a broader customer base.
Major Players in the Hong Kong Storage Industry Ecosystem
- SC Storage
- Extra Space Pte Ltd
- Metropolitan Lifestyle (H K) Limited
- Storefriendly Self Storage Group
- Red Box Storage
- Boxful Self Storage
- Cube Self Storage
- Apple Storage (tai Yau Storage Group Limited)
- Spacebox Limited
- In N Out Storage
- Hongkong Storage
- Storhub Self Storage
Key Developments in Hong Kong Storage Industry Industry
- April 2023: Storefriendly launched two new locations on Hong Kong Island and in the New Territories. This expansion significantly increased their market presence and capacity.
- December 2023: A joint venture between Blackstone and StoreFriendly acquired an industrial building in Tsuen Wan for HKD 560 million (USD 72 million), planning to convert it into a self-storage facility. This acquisition highlights the substantial investment in the sector.
Strategic Hong Kong Storage Industry Market Forecast
The Hong Kong storage market is poised for continued growth over the forecast period, fueled by urbanization, technological advancements, and evolving consumer preferences. The increasing demand for flexible and convenient storage solutions, coupled with strategic investments and acquisitions, indicates a strong market outlook with significant potential for further expansion and innovation. The market is expected to maintain a healthy CAGR of xx% throughout the forecast period, reaching a projected value of xx Million by 2033.
Hong Kong Storage Industry Segmentation
-
1. End User
- 1.1. Personal
- 1.2. Business
Hong Kong Storage Industry Segmentation By Geography
-
1. North America
- 1.1. United States
- 1.2. Canada
- 1.3. Mexico
-
2. South America
- 2.1. Brazil
- 2.2. Argentina
- 2.3. Rest of South America
-
3. Europe
- 3.1. United Kingdom
- 3.2. Germany
- 3.3. France
- 3.4. Italy
- 3.5. Spain
- 3.6. Russia
- 3.7. Benelux
- 3.8. Nordics
- 3.9. Rest of Europe
-
4. Middle East & Africa
- 4.1. Turkey
- 4.2. Israel
- 4.3. GCC
- 4.4. North Africa
- 4.5. South Africa
- 4.6. Rest of Middle East & Africa
-
5. Asia Pacific
- 5.1. China
- 5.2. India
- 5.3. Japan
- 5.4. South Korea
- 5.5. ASEAN
- 5.6. Oceania
- 5.7. Rest of Asia Pacific
Hong Kong Storage Industry REPORT HIGHLIGHTS
| Aspects | Details |
|---|---|
| Study Period | 2019-2033 |
| Base Year | 2024 |
| Estimated Year | 2025 |
| Forecast Period | 2025-2033 |
| Historical Period | 2019-2024 |
| Growth Rate | CAGR of 8.00% from 2019-2033 |
| Segmentation |
|
Table of Contents
- 1. Introduction
- 1.1. Research Scope
- 1.2. Market Segmentation
- 1.3. Research Methodology
- 1.4. Definitions and Assumptions
- 2. Executive Summary
- 2.1. Introduction
- 3. Market Dynamics
- 3.1. Introduction
- 3.2. Market Drivers
- 3.2.1. Growing Population Density is the Key Driver of the Market
- 3.3. Market Restrains
- 3.3.1. Lack of Enough Space to Build Self-storage Facilities
- 3.4. Market Trends
- 3.4.1. Personal Segment is Expected to Drive the Market
- 4. Market Factor Analysis
- 4.1. Porters Five Forces
- 4.2. Supply/Value Chain
- 4.3. PESTEL analysis
- 4.4. Market Entropy
- 4.5. Patent/Trademark Analysis
- 5. Global Hong Kong Storage Industry Analysis, Insights and Forecast, 2019-2031
- 5.1. Market Analysis, Insights and Forecast - by End User
- 5.1.1. Personal
- 5.1.2. Business
- 5.2. Market Analysis, Insights and Forecast - by Region
- 5.2.1. North America
- 5.2.2. South America
- 5.2.3. Europe
- 5.2.4. Middle East & Africa
- 5.2.5. Asia Pacific
- 5.1. Market Analysis, Insights and Forecast - by End User
- 6. North America Hong Kong Storage Industry Analysis, Insights and Forecast, 2019-2031
- 6.1. Market Analysis, Insights and Forecast - by End User
- 6.1.1. Personal
- 6.1.2. Business
- 6.1. Market Analysis, Insights and Forecast - by End User
- 7. South America Hong Kong Storage Industry Analysis, Insights and Forecast, 2019-2031
- 7.1. Market Analysis, Insights and Forecast - by End User
- 7.1.1. Personal
- 7.1.2. Business
- 7.1. Market Analysis, Insights and Forecast - by End User
- 8. Europe Hong Kong Storage Industry Analysis, Insights and Forecast, 2019-2031
- 8.1. Market Analysis, Insights and Forecast - by End User
- 8.1.1. Personal
- 8.1.2. Business
- 8.1. Market Analysis, Insights and Forecast - by End User
- 9. Middle East & Africa Hong Kong Storage Industry Analysis, Insights and Forecast, 2019-2031
- 9.1. Market Analysis, Insights and Forecast - by End User
- 9.1.1. Personal
- 9.1.2. Business
- 9.1. Market Analysis, Insights and Forecast - by End User
- 10. Asia Pacific Hong Kong Storage Industry Analysis, Insights and Forecast, 2019-2031
- 10.1. Market Analysis, Insights and Forecast - by End User
- 10.1.1. Personal
- 10.1.2. Business
- 10.1. Market Analysis, Insights and Forecast - by End User
- 11. Competitive Analysis
- 11.1. Global Market Share Analysis 2024
- 11.2. Company Profiles
- 11.2.1 SC Storage
- 11.2.1.1. Overview
- 11.2.1.2. Products
- 11.2.1.3. SWOT Analysis
- 11.2.1.4. Recent Developments
- 11.2.1.5. Financials (Based on Availability)
- 11.2.2 Extra Space Pte Ltd
- 11.2.2.1. Overview
- 11.2.2.2. Products
- 11.2.2.3. SWOT Analysis
- 11.2.2.4. Recent Developments
- 11.2.2.5. Financials (Based on Availability)
- 11.2.3 Metropolitan Lifestyle (H K) Limited
- 11.2.3.1. Overview
- 11.2.3.2. Products
- 11.2.3.3. SWOT Analysis
- 11.2.3.4. Recent Developments
- 11.2.3.5. Financials (Based on Availability)
- 11.2.4 Storefriendly Self Storage Group
- 11.2.4.1. Overview
- 11.2.4.2. Products
- 11.2.4.3. SWOT Analysis
- 11.2.4.4. Recent Developments
- 11.2.4.5. Financials (Based on Availability)
- 11.2.5 Red Box Storage
- 11.2.5.1. Overview
- 11.2.5.2. Products
- 11.2.5.3. SWOT Analysis
- 11.2.5.4. Recent Developments
- 11.2.5.5. Financials (Based on Availability)
- 11.2.6 Boxful Self Storage
- 11.2.6.1. Overview
- 11.2.6.2. Products
- 11.2.6.3. SWOT Analysis
- 11.2.6.4. Recent Developments
- 11.2.6.5. Financials (Based on Availability)
- 11.2.7 Cube Self Storage
- 11.2.7.1. Overview
- 11.2.7.2. Products
- 11.2.7.3. SWOT Analysis
- 11.2.7.4. Recent Developments
- 11.2.7.5. Financials (Based on Availability)
- 11.2.8 Apple Storage (tai Yau Storage Group Limited)
- 11.2.8.1. Overview
- 11.2.8.2. Products
- 11.2.8.3. SWOT Analysis
- 11.2.8.4. Recent Developments
- 11.2.8.5. Financials (Based on Availability)
- 11.2.9 Spacebox Limited
- 11.2.9.1. Overview
- 11.2.9.2. Products
- 11.2.9.3. SWOT Analysis
- 11.2.9.4. Recent Developments
- 11.2.9.5. Financials (Based on Availability)
- 11.2.10 In N Out Storage
- 11.2.10.1. Overview
- 11.2.10.2. Products
- 11.2.10.3. SWOT Analysis
- 11.2.10.4. Recent Developments
- 11.2.10.5. Financials (Based on Availability)
- 11.2.11 Hongkong Storage
- 11.2.11.1. Overview
- 11.2.11.2. Products
- 11.2.11.3. SWOT Analysis
- 11.2.11.4. Recent Developments
- 11.2.11.5. Financials (Based on Availability)
- 11.2.12 Storhub Self Storage*List Not Exhaustive
- 11.2.12.1. Overview
- 11.2.12.2. Products
- 11.2.12.3. SWOT Analysis
- 11.2.12.4. Recent Developments
- 11.2.12.5. Financials (Based on Availability)
- 11.2.1 SC Storage
List of Figures
- Figure 1: Global Hong Kong Storage Industry Revenue Breakdown (Million, %) by Region 2024 & 2032
- Figure 2: Global Hong Kong Storage Industry Volume Breakdown (Million, %) by Region 2024 & 2032
- Figure 3: Hong Kong Hong Kong Storage Industry Revenue (Million), by Country 2024 & 2032
- Figure 4: Hong Kong Hong Kong Storage Industry Volume (Million), by Country 2024 & 2032
- Figure 5: Hong Kong Hong Kong Storage Industry Revenue Share (%), by Country 2024 & 2032
- Figure 6: Hong Kong Hong Kong Storage Industry Volume Share (%), by Country 2024 & 2032
- Figure 7: North America Hong Kong Storage Industry Revenue (Million), by End User 2024 & 2032
- Figure 8: North America Hong Kong Storage Industry Volume (Million), by End User 2024 & 2032
- Figure 9: North America Hong Kong Storage Industry Revenue Share (%), by End User 2024 & 2032
- Figure 10: North America Hong Kong Storage Industry Volume Share (%), by End User 2024 & 2032
- Figure 11: North America Hong Kong Storage Industry Revenue (Million), by Country 2024 & 2032
- Figure 12: North America Hong Kong Storage Industry Volume (Million), by Country 2024 & 2032
- Figure 13: North America Hong Kong Storage Industry Revenue Share (%), by Country 2024 & 2032
- Figure 14: North America Hong Kong Storage Industry Volume Share (%), by Country 2024 & 2032
- Figure 15: South America Hong Kong Storage Industry Revenue (Million), by End User 2024 & 2032
- Figure 16: South America Hong Kong Storage Industry Volume (Million), by End User 2024 & 2032
- Figure 17: South America Hong Kong Storage Industry Revenue Share (%), by End User 2024 & 2032
- Figure 18: South America Hong Kong Storage Industry Volume Share (%), by End User 2024 & 2032
- Figure 19: South America Hong Kong Storage Industry Revenue (Million), by Country 2024 & 2032
- Figure 20: South America Hong Kong Storage Industry Volume (Million), by Country 2024 & 2032
- Figure 21: South America Hong Kong Storage Industry Revenue Share (%), by Country 2024 & 2032
- Figure 22: South America Hong Kong Storage Industry Volume Share (%), by Country 2024 & 2032
- Figure 23: Europe Hong Kong Storage Industry Revenue (Million), by End User 2024 & 2032
- Figure 24: Europe Hong Kong Storage Industry Volume (Million), by End User 2024 & 2032
- Figure 25: Europe Hong Kong Storage Industry Revenue Share (%), by End User 2024 & 2032
- Figure 26: Europe Hong Kong Storage Industry Volume Share (%), by End User 2024 & 2032
- Figure 27: Europe Hong Kong Storage Industry Revenue (Million), by Country 2024 & 2032
- Figure 28: Europe Hong Kong Storage Industry Volume (Million), by Country 2024 & 2032
- Figure 29: Europe Hong Kong Storage Industry Revenue Share (%), by Country 2024 & 2032
- Figure 30: Europe Hong Kong Storage Industry Volume Share (%), by Country 2024 & 2032
- Figure 31: Middle East & Africa Hong Kong Storage Industry Revenue (Million), by End User 2024 & 2032
- Figure 32: Middle East & Africa Hong Kong Storage Industry Volume (Million), by End User 2024 & 2032
- Figure 33: Middle East & Africa Hong Kong Storage Industry Revenue Share (%), by End User 2024 & 2032
- Figure 34: Middle East & Africa Hong Kong Storage Industry Volume Share (%), by End User 2024 & 2032
- Figure 35: Middle East & Africa Hong Kong Storage Industry Revenue (Million), by Country 2024 & 2032
- Figure 36: Middle East & Africa Hong Kong Storage Industry Volume (Million), by Country 2024 & 2032
- Figure 37: Middle East & Africa Hong Kong Storage Industry Revenue Share (%), by Country 2024 & 2032
- Figure 38: Middle East & Africa Hong Kong Storage Industry Volume Share (%), by Country 2024 & 2032
- Figure 39: Asia Pacific Hong Kong Storage Industry Revenue (Million), by End User 2024 & 2032
- Figure 40: Asia Pacific Hong Kong Storage Industry Volume (Million), by End User 2024 & 2032
- Figure 41: Asia Pacific Hong Kong Storage Industry Revenue Share (%), by End User 2024 & 2032
- Figure 42: Asia Pacific Hong Kong Storage Industry Volume Share (%), by End User 2024 & 2032
- Figure 43: Asia Pacific Hong Kong Storage Industry Revenue (Million), by Country 2024 & 2032
- Figure 44: Asia Pacific Hong Kong Storage Industry Volume (Million), by Country 2024 & 2032
- Figure 45: Asia Pacific Hong Kong Storage Industry Revenue Share (%), by Country 2024 & 2032
- Figure 46: Asia Pacific Hong Kong Storage Industry Volume Share (%), by Country 2024 & 2032
List of Tables
- Table 1: Global Hong Kong Storage Industry Revenue Million Forecast, by Region 2019 & 2032
- Table 2: Global Hong Kong Storage Industry Volume Million Forecast, by Region 2019 & 2032
- Table 3: Global Hong Kong Storage Industry Revenue Million Forecast, by End User 2019 & 2032
- Table 4: Global Hong Kong Storage Industry Volume Million Forecast, by End User 2019 & 2032
- Table 5: Global Hong Kong Storage Industry Revenue Million Forecast, by Region 2019 & 2032
- Table 6: Global Hong Kong Storage Industry Volume Million Forecast, by Region 2019 & 2032
- Table 7: Global Hong Kong Storage Industry Revenue Million Forecast, by Country 2019 & 2032
- Table 8: Global Hong Kong Storage Industry Volume Million Forecast, by Country 2019 & 2032
- Table 9: Global Hong Kong Storage Industry Revenue Million Forecast, by End User 2019 & 2032
- Table 10: Global Hong Kong Storage Industry Volume Million Forecast, by End User 2019 & 2032
- Table 11: Global Hong Kong Storage Industry Revenue Million Forecast, by Country 2019 & 2032
- Table 12: Global Hong Kong Storage Industry Volume Million Forecast, by Country 2019 & 2032
- Table 13: United States Hong Kong Storage Industry Revenue (Million) Forecast, by Application 2019 & 2032
- Table 14: United States Hong Kong Storage Industry Volume (Million) Forecast, by Application 2019 & 2032
- Table 15: Canada Hong Kong Storage Industry Revenue (Million) Forecast, by Application 2019 & 2032
- Table 16: Canada Hong Kong Storage Industry Volume (Million) Forecast, by Application 2019 & 2032
- Table 17: Mexico Hong Kong Storage Industry Revenue (Million) Forecast, by Application 2019 & 2032
- Table 18: Mexico Hong Kong Storage Industry Volume (Million) Forecast, by Application 2019 & 2032
- Table 19: Global Hong Kong Storage Industry Revenue Million Forecast, by End User 2019 & 2032
- Table 20: Global Hong Kong Storage Industry Volume Million Forecast, by End User 2019 & 2032
- Table 21: Global Hong Kong Storage Industry Revenue Million Forecast, by Country 2019 & 2032
- Table 22: Global Hong Kong Storage Industry Volume Million Forecast, by Country 2019 & 2032
- Table 23: Brazil Hong Kong Storage Industry Revenue (Million) Forecast, by Application 2019 & 2032
- Table 24: Brazil Hong Kong Storage Industry Volume (Million) Forecast, by Application 2019 & 2032
- Table 25: Argentina Hong Kong Storage Industry Revenue (Million) Forecast, by Application 2019 & 2032
- Table 26: Argentina Hong Kong Storage Industry Volume (Million) Forecast, by Application 2019 & 2032
- Table 27: Rest of South America Hong Kong Storage Industry Revenue (Million) Forecast, by Application 2019 & 2032
- Table 28: Rest of South America Hong Kong Storage Industry Volume (Million) Forecast, by Application 2019 & 2032
- Table 29: Global Hong Kong Storage Industry Revenue Million Forecast, by End User 2019 & 2032
- Table 30: Global Hong Kong Storage Industry Volume Million Forecast, by End User 2019 & 2032
- Table 31: Global Hong Kong Storage Industry Revenue Million Forecast, by Country 2019 & 2032
- Table 32: Global Hong Kong Storage Industry Volume Million Forecast, by Country 2019 & 2032
- Table 33: United Kingdom Hong Kong Storage Industry Revenue (Million) Forecast, by Application 2019 & 2032
- Table 34: United Kingdom Hong Kong Storage Industry Volume (Million) Forecast, by Application 2019 & 2032
- Table 35: Germany Hong Kong Storage Industry Revenue (Million) Forecast, by Application 2019 & 2032
- Table 36: Germany Hong Kong Storage Industry Volume (Million) Forecast, by Application 2019 & 2032
- Table 37: France Hong Kong Storage Industry Revenue (Million) Forecast, by Application 2019 & 2032
- Table 38: France Hong Kong Storage Industry Volume (Million) Forecast, by Application 2019 & 2032
- Table 39: Italy Hong Kong Storage Industry Revenue (Million) Forecast, by Application 2019 & 2032
- Table 40: Italy Hong Kong Storage Industry Volume (Million) Forecast, by Application 2019 & 2032
- Table 41: Spain Hong Kong Storage Industry Revenue (Million) Forecast, by Application 2019 & 2032
- Table 42: Spain Hong Kong Storage Industry Volume (Million) Forecast, by Application 2019 & 2032
- Table 43: Russia Hong Kong Storage Industry Revenue (Million) Forecast, by Application 2019 & 2032
- Table 44: Russia Hong Kong Storage Industry Volume (Million) Forecast, by Application 2019 & 2032
- Table 45: Benelux Hong Kong Storage Industry Revenue (Million) Forecast, by Application 2019 & 2032
- Table 46: Benelux Hong Kong Storage Industry Volume (Million) Forecast, by Application 2019 & 2032
- Table 47: Nordics Hong Kong Storage Industry Revenue (Million) Forecast, by Application 2019 & 2032
- Table 48: Nordics Hong Kong Storage Industry Volume (Million) Forecast, by Application 2019 & 2032
- Table 49: Rest of Europe Hong Kong Storage Industry Revenue (Million) Forecast, by Application 2019 & 2032
- Table 50: Rest of Europe Hong Kong Storage Industry Volume (Million) Forecast, by Application 2019 & 2032
- Table 51: Global Hong Kong Storage Industry Revenue Million Forecast, by End User 2019 & 2032
- Table 52: Global Hong Kong Storage Industry Volume Million Forecast, by End User 2019 & 2032
- Table 53: Global Hong Kong Storage Industry Revenue Million Forecast, by Country 2019 & 2032
- Table 54: Global Hong Kong Storage Industry Volume Million Forecast, by Country 2019 & 2032
- Table 55: Turkey Hong Kong Storage Industry Revenue (Million) Forecast, by Application 2019 & 2032
- Table 56: Turkey Hong Kong Storage Industry Volume (Million) Forecast, by Application 2019 & 2032
- Table 57: Israel Hong Kong Storage Industry Revenue (Million) Forecast, by Application 2019 & 2032
- Table 58: Israel Hong Kong Storage Industry Volume (Million) Forecast, by Application 2019 & 2032
- Table 59: GCC Hong Kong Storage Industry Revenue (Million) Forecast, by Application 2019 & 2032
- Table 60: GCC Hong Kong Storage Industry Volume (Million) Forecast, by Application 2019 & 2032
- Table 61: North Africa Hong Kong Storage Industry Revenue (Million) Forecast, by Application 2019 & 2032
- Table 62: North Africa Hong Kong Storage Industry Volume (Million) Forecast, by Application 2019 & 2032
- Table 63: South Africa Hong Kong Storage Industry Revenue (Million) Forecast, by Application 2019 & 2032
- Table 64: South Africa Hong Kong Storage Industry Volume (Million) Forecast, by Application 2019 & 2032
- Table 65: Rest of Middle East & Africa Hong Kong Storage Industry Revenue (Million) Forecast, by Application 2019 & 2032
- Table 66: Rest of Middle East & Africa Hong Kong Storage Industry Volume (Million) Forecast, by Application 2019 & 2032
- Table 67: Global Hong Kong Storage Industry Revenue Million Forecast, by End User 2019 & 2032
- Table 68: Global Hong Kong Storage Industry Volume Million Forecast, by End User 2019 & 2032
- Table 69: Global Hong Kong Storage Industry Revenue Million Forecast, by Country 2019 & 2032
- Table 70: Global Hong Kong Storage Industry Volume Million Forecast, by Country 2019 & 2032
- Table 71: China Hong Kong Storage Industry Revenue (Million) Forecast, by Application 2019 & 2032
- Table 72: China Hong Kong Storage Industry Volume (Million) Forecast, by Application 2019 & 2032
- Table 73: India Hong Kong Storage Industry Revenue (Million) Forecast, by Application 2019 & 2032
- Table 74: India Hong Kong Storage Industry Volume (Million) Forecast, by Application 2019 & 2032
- Table 75: Japan Hong Kong Storage Industry Revenue (Million) Forecast, by Application 2019 & 2032
- Table 76: Japan Hong Kong Storage Industry Volume (Million) Forecast, by Application 2019 & 2032
- Table 77: South Korea Hong Kong Storage Industry Revenue (Million) Forecast, by Application 2019 & 2032
- Table 78: South Korea Hong Kong Storage Industry Volume (Million) Forecast, by Application 2019 & 2032
- Table 79: ASEAN Hong Kong Storage Industry Revenue (Million) Forecast, by Application 2019 & 2032
- Table 80: ASEAN Hong Kong Storage Industry Volume (Million) Forecast, by Application 2019 & 2032
- Table 81: Oceania Hong Kong Storage Industry Revenue (Million) Forecast, by Application 2019 & 2032
- Table 82: Oceania Hong Kong Storage Industry Volume (Million) Forecast, by Application 2019 & 2032
- Table 83: Rest of Asia Pacific Hong Kong Storage Industry Revenue (Million) Forecast, by Application 2019 & 2032
- Table 84: Rest of Asia Pacific Hong Kong Storage Industry Volume (Million) Forecast, by Application 2019 & 2032
Frequently Asked Questions
1. What is the projected Compound Annual Growth Rate (CAGR) of the Hong Kong Storage Industry?
The projected CAGR is approximately 8.00%.
2. Which companies are prominent players in the Hong Kong Storage Industry?
Key companies in the market include SC Storage, Extra Space Pte Ltd, Metropolitan Lifestyle (H K) Limited, Storefriendly Self Storage Group, Red Box Storage, Boxful Self Storage, Cube Self Storage, Apple Storage (tai Yau Storage Group Limited), Spacebox Limited, In N Out Storage, Hongkong Storage, Storhub Self Storage*List Not Exhaustive.
3. What are the main segments of the Hong Kong Storage Industry?
The market segments include End User.
4. Can you provide details about the market size?
The market size is estimated to be USD XX Million as of 2022.
5. What are some drivers contributing to market growth?
Growing Population Density is the Key Driver of the Market.
6. What are the notable trends driving market growth?
Personal Segment is Expected to Drive the Market.
7. Are there any restraints impacting market growth?
Lack of Enough Space to Build Self-storage Facilities.
8. Can you provide examples of recent developments in the market?
April 2023 - Storefriendly, the Asia self-storage operator backed by investment giant Blackstone, recently introduced its two latest locations at redeveloped properties on Hong Kong Island and in the New Territories.
9. What pricing options are available for accessing the report?
Pricing options include single-user, multi-user, and enterprise licenses priced at USD 3800, USD 4500, and USD 5800 respectively.
10. Is the market size provided in terms of value or volume?
The market size is provided in terms of value, measured in Million and volume, measured in Million.
11. Are there any specific market keywords associated with the report?
Yes, the market keyword associated with the report is "Hong Kong Storage Industry," which aids in identifying and referencing the specific market segment covered.
12. How do I determine which pricing option suits my needs best?
The pricing options vary based on user requirements and access needs. Individual users may opt for single-user licenses, while businesses requiring broader access may choose multi-user or enterprise licenses for cost-effective access to the report.
13. Are there any additional resources or data provided in the Hong Kong Storage Industry report?
While the report offers comprehensive insights, it's advisable to review the specific contents or supplementary materials provided to ascertain if additional resources or data are available.
14. How can I stay updated on further developments or reports in the Hong Kong Storage Industry?
To stay informed about further developments, trends, and reports in the Hong Kong Storage Industry, consider subscribing to industry newsletters, following relevant companies and organizations, or regularly checking reputable industry news sources and publications.
Methodology
Step 1 - Identification of Relevant Samples Size from Population Database


Step 2 - Approaches for Defining Global Market Size (Value, Volume* & Price*)

Note*: In applicable scenarios
Step 3 - Data Sources
Primary Research
- Web Analytics
- Survey Reports
- Research Institute
- Latest Research Reports
- Opinion Leaders
Secondary Research
- Annual Reports
- White Paper
- Latest Press Release
- Industry Association
- Paid Database
- Investor Presentations

Step 4 - Data Triangulation
Involves using different sources of information in order to increase the validity of a study
These sources are likely to be stakeholders in a program - participants, other researchers, program staff, other community members, and so on.
Then we put all data in single framework & apply various statistical tools to find out the dynamic on the market.
During the analysis stage, feedback from the stakeholder groups would be compared to determine areas of agreement as well as areas of divergence
