

Key Insights
The display fingerprint technology market is experiencing robust growth, driven by the increasing demand for enhanced smartphone security and seamless user experience. The market's Compound Annual Growth Rate (CAGR) of 21% from 2019 to 2024 suggests a significant upward trajectory, projected to continue into the forecast period (2025-2033). This growth is fueled by several key factors. The rising adoption of smartphones globally, particularly in developing economies, creates a vast potential market for display fingerprint sensors. Furthermore, advancements in sensor technology, leading to improved accuracy, speed, and reliability, are driving consumer adoption. The integration of display fingerprint sensors into various devices beyond smartphones, including notebooks and tablets, further expands market opportunities. Competition among major players like GigaDevice, Synaptics, and Qualcomm fuels innovation and drives down costs, making the technology more accessible to a broader range of consumers. While challenges remain, such as overcoming the technical hurdles associated with integrating the technology into curved or flexible screens and managing supply chain complexities, the overall market outlook remains positive. Regional variations exist, with North America and Asia Pacific expected to be major contributors to market growth, given the high smartphone penetration and technological advancements in these regions. The shift towards optical and ultrasonic technologies is also reshaping the market landscape, presenting opportunities for companies focusing on these advanced sensor types.
The segmentation of the market by product type (mobile, notebook, tablet) and sensor type (optical, ultrasound) highlights the diverse applications and technological advancements driving growth. The market's expansion is further supported by increasing consumer awareness of biometric security features and a preference for user-friendly authentication methods. Companies are actively investing in research and development to improve sensor performance and integrate them seamlessly into diverse device designs. This continuous innovation, coupled with expanding applications, will continue to fuel the market's expansion in the coming years, leading to substantial growth across all major geographical regions. The continued miniaturization and cost reduction of sensors will be crucial in driving mass adoption, particularly in the budget-friendly smartphone segment.
Display Fingerprint Technology Industry Market Report: 2019-2033
This comprehensive report provides an in-depth analysis of the Display Fingerprint Technology industry, offering valuable insights into market trends, growth drivers, challenges, and future opportunities. The study period covers 2019-2033, with 2025 serving as the base and estimated year. The report forecasts market performance from 2025 to 2033, building upon historical data from 2019-2024. This analysis will be invaluable for stakeholders seeking to understand and capitalize on the dynamic landscape of this rapidly evolving technology. The market is estimated to reach xx Million by 2033.
Display Fingerprint Technology Industry Market Composition & Trends
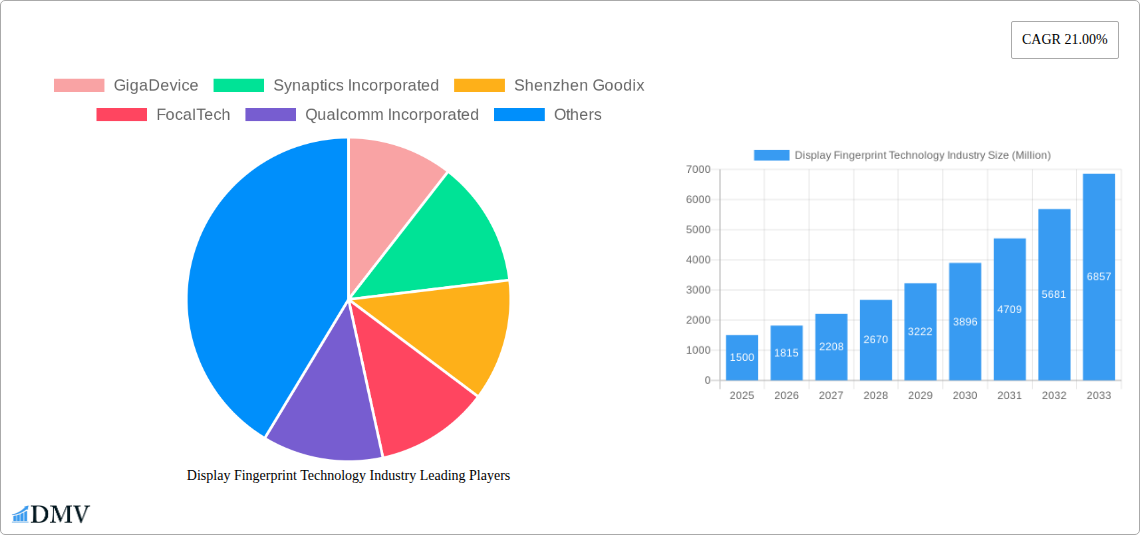
The Display Fingerprint Technology market exhibits a moderately concentrated landscape, with key players like Synaptics Incorporated, Qualcomm Incorporated, and Fingerprint Cards AB holding significant market share. The global market share distribution in 2025 is estimated as follows: Synaptics Incorporated (20%), Qualcomm Incorporated (18%), Fingerprint Cards AB (15%), and others (47%). Innovation is primarily driven by advancements in sensor technology, miniaturization, and improved accuracy. Regulatory landscapes vary across regions, impacting adoption rates. Substitute technologies, such as facial recognition and iris scanning, pose a competitive threat, though display fingerprint technology maintains advantages in terms of security and user experience. The primary end-users are smartphone manufacturers, followed by laptop and tablet manufacturers. M&A activity has been moderate, with deal values totaling approximately xx Million in the past five years. Notable deals included (list specific examples if available, otherwise replace with "xx").
- Market Concentration: Moderately concentrated, with a few dominant players.
- Innovation Catalysts: Sensor technology advancements, miniaturization, improved accuracy.
- Regulatory Landscape: Varies across regions, impacting adoption.
- Substitute Products: Facial recognition, iris scanning.
- End-User Profiles: Smartphone, laptop, and tablet manufacturers.
- M&A Activities: Moderate activity, with total deal values of approximately xx Million in the past five years.

Display Fingerprint Technology Industry Industry Evolution
The Display Fingerprint Technology market has witnessed substantial growth over the past few years, driven by increasing smartphone penetration and the demand for enhanced security features. From 2019 to 2024, the market experienced a Compound Annual Growth Rate (CAGR) of xx%. Technological advancements, such as the introduction of in-display ultrasonic sensors and improved optical sensor technologies, have significantly enhanced the performance and reliability of fingerprint scanners. Consumer demand for secure and convenient authentication methods fuels market growth. Adoption rates are highest in premium smartphones and are gradually expanding to mid-range and budget devices. The shift towards bezel-less designs in mobile devices further boosts the adoption of display fingerprint technology, as it eliminates the need for dedicated fingerprint sensors on the device body. We project a CAGR of xx% from 2025 to 2033, driven by continued technological innovation and expansion into new applications such as laptops and tablets.
Leading Regions, Countries, or Segments in Display Fingerprint Technology Industry
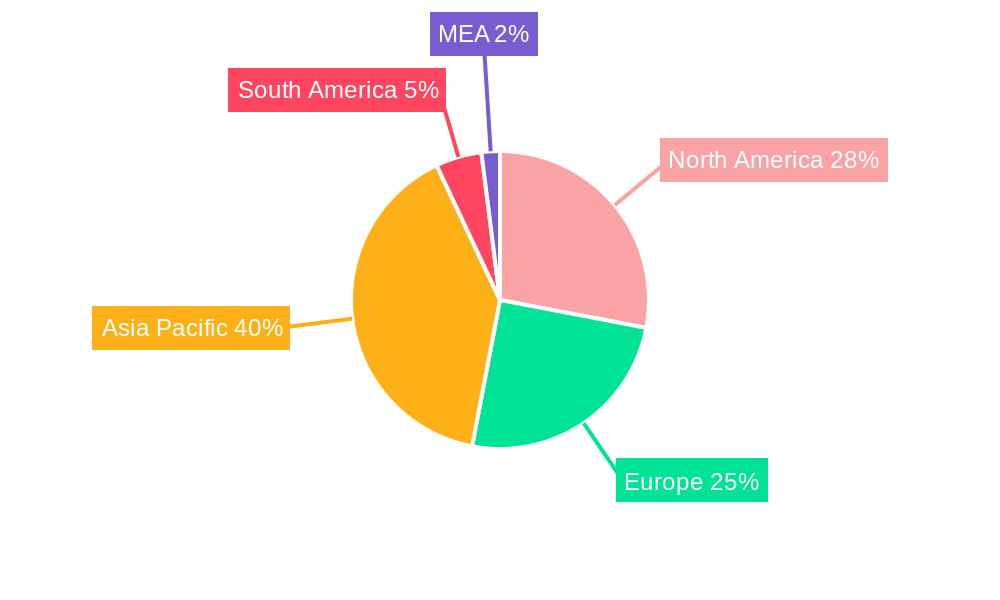
The Asia-Pacific region, particularly China and South Korea, dominates the Display Fingerprint Technology market, driven by high smartphone production and adoption rates. The mobile segment is the largest contributor to market revenue, followed by tablets and notebooks. Optical sensors currently hold the largest market share, though ultrasonic technology is gaining traction due to its advantages in accuracy and performance under various conditions.
Key Drivers for Asia-Pacific Dominance:
- High smartphone manufacturing and sales.
- Strong government support for technology advancements.
- Large consumer base with high technology adoption rates.
Key Drivers for Mobile Segment Dominance:
- High smartphone penetration globally.
- Increased security and convenience demands from users.
- Integration with mobile payment systems.
Key Drivers for Optical Sensor Dominance:
- Lower manufacturing cost compared to ultrasonic sensors.
- Wider market availability and compatibility.
Key Drivers for Ultrasonic Sensor Growth:
- Enhanced accuracy and reliability in various conditions.
- Better performance under wet or dirty conditions.
Display Fingerprint Technology Industry Product Innovations
Recent innovations focus on improving sensor accuracy, speed, and reliability. Under-display fingerprint sensors are becoming increasingly sophisticated, incorporating features like enhanced image processing and AI-powered algorithms for improved recognition. Miniaturization efforts lead to smaller and more energy-efficient sensors, allowing for integration into thinner and lighter devices. New applications extend beyond smartphones, with increasing integration into laptops and smart home devices. Unique selling propositions include enhanced security, improved user experience, and compatibility with various screen technologies.
Propelling Factors for Display Fingerprint Technology Industry Growth
Technological advancements, like improved sensor accuracy and miniaturization, are key growth drivers. Economic factors, such as rising disposable incomes and increased consumer spending on electronics, contribute to market expansion. Government initiatives promoting secure authentication methods further propel adoption. For example, the growing adoption of mobile payment systems fuels demand for secure biometric authentication.
Obstacles in the Display Fingerprint Technology Industry Market
Supply chain disruptions can impact production and availability. Intense competition from established players and emerging companies creates pressure on pricing and margins. Varying regulatory requirements across different regions create implementation challenges. For example, stringent data privacy regulations increase the cost and complexity of product development and deployment.
Future Opportunities in Display Fingerprint Technology Industry
Expanding into new markets, such as smart home devices and wearables, presents significant opportunities. Advancements in sensor technology, such as 3D fingerprint recognition and improved moisture/dirt resistance, will open new avenues for growth. Meeting increasing consumer demand for seamless and secure authentication will continue to drive market expansion.
Major Players in the Display Fingerprint Technology Industry Ecosystem
- GigaDevice
- Synaptics Incorporated
- Shenzhen Goodix
- FocalTech
- Qualcomm Incorporated
- Fingerprint Cards AB
- NEC Corporation
- Vkansee
Key Developments in Display Fingerprint Technology Industry Industry
- 2022 Q3: Synaptics launched a new generation of in-display fingerprint sensors with improved performance.
- 2023 Q1: Qualcomm announced a partnership with a major smartphone manufacturer to integrate its fingerprint technology into a new flagship device. (Add other specific developments with dates if available, otherwise use "xx")
Strategic Display Fingerprint Technology Industry Market Forecast
The Display Fingerprint Technology market is poised for continued growth, fueled by technological innovations, rising smartphone adoption, and expanding applications beyond mobile devices. The increasing demand for secure authentication methods in various sectors will drive market expansion, leading to significant growth opportunities for key players in the coming years. The market is expected to grow at a CAGR of xx% from 2025 to 2033, reaching an estimated xx Million by 2033.
Display Fingerprint Technology Industry Segmentation
-
1. Product Type
- 1.1. Mobile
- 1.2. Notebook
- 1.3. Tablet
-
2. Type
- 2.1. Optical
- 2.2. Ultrasound
Display Fingerprint Technology Industry Segmentation By Geography
- 1. North America
- 2. Europe
- 3. Asia Pacific
- 4. Rest of the World
Display Fingerprint Technology Industry REPORT HIGHLIGHTS
| Aspects | Details |
|---|---|
| Study Period | 2019-2033 |
| Base Year | 2024 |
| Estimated Year | 2025 |
| Forecast Period | 2025-2033 |
| Historical Period | 2019-2024 |
| Growth Rate | CAGR of 21.00% from 2019-2033 |
| Segmentation |
|
Table of Contents
- 1. Introduction
- 1.1. Research Scope
- 1.2. Market Segmentation
- 1.3. Research Methodology
- 1.4. Definitions and Assumptions
- 2. Executive Summary
- 2.1. Introduction
- 3. Market Dynamics
- 3.1. Introduction
- 3.2. Market Drivers
- 3.2.1. ; Increasing Demand for Ease of Convenience to use the Device; Increasing Security Awareness
- 3.3. Market Restrains
- 3.3.1. ; In-display Fingerprints are Comparatively Slow Compared to Conventional Fingerprint Sensors
- 3.4. Market Trends
- 3.4.1. optical under-display sensors
- 4. Market Factor Analysis
- 4.1. Porters Five Forces
- 4.2. Supply/Value Chain
- 4.3. PESTEL analysis
- 4.4. Market Entropy
- 4.5. Patent/Trademark Analysis
- 5. Global Display Fingerprint Technology Industry Analysis, Insights and Forecast, 2019-2031
- 5.1. Market Analysis, Insights and Forecast - by Product Type
- 5.1.1. Mobile
- 5.1.2. Notebook
- 5.1.3. Tablet
- 5.2. Market Analysis, Insights and Forecast - by Type
- 5.2.1. Optical
- 5.2.2. Ultrasound
- 5.3. Market Analysis, Insights and Forecast - by Region
- 5.3.1. North America
- 5.3.2. Europe
- 5.3.3. Asia Pacific
- 5.3.4. Rest of the World
- 5.1. Market Analysis, Insights and Forecast - by Product Type
- 6. North America Display Fingerprint Technology Industry Analysis, Insights and Forecast, 2019-2031
- 6.1. Market Analysis, Insights and Forecast - by Product Type
- 6.1.1. Mobile
- 6.1.2. Notebook
- 6.1.3. Tablet
- 6.2. Market Analysis, Insights and Forecast - by Type
- 6.2.1. Optical
- 6.2.2. Ultrasound
- 6.1. Market Analysis, Insights and Forecast - by Product Type
- 7. Europe Display Fingerprint Technology Industry Analysis, Insights and Forecast, 2019-2031
- 7.1. Market Analysis, Insights and Forecast - by Product Type
- 7.1.1. Mobile
- 7.1.2. Notebook
- 7.1.3. Tablet
- 7.2. Market Analysis, Insights and Forecast - by Type
- 7.2.1. Optical
- 7.2.2. Ultrasound
- 7.1. Market Analysis, Insights and Forecast - by Product Type
- 8. Asia Pacific Display Fingerprint Technology Industry Analysis, Insights and Forecast, 2019-2031
- 8.1. Market Analysis, Insights and Forecast - by Product Type
- 8.1.1. Mobile
- 8.1.2. Notebook
- 8.1.3. Tablet
- 8.2. Market Analysis, Insights and Forecast - by Type
- 8.2.1. Optical
- 8.2.2. Ultrasound
- 8.1. Market Analysis, Insights and Forecast - by Product Type
- 9. Rest of the World Display Fingerprint Technology Industry Analysis, Insights and Forecast, 2019-2031
- 9.1. Market Analysis, Insights and Forecast - by Product Type
- 9.1.1. Mobile
- 9.1.2. Notebook
- 9.1.3. Tablet
- 9.2. Market Analysis, Insights and Forecast - by Type
- 9.2.1. Optical
- 9.2.2. Ultrasound
- 9.1. Market Analysis, Insights and Forecast - by Product Type
- 10. North America Display Fingerprint Technology Industry Analysis, Insights and Forecast, 2019-2031
- 10.1. Market Analysis, Insights and Forecast - By Country/Sub-region
- 10.1.1 United States
- 10.1.2 Canada
- 10.1.3 Mexico
- 11. Europe Display Fingerprint Technology Industry Analysis, Insights and Forecast, 2019-2031
- 11.1. Market Analysis, Insights and Forecast - By Country/Sub-region
- 11.1.1 Germany
- 11.1.2 United Kingdom
- 11.1.3 France
- 11.1.4 Spain
- 11.1.5 Italy
- 11.1.6 Spain
- 11.1.7 Belgium
- 11.1.8 Netherland
- 11.1.9 Nordics
- 11.1.10 Rest of Europe
- 12. Asia Pacific Display Fingerprint Technology Industry Analysis, Insights and Forecast, 2019-2031
- 12.1. Market Analysis, Insights and Forecast - By Country/Sub-region
- 12.1.1 China
- 12.1.2 Japan
- 12.1.3 India
- 12.1.4 South Korea
- 12.1.5 Southeast Asia
- 12.1.6 Australia
- 12.1.7 Indonesia
- 12.1.8 Phillipes
- 12.1.9 Singapore
- 12.1.10 Thailandc
- 12.1.11 Rest of Asia Pacific
- 13. South America Display Fingerprint Technology Industry Analysis, Insights and Forecast, 2019-2031
- 13.1. Market Analysis, Insights and Forecast - By Country/Sub-region
- 13.1.1 Brazil
- 13.1.2 Argentina
- 13.1.3 Peru
- 13.1.4 Chile
- 13.1.5 Colombia
- 13.1.6 Ecuador
- 13.1.7 Venezuela
- 13.1.8 Rest of South America
- 14. North America Display Fingerprint Technology Industry Analysis, Insights and Forecast, 2019-2031
- 14.1. Market Analysis, Insights and Forecast - By Country/Sub-region
- 14.1.1 United States
- 14.1.2 Canada
- 14.1.3 Mexico
- 15. MEA Display Fingerprint Technology Industry Analysis, Insights and Forecast, 2019-2031
- 15.1. Market Analysis, Insights and Forecast - By Country/Sub-region
- 15.1.1 United Arab Emirates
- 15.1.2 Saudi Arabia
- 15.1.3 South Africa
- 15.1.4 Rest of Middle East and Africa
- 16. Competitive Analysis
- 16.1. Global Market Share Analysis 2024
- 16.2. Company Profiles
- 16.2.1 GigaDevice
- 16.2.1.1. Overview
- 16.2.1.2. Products
- 16.2.1.3. SWOT Analysis
- 16.2.1.4. Recent Developments
- 16.2.1.5. Financials (Based on Availability)
- 16.2.2 Synaptics Incorporated
- 16.2.2.1. Overview
- 16.2.2.2. Products
- 16.2.2.3. SWOT Analysis
- 16.2.2.4. Recent Developments
- 16.2.2.5. Financials (Based on Availability)
- 16.2.3 Shenzhen Goodix
- 16.2.3.1. Overview
- 16.2.3.2. Products
- 16.2.3.3. SWOT Analysis
- 16.2.3.4. Recent Developments
- 16.2.3.5. Financials (Based on Availability)
- 16.2.4 FocalTech
- 16.2.4.1. Overview
- 16.2.4.2. Products
- 16.2.4.3. SWOT Analysis
- 16.2.4.4. Recent Developments
- 16.2.4.5. Financials (Based on Availability)
- 16.2.5 Qualcomm Incorporated
- 16.2.5.1. Overview
- 16.2.5.2. Products
- 16.2.5.3. SWOT Analysis
- 16.2.5.4. Recent Developments
- 16.2.5.5. Financials (Based on Availability)
- 16.2.6 Fingerprint Cards AB
- 16.2.6.1. Overview
- 16.2.6.2. Products
- 16.2.6.3. SWOT Analysis
- 16.2.6.4. Recent Developments
- 16.2.6.5. Financials (Based on Availability)
- 16.2.7 NEC Corporation
- 16.2.7.1. Overview
- 16.2.7.2. Products
- 16.2.7.3. SWOT Analysis
- 16.2.7.4. Recent Developments
- 16.2.7.5. Financials (Based on Availability)
- 16.2.8 Vkansee
- 16.2.8.1. Overview
- 16.2.8.2. Products
- 16.2.8.3. SWOT Analysis
- 16.2.8.4. Recent Developments
- 16.2.8.5. Financials (Based on Availability)
- 16.2.1 GigaDevice
List of Figures
- Figure 1: Global Display Fingerprint Technology Industry Revenue Breakdown (Million, %) by Region 2024 & 2032
- Figure 2: North America Display Fingerprint Technology Industry Revenue (Million), by Country 2024 & 2032
- Figure 3: North America Display Fingerprint Technology Industry Revenue Share (%), by Country 2024 & 2032
- Figure 4: Europe Display Fingerprint Technology Industry Revenue (Million), by Country 2024 & 2032
- Figure 5: Europe Display Fingerprint Technology Industry Revenue Share (%), by Country 2024 & 2032
- Figure 6: Asia Pacific Display Fingerprint Technology Industry Revenue (Million), by Country 2024 & 2032
- Figure 7: Asia Pacific Display Fingerprint Technology Industry Revenue Share (%), by Country 2024 & 2032
- Figure 8: South America Display Fingerprint Technology Industry Revenue (Million), by Country 2024 & 2032
- Figure 9: South America Display Fingerprint Technology Industry Revenue Share (%), by Country 2024 & 2032
- Figure 10: North America Display Fingerprint Technology Industry Revenue (Million), by Country 2024 & 2032
- Figure 11: North America Display Fingerprint Technology Industry Revenue Share (%), by Country 2024 & 2032
- Figure 12: MEA Display Fingerprint Technology Industry Revenue (Million), by Country 2024 & 2032
- Figure 13: MEA Display Fingerprint Technology Industry Revenue Share (%), by Country 2024 & 2032
- Figure 14: North America Display Fingerprint Technology Industry Revenue (Million), by Product Type 2024 & 2032
- Figure 15: North America Display Fingerprint Technology Industry Revenue Share (%), by Product Type 2024 & 2032
- Figure 16: North America Display Fingerprint Technology Industry Revenue (Million), by Type 2024 & 2032
- Figure 17: North America Display Fingerprint Technology Industry Revenue Share (%), by Type 2024 & 2032
- Figure 18: North America Display Fingerprint Technology Industry Revenue (Million), by Country 2024 & 2032
- Figure 19: North America Display Fingerprint Technology Industry Revenue Share (%), by Country 2024 & 2032
- Figure 20: Europe Display Fingerprint Technology Industry Revenue (Million), by Product Type 2024 & 2032
- Figure 21: Europe Display Fingerprint Technology Industry Revenue Share (%), by Product Type 2024 & 2032
- Figure 22: Europe Display Fingerprint Technology Industry Revenue (Million), by Type 2024 & 2032
- Figure 23: Europe Display Fingerprint Technology Industry Revenue Share (%), by Type 2024 & 2032
- Figure 24: Europe Display Fingerprint Technology Industry Revenue (Million), by Country 2024 & 2032
- Figure 25: Europe Display Fingerprint Technology Industry Revenue Share (%), by Country 2024 & 2032
- Figure 26: Asia Pacific Display Fingerprint Technology Industry Revenue (Million), by Product Type 2024 & 2032
- Figure 27: Asia Pacific Display Fingerprint Technology Industry Revenue Share (%), by Product Type 2024 & 2032
- Figure 28: Asia Pacific Display Fingerprint Technology Industry Revenue (Million), by Type 2024 & 2032
- Figure 29: Asia Pacific Display Fingerprint Technology Industry Revenue Share (%), by Type 2024 & 2032
- Figure 30: Asia Pacific Display Fingerprint Technology Industry Revenue (Million), by Country 2024 & 2032
- Figure 31: Asia Pacific Display Fingerprint Technology Industry Revenue Share (%), by Country 2024 & 2032
- Figure 32: Rest of the World Display Fingerprint Technology Industry Revenue (Million), by Product Type 2024 & 2032
- Figure 33: Rest of the World Display Fingerprint Technology Industry Revenue Share (%), by Product Type 2024 & 2032
- Figure 34: Rest of the World Display Fingerprint Technology Industry Revenue (Million), by Type 2024 & 2032
- Figure 35: Rest of the World Display Fingerprint Technology Industry Revenue Share (%), by Type 2024 & 2032
- Figure 36: Rest of the World Display Fingerprint Technology Industry Revenue (Million), by Country 2024 & 2032
- Figure 37: Rest of the World Display Fingerprint Technology Industry Revenue Share (%), by Country 2024 & 2032
List of Tables
- Table 1: Global Display Fingerprint Technology Industry Revenue Million Forecast, by Region 2019 & 2032
- Table 2: Global Display Fingerprint Technology Industry Revenue Million Forecast, by Product Type 2019 & 2032
- Table 3: Global Display Fingerprint Technology Industry Revenue Million Forecast, by Type 2019 & 2032
- Table 4: Global Display Fingerprint Technology Industry Revenue Million Forecast, by Region 2019 & 2032
- Table 5: Global Display Fingerprint Technology Industry Revenue Million Forecast, by Country 2019 & 2032
- Table 6: United States Display Fingerprint Technology Industry Revenue (Million) Forecast, by Application 2019 & 2032
- Table 7: Canada Display Fingerprint Technology Industry Revenue (Million) Forecast, by Application 2019 & 2032
- Table 8: Mexico Display Fingerprint Technology Industry Revenue (Million) Forecast, by Application 2019 & 2032
- Table 9: Global Display Fingerprint Technology Industry Revenue Million Forecast, by Country 2019 & 2032
- Table 10: Germany Display Fingerprint Technology Industry Revenue (Million) Forecast, by Application 2019 & 2032
- Table 11: United Kingdom Display Fingerprint Technology Industry Revenue (Million) Forecast, by Application 2019 & 2032
- Table 12: France Display Fingerprint Technology Industry Revenue (Million) Forecast, by Application 2019 & 2032
- Table 13: Spain Display Fingerprint Technology Industry Revenue (Million) Forecast, by Application 2019 & 2032
- Table 14: Italy Display Fingerprint Technology Industry Revenue (Million) Forecast, by Application 2019 & 2032
- Table 15: Spain Display Fingerprint Technology Industry Revenue (Million) Forecast, by Application 2019 & 2032
- Table 16: Belgium Display Fingerprint Technology Industry Revenue (Million) Forecast, by Application 2019 & 2032
- Table 17: Netherland Display Fingerprint Technology Industry Revenue (Million) Forecast, by Application 2019 & 2032
- Table 18: Nordics Display Fingerprint Technology Industry Revenue (Million) Forecast, by Application 2019 & 2032
- Table 19: Rest of Europe Display Fingerprint Technology Industry Revenue (Million) Forecast, by Application 2019 & 2032
- Table 20: Global Display Fingerprint Technology Industry Revenue Million Forecast, by Country 2019 & 2032
- Table 21: China Display Fingerprint Technology Industry Revenue (Million) Forecast, by Application 2019 & 2032
- Table 22: Japan Display Fingerprint Technology Industry Revenue (Million) Forecast, by Application 2019 & 2032
- Table 23: India Display Fingerprint Technology Industry Revenue (Million) Forecast, by Application 2019 & 2032
- Table 24: South Korea Display Fingerprint Technology Industry Revenue (Million) Forecast, by Application 2019 & 2032
- Table 25: Southeast Asia Display Fingerprint Technology Industry Revenue (Million) Forecast, by Application 2019 & 2032
- Table 26: Australia Display Fingerprint Technology Industry Revenue (Million) Forecast, by Application 2019 & 2032
- Table 27: Indonesia Display Fingerprint Technology Industry Revenue (Million) Forecast, by Application 2019 & 2032
- Table 28: Phillipes Display Fingerprint Technology Industry Revenue (Million) Forecast, by Application 2019 & 2032
- Table 29: Singapore Display Fingerprint Technology Industry Revenue (Million) Forecast, by Application 2019 & 2032
- Table 30: Thailandc Display Fingerprint Technology Industry Revenue (Million) Forecast, by Application 2019 & 2032
- Table 31: Rest of Asia Pacific Display Fingerprint Technology Industry Revenue (Million) Forecast, by Application 2019 & 2032
- Table 32: Global Display Fingerprint Technology Industry Revenue Million Forecast, by Country 2019 & 2032
- Table 33: Brazil Display Fingerprint Technology Industry Revenue (Million) Forecast, by Application 2019 & 2032
- Table 34: Argentina Display Fingerprint Technology Industry Revenue (Million) Forecast, by Application 2019 & 2032
- Table 35: Peru Display Fingerprint Technology Industry Revenue (Million) Forecast, by Application 2019 & 2032
- Table 36: Chile Display Fingerprint Technology Industry Revenue (Million) Forecast, by Application 2019 & 2032
- Table 37: Colombia Display Fingerprint Technology Industry Revenue (Million) Forecast, by Application 2019 & 2032
- Table 38: Ecuador Display Fingerprint Technology Industry Revenue (Million) Forecast, by Application 2019 & 2032
- Table 39: Venezuela Display Fingerprint Technology Industry Revenue (Million) Forecast, by Application 2019 & 2032
- Table 40: Rest of South America Display Fingerprint Technology Industry Revenue (Million) Forecast, by Application 2019 & 2032
- Table 41: Global Display Fingerprint Technology Industry Revenue Million Forecast, by Country 2019 & 2032
- Table 42: United States Display Fingerprint Technology Industry Revenue (Million) Forecast, by Application 2019 & 2032
- Table 43: Canada Display Fingerprint Technology Industry Revenue (Million) Forecast, by Application 2019 & 2032
- Table 44: Mexico Display Fingerprint Technology Industry Revenue (Million) Forecast, by Application 2019 & 2032
- Table 45: Global Display Fingerprint Technology Industry Revenue Million Forecast, by Country 2019 & 2032
- Table 46: United Arab Emirates Display Fingerprint Technology Industry Revenue (Million) Forecast, by Application 2019 & 2032
- Table 47: Saudi Arabia Display Fingerprint Technology Industry Revenue (Million) Forecast, by Application 2019 & 2032
- Table 48: South Africa Display Fingerprint Technology Industry Revenue (Million) Forecast, by Application 2019 & 2032
- Table 49: Rest of Middle East and Africa Display Fingerprint Technology Industry Revenue (Million) Forecast, by Application 2019 & 2032
- Table 50: Global Display Fingerprint Technology Industry Revenue Million Forecast, by Product Type 2019 & 2032
- Table 51: Global Display Fingerprint Technology Industry Revenue Million Forecast, by Type 2019 & 2032
- Table 52: Global Display Fingerprint Technology Industry Revenue Million Forecast, by Country 2019 & 2032
- Table 53: Global Display Fingerprint Technology Industry Revenue Million Forecast, by Product Type 2019 & 2032
- Table 54: Global Display Fingerprint Technology Industry Revenue Million Forecast, by Type 2019 & 2032
- Table 55: Global Display Fingerprint Technology Industry Revenue Million Forecast, by Country 2019 & 2032
- Table 56: Global Display Fingerprint Technology Industry Revenue Million Forecast, by Product Type 2019 & 2032
- Table 57: Global Display Fingerprint Technology Industry Revenue Million Forecast, by Type 2019 & 2032
- Table 58: Global Display Fingerprint Technology Industry Revenue Million Forecast, by Country 2019 & 2032
- Table 59: Global Display Fingerprint Technology Industry Revenue Million Forecast, by Product Type 2019 & 2032
- Table 60: Global Display Fingerprint Technology Industry Revenue Million Forecast, by Type 2019 & 2032
- Table 61: Global Display Fingerprint Technology Industry Revenue Million Forecast, by Country 2019 & 2032
Frequently Asked Questions
1. What is the projected Compound Annual Growth Rate (CAGR) of the Display Fingerprint Technology Industry?
The projected CAGR is approximately 21.00%.
2. Which companies are prominent players in the Display Fingerprint Technology Industry?
Key companies in the market include GigaDevice, Synaptics Incorporated, Shenzhen Goodix, FocalTech, Qualcomm Incorporated, Fingerprint Cards AB, NEC Corporation, Vkansee.
3. What are the main segments of the Display Fingerprint Technology Industry?
The market segments include Product Type, Type.
4. Can you provide details about the market size?
The market size is estimated to be USD XX Million as of 2022.
5. What are some drivers contributing to market growth?
; Increasing Demand for Ease of Convenience to use the Device; Increasing Security Awareness.
6. What are the notable trends driving market growth?
optical under-display sensors.
7. Are there any restraints impacting market growth?
; In-display Fingerprints are Comparatively Slow Compared to Conventional Fingerprint Sensors.
8. Can you provide examples of recent developments in the market?
N/A
9. What pricing options are available for accessing the report?
Pricing options include single-user, multi-user, and enterprise licenses priced at USD 4750, USD 5250, and USD 8750 respectively.
10. Is the market size provided in terms of value or volume?
The market size is provided in terms of value, measured in Million.
11. Are there any specific market keywords associated with the report?
Yes, the market keyword associated with the report is "Display Fingerprint Technology Industry," which aids in identifying and referencing the specific market segment covered.
12. How do I determine which pricing option suits my needs best?
The pricing options vary based on user requirements and access needs. Individual users may opt for single-user licenses, while businesses requiring broader access may choose multi-user or enterprise licenses for cost-effective access to the report.
13. Are there any additional resources or data provided in the Display Fingerprint Technology Industry report?
While the report offers comprehensive insights, it's advisable to review the specific contents or supplementary materials provided to ascertain if additional resources or data are available.
14. How can I stay updated on further developments or reports in the Display Fingerprint Technology Industry?
To stay informed about further developments, trends, and reports in the Display Fingerprint Technology Industry, consider subscribing to industry newsletters, following relevant companies and organizations, or regularly checking reputable industry news sources and publications.
Methodology
Step 1 - Identification of Relevant Samples Size from Population Database


Step 2 - Approaches for Defining Global Market Size (Value, Volume* & Price*)

Note*: In applicable scenarios
Step 3 - Data Sources
Primary Research
- Web Analytics
- Survey Reports
- Research Institute
- Latest Research Reports
- Opinion Leaders
Secondary Research
- Annual Reports
- White Paper
- Latest Press Release
- Industry Association
- Paid Database
- Investor Presentations

Step 4 - Data Triangulation
Involves using different sources of information in order to increase the validity of a study
These sources are likely to be stakeholders in a program - participants, other researchers, program staff, other community members, and so on.
Then we put all data in single framework & apply various statistical tools to find out the dynamic on the market.
During the analysis stage, feedback from the stakeholder groups would be compared to determine areas of agreement as well as areas of divergence
