

Key Insights
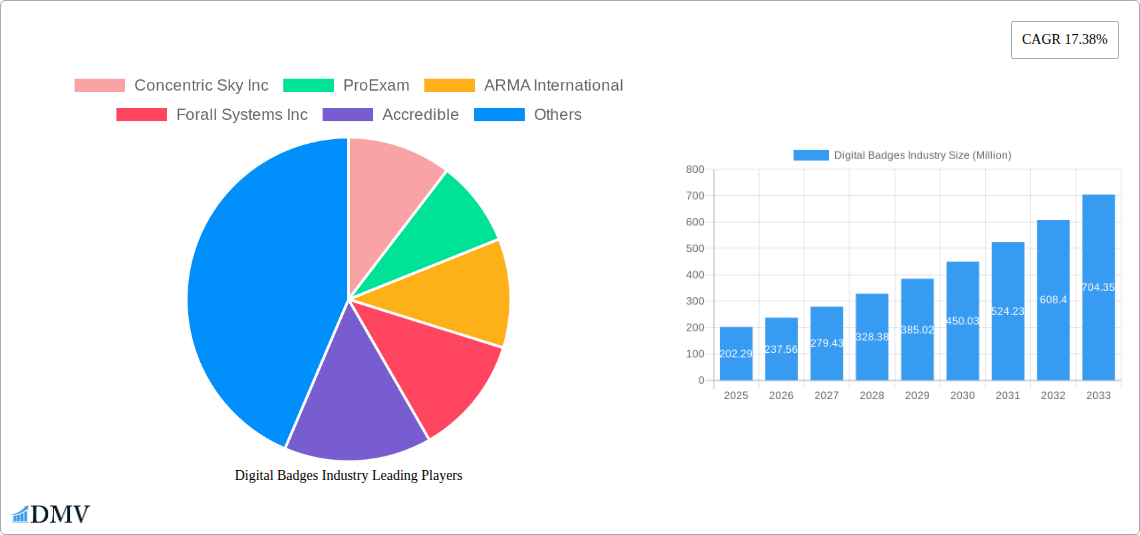
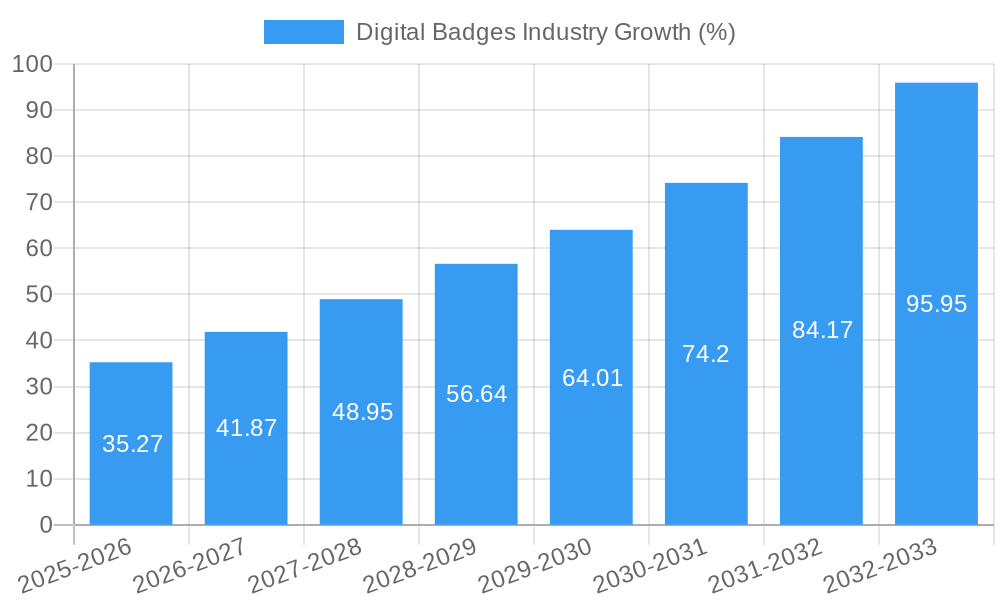
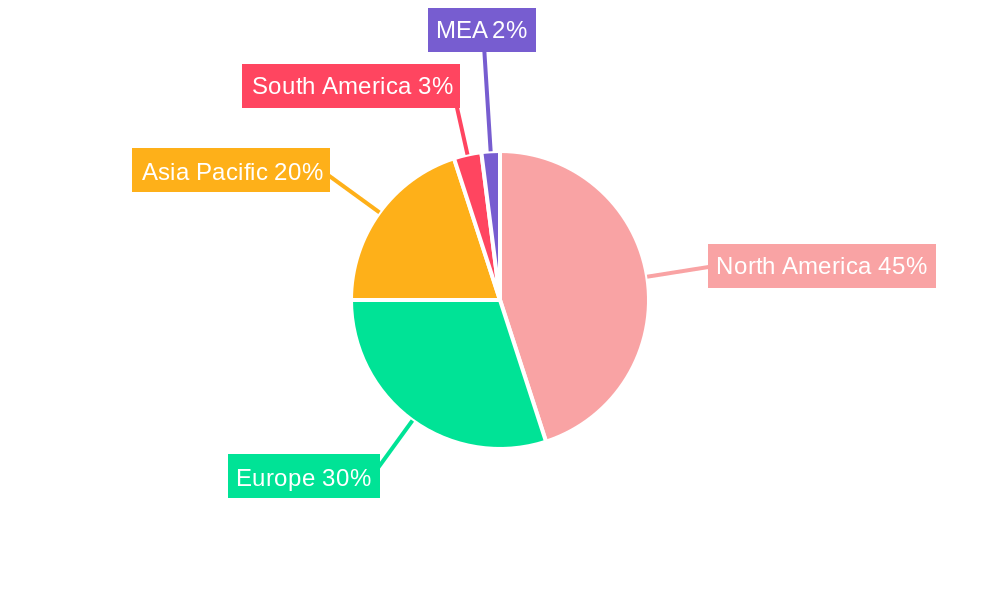
The digital badges market, currently valued at $202.29 million in 2025, is experiencing robust growth, projected to expand at a Compound Annual Growth Rate (CAGR) of 17.38% from 2025 to 2033. This surge is driven by the increasing demand for verifiable skills and credentials in both academic and corporate settings. The shift towards online learning, the need for efficient talent management systems, and the growing recognition of micro-credentials and upskilling initiatives are key catalysts. Furthermore, the adoption of blockchain technology for enhanced security and transparency of digital badges is further fueling market expansion. The North American market currently holds a significant share, driven by early adoption of innovative technologies and a strong emphasis on skills-based hiring. However, rapid digitalization in Asia-Pacific and Europe is expected to contribute significantly to market growth in the coming years. Competition within the market is relatively fragmented, with several established players alongside emerging startups providing diverse solutions, from badge creation and management platforms to integration with learning management systems (LMS).
The restraints to market growth primarily involve challenges associated with standardization and interoperability of digital badges across different platforms. Furthermore, concerns regarding the security and verification of digital credentials and the need for widespread awareness among users and institutions remain hurdles to overcome. The market segmentation, encompassing academic and corporate end-users, demonstrates distinct needs and priorities. Academic institutions focus on showcasing student achievements and skills development, while corporations utilize digital badges for internal talent recognition, upskilling initiatives, and streamlined hiring processes. Future growth will likely be shaped by technological advancements, increased collaborations among educational institutions and businesses, and the development of robust frameworks to enhance the credibility and wider acceptance of digital badges.
Digital Badges Industry Market Report: 2019-2033
This comprehensive report provides a detailed analysis of the Digital Badges market, projecting a market value of $XX Million by 2033. The study period covers 2019-2033, with 2025 as the base and estimated year. The forecast period spans 2025-2033, and the historical period encompasses 2019-2024. This insightful report is crucial for stakeholders seeking to understand market dynamics, identify growth opportunities, and make informed strategic decisions in this rapidly evolving sector.
Digital Badges Industry Market Composition & Trends
The Digital Badges industry is experiencing significant growth, driven by increasing demand for verifiable skills validation and the rising adoption of online learning platforms. Market concentration is moderate, with several key players vying for market share. The global market size is estimated at $XX Million in 2025, projected to reach $XX Million by 2033. Key market drivers include the rising adoption of digital credentials by educational institutions and corporations, technological advancements in blockchain and verifiable credentials, and increasing regulatory support for digital badges.
Market Share Distribution (2025 Estimates):
- Accredible: 15%
- Credly Inc: 12%
- Skillsoft Corporation: 10%
- Other Players: 63%
Innovation Catalysts:
- Blockchain technology for secure credential verification.
- Integration with Learning Management Systems (LMS).
- Development of interoperable digital badge standards.
Regulatory Landscape:
- Growing acceptance of digital badges by regulatory bodies globally.
- Ongoing development of standards and frameworks for digital badges.
Substitute Products:
- Traditional certificates and transcripts.
- Online course completion certificates.
End-User Profiles:
- Academic institutions (Colleges, Universities, etc.).
- Corporate organizations (Talent Development).
M&A Activities:
- The industry has seen several mergers and acquisitions in recent years, with deal values ranging from $XX Million to $XX Million. Increased competition and consolidation are expected to continue.
Digital Badges Industry Industry Evolution
The Digital Badges industry has evolved from a niche market to a significant sector in the skills validation space. From 2019 to 2024, the market witnessed a Compound Annual Growth Rate (CAGR) of XX%. This growth trajectory is fueled by several factors. The increasing demand for verifiable credentials within the corporate and academic sectors has driven adoption rates significantly. Businesses are increasingly utilizing digital badges to track employee skills and development, while educational institutions are leveraging them to enhance the value of their academic offerings. Technological advancements, including the rise of blockchain technology for secure credentialing and improved integration with existing Learning Management Systems (LMS), have further streamlined the adoption process. Furthermore, changing consumer demands for more flexible and accessible credentialing solutions have played a crucial role. The forecast period (2025-2033) projects sustained growth, with a CAGR of XX%, driven by anticipated improvements in user experience and broader global adoption.
Leading Regions, Countries, or Segments in Digital Badges Industry
The corporate segment currently holds the largest market share within the digital badges industry, with a projected value of $XX Million in 2025. The academic segment is also demonstrating robust growth and is expected to achieve a significant market share over the forecast period.
Key Drivers for Corporate Segment Dominance:
- High investment in employee skill development: Businesses are actively investing in upskilling and reskilling initiatives, leading to increased demand for effective skill validation tools.
- Need for efficient talent management: Digital badges provide a streamlined way to track and manage employee skills and certifications.
- Enhanced employer branding: The use of digital badges can improve employer brand and attract top talent.
Key Drivers for Academic Segment Growth:
- Demand for innovative learning and assessment methods: Educators are seeking new ways to engage students and validate their learning outcomes.
- Recognition of digital badges by employers: The increasing acceptance of digital badges by employers motivates institutions to offer them.
- Government initiatives and funding: Funding and support from government agencies are accelerating the implementation of digital badge programs in educational settings.
The United States and Europe are currently the leading regions for the adoption of digital badges. However, significant growth is projected in Asia-Pacific and other emerging markets.
Digital Badges Industry Product Innovations
Recent product innovations include seamless integrations with leading Learning Management Systems (LMS), blockchain-based secure credentialing, and the development of more visually appealing and user-friendly interfaces. These advancements enhance the overall user experience, ensuring higher adoption rates and improved credibility for issued digital badges. Many platforms now offer features such as customizable badge designs and the ability to incorporate multiple skills or accomplishments onto a single credential, adding to their value proposition.
Propelling Factors for Digital Badges Industry Growth
Technological advancements, particularly the integration of blockchain and verifiable credentials, have significantly boosted the credibility and security of digital badges. Economic factors, including the rising cost of traditional credentialing methods, are encouraging the adoption of more cost-effective digital solutions. Supportive regulations and initiatives promoting the use of digital badges by government agencies and educational institutions provide further impetus for growth.
Obstacles in the Digital Badges Industry Market
Interoperability challenges between different digital badge platforms remain a significant barrier. Concerns surrounding data privacy and security, coupled with the need for robust verification mechanisms, require ongoing attention. Competition among various providers and the need for widespread adoption across different sectors continue to pose challenges to market expansion. These factors can limit the widespread acceptance and growth of the digital badge industry.
Future Opportunities in Digital Badges Industry
Emerging opportunities lie in the expansion into new markets, including micro-credentials and skills-based assessments, especially in developing nations. The potential integration of AI-powered tools for personalized learning and automated credential verification presents significant potential. The increasing demand for lifelong learning and reskilling initiatives in the face of rapid technological advancements will further fuel the demand for digital badges.
Major Players in the Digital Badges Industry Ecosystem
- Concentric Sky Inc
- ProExam
- ARMA International
- Forall Systems Inc
- Accredible
- Badgecraf
- Skillsoft Corporation
- Portfolium Inc
- AXELOS
- Credly Inc
- International Institute of Business Analysis
Key Developments in Digital Badges Industry Industry
- June 2023: Skilljar partnered with Accredible, creating a seamless integration between Skilljar's training content and Accredible's credentialing platform. This enhances learner experience and credential value.
- January 2023: Digital Nasional Berhad and Ericsson launched a free online academic program on 5G and digital technology in Malaysia, awarding Ericsson digital badges upon completion.
Strategic Digital Badges Industry Market Forecast
The Digital Badges industry is poised for continued robust growth driven by technological advancements, increasing adoption across diverse sectors, and the growing recognition of their value in skill validation. The market's potential is significant, with projections indicating substantial expansion over the forecast period. Continued innovation and strategic partnerships will be key factors in shaping the future landscape of the Digital Badges market.
Digital Badges Industry Segmentation
-
1. End-user
- 1.1. Academic
- 1.2. Corporate
Digital Badges Industry Segmentation By Geography
- 1. North America
- 2. Europe
- 3. Asia Pacific
- 4. Rest of the World
Digital Badges Industry REPORT HIGHLIGHTS
| Aspects | Details |
|---|---|
| Study Period | 2019-2033 |
| Base Year | 2024 |
| Estimated Year | 2025 |
| Forecast Period | 2025-2033 |
| Historical Period | 2019-2024 |
| Growth Rate | CAGR of 17.38% from 2019-2033 |
| Segmentation |
|
Table of Contents
- 1. Introduction
- 1.1. Research Scope
- 1.2. Market Segmentation
- 1.3. Research Methodology
- 1.4. Definitions and Assumptions
- 2. Executive Summary
- 2.1. Introduction
- 3. Market Dynamics
- 3.1. Introduction
- 3.2. Market Drivers
- 3.2.1. Increasing Focus on Online Learning
- 3.3. Market Restrains
- 3.3.1. Lack of IT Infrastructure in Developing Regions
- 3.4. Market Trends
- 3.4.1. Academic Segment to Occupy a Significant Market Share
- 4. Market Factor Analysis
- 4.1. Porters Five Forces
- 4.2. Supply/Value Chain
- 4.3. PESTEL analysis
- 4.4. Market Entropy
- 4.5. Patent/Trademark Analysis
- 5. Global Digital Badges Industry Analysis, Insights and Forecast, 2019-2031
- 5.1. Market Analysis, Insights and Forecast - by End-user
- 5.1.1. Academic
- 5.1.2. Corporate
- 5.2. Market Analysis, Insights and Forecast - by Region
- 5.2.1. North America
- 5.2.2. Europe
- 5.2.3. Asia Pacific
- 5.2.4. Rest of the World
- 5.1. Market Analysis, Insights and Forecast - by End-user
- 6. North America Digital Badges Industry Analysis, Insights and Forecast, 2019-2031
- 6.1. Market Analysis, Insights and Forecast - by End-user
- 6.1.1. Academic
- 6.1.2. Corporate
- 6.1. Market Analysis, Insights and Forecast - by End-user
- 7. Europe Digital Badges Industry Analysis, Insights and Forecast, 2019-2031
- 7.1. Market Analysis, Insights and Forecast - by End-user
- 7.1.1. Academic
- 7.1.2. Corporate
- 7.1. Market Analysis, Insights and Forecast - by End-user
- 8. Asia Pacific Digital Badges Industry Analysis, Insights and Forecast, 2019-2031
- 8.1. Market Analysis, Insights and Forecast - by End-user
- 8.1.1. Academic
- 8.1.2. Corporate
- 8.1. Market Analysis, Insights and Forecast - by End-user
- 9. Rest of the World Digital Badges Industry Analysis, Insights and Forecast, 2019-2031
- 9.1. Market Analysis, Insights and Forecast - by End-user
- 9.1.1. Academic
- 9.1.2. Corporate
- 9.1. Market Analysis, Insights and Forecast - by End-user
- 10. North America Digital Badges Industry Analysis, Insights and Forecast, 2019-2031
- 10.1. Market Analysis, Insights and Forecast - By Country/Sub-region
- 10.1.1 United States
- 10.1.2 Canada
- 10.1.3 Mexico
- 11. Europe Digital Badges Industry Analysis, Insights and Forecast, 2019-2031
- 11.1. Market Analysis, Insights and Forecast - By Country/Sub-region
- 11.1.1 Germany
- 11.1.2 United Kingdom
- 11.1.3 France
- 11.1.4 Spain
- 11.1.5 Italy
- 11.1.6 Spain
- 11.1.7 Belgium
- 11.1.8 Netherland
- 11.1.9 Nordics
- 11.1.10 Rest of Europe
- 12. Asia Pacific Digital Badges Industry Analysis, Insights and Forecast, 2019-2031
- 12.1. Market Analysis, Insights and Forecast - By Country/Sub-region
- 12.1.1 China
- 12.1.2 Japan
- 12.1.3 India
- 12.1.4 South Korea
- 12.1.5 Southeast Asia
- 12.1.6 Australia
- 12.1.7 Indonesia
- 12.1.8 Phillipes
- 12.1.9 Singapore
- 12.1.10 Thailandc
- 12.1.11 Rest of Asia Pacific
- 13. South America Digital Badges Industry Analysis, Insights and Forecast, 2019-2031
- 13.1. Market Analysis, Insights and Forecast - By Country/Sub-region
- 13.1.1 Brazil
- 13.1.2 Argentina
- 13.1.3 Peru
- 13.1.4 Chile
- 13.1.5 Colombia
- 13.1.6 Ecuador
- 13.1.7 Venezuela
- 13.1.8 Rest of South America
- 14. North America Digital Badges Industry Analysis, Insights and Forecast, 2019-2031
- 14.1. Market Analysis, Insights and Forecast - By Country/Sub-region
- 14.1.1 United States
- 14.1.2 Canada
- 14.1.3 Mexico
- 15. MEA Digital Badges Industry Analysis, Insights and Forecast, 2019-2031
- 15.1. Market Analysis, Insights and Forecast - By Country/Sub-region
- 15.1.1 United Arab Emirates
- 15.1.2 Saudi Arabia
- 15.1.3 South Africa
- 15.1.4 Rest of Middle East and Africa
- 16. Competitive Analysis
- 16.1. Global Market Share Analysis 2024
- 16.2. Company Profiles
- 16.2.1 Concentric Sky Inc
- 16.2.1.1. Overview
- 16.2.1.2. Products
- 16.2.1.3. SWOT Analysis
- 16.2.1.4. Recent Developments
- 16.2.1.5. Financials (Based on Availability)
- 16.2.2 ProExam
- 16.2.2.1. Overview
- 16.2.2.2. Products
- 16.2.2.3. SWOT Analysis
- 16.2.2.4. Recent Developments
- 16.2.2.5. Financials (Based on Availability)
- 16.2.3 ARMA International
- 16.2.3.1. Overview
- 16.2.3.2. Products
- 16.2.3.3. SWOT Analysis
- 16.2.3.4. Recent Developments
- 16.2.3.5. Financials (Based on Availability)
- 16.2.4 Forall Systems Inc
- 16.2.4.1. Overview
- 16.2.4.2. Products
- 16.2.4.3. SWOT Analysis
- 16.2.4.4. Recent Developments
- 16.2.4.5. Financials (Based on Availability)
- 16.2.5 Accredible
- 16.2.5.1. Overview
- 16.2.5.2. Products
- 16.2.5.3. SWOT Analysis
- 16.2.5.4. Recent Developments
- 16.2.5.5. Financials (Based on Availability)
- 16.2.6 Badgecraf
- 16.2.6.1. Overview
- 16.2.6.2. Products
- 16.2.6.3. SWOT Analysis
- 16.2.6.4. Recent Developments
- 16.2.6.5. Financials (Based on Availability)
- 16.2.7 Skillsoft Corporation
- 16.2.7.1. Overview
- 16.2.7.2. Products
- 16.2.7.3. SWOT Analysis
- 16.2.7.4. Recent Developments
- 16.2.7.5. Financials (Based on Availability)
- 16.2.8 Portfolium Inc
- 16.2.8.1. Overview
- 16.2.8.2. Products
- 16.2.8.3. SWOT Analysis
- 16.2.8.4. Recent Developments
- 16.2.8.5. Financials (Based on Availability)
- 16.2.9 AXELOS
- 16.2.9.1. Overview
- 16.2.9.2. Products
- 16.2.9.3. SWOT Analysis
- 16.2.9.4. Recent Developments
- 16.2.9.5. Financials (Based on Availability)
- 16.2.10 Credly Inc
- 16.2.10.1. Overview
- 16.2.10.2. Products
- 16.2.10.3. SWOT Analysis
- 16.2.10.4. Recent Developments
- 16.2.10.5. Financials (Based on Availability)
- 16.2.11 International Institute of Business Analysis
- 16.2.11.1. Overview
- 16.2.11.2. Products
- 16.2.11.3. SWOT Analysis
- 16.2.11.4. Recent Developments
- 16.2.11.5. Financials (Based on Availability)
- 16.2.1 Concentric Sky Inc
List of Figures
- Figure 1: Global Digital Badges Industry Revenue Breakdown (Million, %) by Region 2024 & 2032
- Figure 2: Global Digital Badges Industry Volume Breakdown (K Unit, %) by Region 2024 & 2032
- Figure 3: North America Digital Badges Industry Revenue (Million), by Country 2024 & 2032
- Figure 4: North America Digital Badges Industry Volume (K Unit), by Country 2024 & 2032
- Figure 5: North America Digital Badges Industry Revenue Share (%), by Country 2024 & 2032
- Figure 6: North America Digital Badges Industry Volume Share (%), by Country 2024 & 2032
- Figure 7: Europe Digital Badges Industry Revenue (Million), by Country 2024 & 2032
- Figure 8: Europe Digital Badges Industry Volume (K Unit), by Country 2024 & 2032
- Figure 9: Europe Digital Badges Industry Revenue Share (%), by Country 2024 & 2032
- Figure 10: Europe Digital Badges Industry Volume Share (%), by Country 2024 & 2032
- Figure 11: Asia Pacific Digital Badges Industry Revenue (Million), by Country 2024 & 2032
- Figure 12: Asia Pacific Digital Badges Industry Volume (K Unit), by Country 2024 & 2032
- Figure 13: Asia Pacific Digital Badges Industry Revenue Share (%), by Country 2024 & 2032
- Figure 14: Asia Pacific Digital Badges Industry Volume Share (%), by Country 2024 & 2032
- Figure 15: South America Digital Badges Industry Revenue (Million), by Country 2024 & 2032
- Figure 16: South America Digital Badges Industry Volume (K Unit), by Country 2024 & 2032
- Figure 17: South America Digital Badges Industry Revenue Share (%), by Country 2024 & 2032
- Figure 18: South America Digital Badges Industry Volume Share (%), by Country 2024 & 2032
- Figure 19: North America Digital Badges Industry Revenue (Million), by Country 2024 & 2032
- Figure 20: North America Digital Badges Industry Volume (K Unit), by Country 2024 & 2032
- Figure 21: North America Digital Badges Industry Revenue Share (%), by Country 2024 & 2032
- Figure 22: North America Digital Badges Industry Volume Share (%), by Country 2024 & 2032
- Figure 23: MEA Digital Badges Industry Revenue (Million), by Country 2024 & 2032
- Figure 24: MEA Digital Badges Industry Volume (K Unit), by Country 2024 & 2032
- Figure 25: MEA Digital Badges Industry Revenue Share (%), by Country 2024 & 2032
- Figure 26: MEA Digital Badges Industry Volume Share (%), by Country 2024 & 2032
- Figure 27: North America Digital Badges Industry Revenue (Million), by End-user 2024 & 2032
- Figure 28: North America Digital Badges Industry Volume (K Unit), by End-user 2024 & 2032
- Figure 29: North America Digital Badges Industry Revenue Share (%), by End-user 2024 & 2032
- Figure 30: North America Digital Badges Industry Volume Share (%), by End-user 2024 & 2032
- Figure 31: North America Digital Badges Industry Revenue (Million), by Country 2024 & 2032
- Figure 32: North America Digital Badges Industry Volume (K Unit), by Country 2024 & 2032
- Figure 33: North America Digital Badges Industry Revenue Share (%), by Country 2024 & 2032
- Figure 34: North America Digital Badges Industry Volume Share (%), by Country 2024 & 2032
- Figure 35: Europe Digital Badges Industry Revenue (Million), by End-user 2024 & 2032
- Figure 36: Europe Digital Badges Industry Volume (K Unit), by End-user 2024 & 2032
- Figure 37: Europe Digital Badges Industry Revenue Share (%), by End-user 2024 & 2032
- Figure 38: Europe Digital Badges Industry Volume Share (%), by End-user 2024 & 2032
- Figure 39: Europe Digital Badges Industry Revenue (Million), by Country 2024 & 2032
- Figure 40: Europe Digital Badges Industry Volume (K Unit), by Country 2024 & 2032
- Figure 41: Europe Digital Badges Industry Revenue Share (%), by Country 2024 & 2032
- Figure 42: Europe Digital Badges Industry Volume Share (%), by Country 2024 & 2032
- Figure 43: Asia Pacific Digital Badges Industry Revenue (Million), by End-user 2024 & 2032
- Figure 44: Asia Pacific Digital Badges Industry Volume (K Unit), by End-user 2024 & 2032
- Figure 45: Asia Pacific Digital Badges Industry Revenue Share (%), by End-user 2024 & 2032
- Figure 46: Asia Pacific Digital Badges Industry Volume Share (%), by End-user 2024 & 2032
- Figure 47: Asia Pacific Digital Badges Industry Revenue (Million), by Country 2024 & 2032
- Figure 48: Asia Pacific Digital Badges Industry Volume (K Unit), by Country 2024 & 2032
- Figure 49: Asia Pacific Digital Badges Industry Revenue Share (%), by Country 2024 & 2032
- Figure 50: Asia Pacific Digital Badges Industry Volume Share (%), by Country 2024 & 2032
- Figure 51: Rest of the World Digital Badges Industry Revenue (Million), by End-user 2024 & 2032
- Figure 52: Rest of the World Digital Badges Industry Volume (K Unit), by End-user 2024 & 2032
- Figure 53: Rest of the World Digital Badges Industry Revenue Share (%), by End-user 2024 & 2032
- Figure 54: Rest of the World Digital Badges Industry Volume Share (%), by End-user 2024 & 2032
- Figure 55: Rest of the World Digital Badges Industry Revenue (Million), by Country 2024 & 2032
- Figure 56: Rest of the World Digital Badges Industry Volume (K Unit), by Country 2024 & 2032
- Figure 57: Rest of the World Digital Badges Industry Revenue Share (%), by Country 2024 & 2032
- Figure 58: Rest of the World Digital Badges Industry Volume Share (%), by Country 2024 & 2032
List of Tables
- Table 1: Global Digital Badges Industry Revenue Million Forecast, by Region 2019 & 2032
- Table 2: Global Digital Badges Industry Volume K Unit Forecast, by Region 2019 & 2032
- Table 3: Global Digital Badges Industry Revenue Million Forecast, by End-user 2019 & 2032
- Table 4: Global Digital Badges Industry Volume K Unit Forecast, by End-user 2019 & 2032
- Table 5: Global Digital Badges Industry Revenue Million Forecast, by Region 2019 & 2032
- Table 6: Global Digital Badges Industry Volume K Unit Forecast, by Region 2019 & 2032
- Table 7: Global Digital Badges Industry Revenue Million Forecast, by Country 2019 & 2032
- Table 8: Global Digital Badges Industry Volume K Unit Forecast, by Country 2019 & 2032
- Table 9: United States Digital Badges Industry Revenue (Million) Forecast, by Application 2019 & 2032
- Table 10: United States Digital Badges Industry Volume (K Unit) Forecast, by Application 2019 & 2032
- Table 11: Canada Digital Badges Industry Revenue (Million) Forecast, by Application 2019 & 2032
- Table 12: Canada Digital Badges Industry Volume (K Unit) Forecast, by Application 2019 & 2032
- Table 13: Mexico Digital Badges Industry Revenue (Million) Forecast, by Application 2019 & 2032
- Table 14: Mexico Digital Badges Industry Volume (K Unit) Forecast, by Application 2019 & 2032
- Table 15: Global Digital Badges Industry Revenue Million Forecast, by Country 2019 & 2032
- Table 16: Global Digital Badges Industry Volume K Unit Forecast, by Country 2019 & 2032
- Table 17: Germany Digital Badges Industry Revenue (Million) Forecast, by Application 2019 & 2032
- Table 18: Germany Digital Badges Industry Volume (K Unit) Forecast, by Application 2019 & 2032
- Table 19: United Kingdom Digital Badges Industry Revenue (Million) Forecast, by Application 2019 & 2032
- Table 20: United Kingdom Digital Badges Industry Volume (K Unit) Forecast, by Application 2019 & 2032
- Table 21: France Digital Badges Industry Revenue (Million) Forecast, by Application 2019 & 2032
- Table 22: France Digital Badges Industry Volume (K Unit) Forecast, by Application 2019 & 2032
- Table 23: Spain Digital Badges Industry Revenue (Million) Forecast, by Application 2019 & 2032
- Table 24: Spain Digital Badges Industry Volume (K Unit) Forecast, by Application 2019 & 2032
- Table 25: Italy Digital Badges Industry Revenue (Million) Forecast, by Application 2019 & 2032
- Table 26: Italy Digital Badges Industry Volume (K Unit) Forecast, by Application 2019 & 2032
- Table 27: Spain Digital Badges Industry Revenue (Million) Forecast, by Application 2019 & 2032
- Table 28: Spain Digital Badges Industry Volume (K Unit) Forecast, by Application 2019 & 2032
- Table 29: Belgium Digital Badges Industry Revenue (Million) Forecast, by Application 2019 & 2032
- Table 30: Belgium Digital Badges Industry Volume (K Unit) Forecast, by Application 2019 & 2032
- Table 31: Netherland Digital Badges Industry Revenue (Million) Forecast, by Application 2019 & 2032
- Table 32: Netherland Digital Badges Industry Volume (K Unit) Forecast, by Application 2019 & 2032
- Table 33: Nordics Digital Badges Industry Revenue (Million) Forecast, by Application 2019 & 2032
- Table 34: Nordics Digital Badges Industry Volume (K Unit) Forecast, by Application 2019 & 2032
- Table 35: Rest of Europe Digital Badges Industry Revenue (Million) Forecast, by Application 2019 & 2032
- Table 36: Rest of Europe Digital Badges Industry Volume (K Unit) Forecast, by Application 2019 & 2032
- Table 37: Global Digital Badges Industry Revenue Million Forecast, by Country 2019 & 2032
- Table 38: Global Digital Badges Industry Volume K Unit Forecast, by Country 2019 & 2032
- Table 39: China Digital Badges Industry Revenue (Million) Forecast, by Application 2019 & 2032
- Table 40: China Digital Badges Industry Volume (K Unit) Forecast, by Application 2019 & 2032
- Table 41: Japan Digital Badges Industry Revenue (Million) Forecast, by Application 2019 & 2032
- Table 42: Japan Digital Badges Industry Volume (K Unit) Forecast, by Application 2019 & 2032
- Table 43: India Digital Badges Industry Revenue (Million) Forecast, by Application 2019 & 2032
- Table 44: India Digital Badges Industry Volume (K Unit) Forecast, by Application 2019 & 2032
- Table 45: South Korea Digital Badges Industry Revenue (Million) Forecast, by Application 2019 & 2032
- Table 46: South Korea Digital Badges Industry Volume (K Unit) Forecast, by Application 2019 & 2032
- Table 47: Southeast Asia Digital Badges Industry Revenue (Million) Forecast, by Application 2019 & 2032
- Table 48: Southeast Asia Digital Badges Industry Volume (K Unit) Forecast, by Application 2019 & 2032
- Table 49: Australia Digital Badges Industry Revenue (Million) Forecast, by Application 2019 & 2032
- Table 50: Australia Digital Badges Industry Volume (K Unit) Forecast, by Application 2019 & 2032
- Table 51: Indonesia Digital Badges Industry Revenue (Million) Forecast, by Application 2019 & 2032
- Table 52: Indonesia Digital Badges Industry Volume (K Unit) Forecast, by Application 2019 & 2032
- Table 53: Phillipes Digital Badges Industry Revenue (Million) Forecast, by Application 2019 & 2032
- Table 54: Phillipes Digital Badges Industry Volume (K Unit) Forecast, by Application 2019 & 2032
- Table 55: Singapore Digital Badges Industry Revenue (Million) Forecast, by Application 2019 & 2032
- Table 56: Singapore Digital Badges Industry Volume (K Unit) Forecast, by Application 2019 & 2032
- Table 57: Thailandc Digital Badges Industry Revenue (Million) Forecast, by Application 2019 & 2032
- Table 58: Thailandc Digital Badges Industry Volume (K Unit) Forecast, by Application 2019 & 2032
- Table 59: Rest of Asia Pacific Digital Badges Industry Revenue (Million) Forecast, by Application 2019 & 2032
- Table 60: Rest of Asia Pacific Digital Badges Industry Volume (K Unit) Forecast, by Application 2019 & 2032
- Table 61: Global Digital Badges Industry Revenue Million Forecast, by Country 2019 & 2032
- Table 62: Global Digital Badges Industry Volume K Unit Forecast, by Country 2019 & 2032
- Table 63: Brazil Digital Badges Industry Revenue (Million) Forecast, by Application 2019 & 2032
- Table 64: Brazil Digital Badges Industry Volume (K Unit) Forecast, by Application 2019 & 2032
- Table 65: Argentina Digital Badges Industry Revenue (Million) Forecast, by Application 2019 & 2032
- Table 66: Argentina Digital Badges Industry Volume (K Unit) Forecast, by Application 2019 & 2032
- Table 67: Peru Digital Badges Industry Revenue (Million) Forecast, by Application 2019 & 2032
- Table 68: Peru Digital Badges Industry Volume (K Unit) Forecast, by Application 2019 & 2032
- Table 69: Chile Digital Badges Industry Revenue (Million) Forecast, by Application 2019 & 2032
- Table 70: Chile Digital Badges Industry Volume (K Unit) Forecast, by Application 2019 & 2032
- Table 71: Colombia Digital Badges Industry Revenue (Million) Forecast, by Application 2019 & 2032
- Table 72: Colombia Digital Badges Industry Volume (K Unit) Forecast, by Application 2019 & 2032
- Table 73: Ecuador Digital Badges Industry Revenue (Million) Forecast, by Application 2019 & 2032
- Table 74: Ecuador Digital Badges Industry Volume (K Unit) Forecast, by Application 2019 & 2032
- Table 75: Venezuela Digital Badges Industry Revenue (Million) Forecast, by Application 2019 & 2032
- Table 76: Venezuela Digital Badges Industry Volume (K Unit) Forecast, by Application 2019 & 2032
- Table 77: Rest of South America Digital Badges Industry Revenue (Million) Forecast, by Application 2019 & 2032
- Table 78: Rest of South America Digital Badges Industry Volume (K Unit) Forecast, by Application 2019 & 2032
- Table 79: Global Digital Badges Industry Revenue Million Forecast, by Country 2019 & 2032
- Table 80: Global Digital Badges Industry Volume K Unit Forecast, by Country 2019 & 2032
- Table 81: United States Digital Badges Industry Revenue (Million) Forecast, by Application 2019 & 2032
- Table 82: United States Digital Badges Industry Volume (K Unit) Forecast, by Application 2019 & 2032
- Table 83: Canada Digital Badges Industry Revenue (Million) Forecast, by Application 2019 & 2032
- Table 84: Canada Digital Badges Industry Volume (K Unit) Forecast, by Application 2019 & 2032
- Table 85: Mexico Digital Badges Industry Revenue (Million) Forecast, by Application 2019 & 2032
- Table 86: Mexico Digital Badges Industry Volume (K Unit) Forecast, by Application 2019 & 2032
- Table 87: Global Digital Badges Industry Revenue Million Forecast, by Country 2019 & 2032
- Table 88: Global Digital Badges Industry Volume K Unit Forecast, by Country 2019 & 2032
- Table 89: United Arab Emirates Digital Badges Industry Revenue (Million) Forecast, by Application 2019 & 2032
- Table 90: United Arab Emirates Digital Badges Industry Volume (K Unit) Forecast, by Application 2019 & 2032
- Table 91: Saudi Arabia Digital Badges Industry Revenue (Million) Forecast, by Application 2019 & 2032
- Table 92: Saudi Arabia Digital Badges Industry Volume (K Unit) Forecast, by Application 2019 & 2032
- Table 93: South Africa Digital Badges Industry Revenue (Million) Forecast, by Application 2019 & 2032
- Table 94: South Africa Digital Badges Industry Volume (K Unit) Forecast, by Application 2019 & 2032
- Table 95: Rest of Middle East and Africa Digital Badges Industry Revenue (Million) Forecast, by Application 2019 & 2032
- Table 96: Rest of Middle East and Africa Digital Badges Industry Volume (K Unit) Forecast, by Application 2019 & 2032
- Table 97: Global Digital Badges Industry Revenue Million Forecast, by End-user 2019 & 2032
- Table 98: Global Digital Badges Industry Volume K Unit Forecast, by End-user 2019 & 2032
- Table 99: Global Digital Badges Industry Revenue Million Forecast, by Country 2019 & 2032
- Table 100: Global Digital Badges Industry Volume K Unit Forecast, by Country 2019 & 2032
- Table 101: Global Digital Badges Industry Revenue Million Forecast, by End-user 2019 & 2032
- Table 102: Global Digital Badges Industry Volume K Unit Forecast, by End-user 2019 & 2032
- Table 103: Global Digital Badges Industry Revenue Million Forecast, by Country 2019 & 2032
- Table 104: Global Digital Badges Industry Volume K Unit Forecast, by Country 2019 & 2032
- Table 105: Global Digital Badges Industry Revenue Million Forecast, by End-user 2019 & 2032
- Table 106: Global Digital Badges Industry Volume K Unit Forecast, by End-user 2019 & 2032
- Table 107: Global Digital Badges Industry Revenue Million Forecast, by Country 2019 & 2032
- Table 108: Global Digital Badges Industry Volume K Unit Forecast, by Country 2019 & 2032
- Table 109: Global Digital Badges Industry Revenue Million Forecast, by End-user 2019 & 2032
- Table 110: Global Digital Badges Industry Volume K Unit Forecast, by End-user 2019 & 2032
- Table 111: Global Digital Badges Industry Revenue Million Forecast, by Country 2019 & 2032
- Table 112: Global Digital Badges Industry Volume K Unit Forecast, by Country 2019 & 2032
Frequently Asked Questions
1. What is the projected Compound Annual Growth Rate (CAGR) of the Digital Badges Industry?
The projected CAGR is approximately 17.38%.
2. Which companies are prominent players in the Digital Badges Industry?
Key companies in the market include Concentric Sky Inc, ProExam, ARMA International, Forall Systems Inc, Accredible, Badgecraf, Skillsoft Corporation, Portfolium Inc, AXELOS, Credly Inc, International Institute of Business Analysis.
3. What are the main segments of the Digital Badges Industry?
The market segments include End-user.
4. Can you provide details about the market size?
The market size is estimated to be USD 202.29 Million as of 2022.
5. What are some drivers contributing to market growth?
Increasing Focus on Online Learning.
6. What are the notable trends driving market growth?
Academic Segment to Occupy a Significant Market Share.
7. Are there any restraints impacting market growth?
Lack of IT Infrastructure in Developing Regions.
8. Can you provide examples of recent developments in the market?
June 2023: Skilljar has announced a partnership with Accredible; Issuing organizations can seamlessly connect their Skilljar training content with their credentialing program through the new Accredible Integration with Skilljar. This API integration offers learners a more streamlined and engaging experience, enhancing your credentials' market value and relevance.
9. What pricing options are available for accessing the report?
Pricing options include single-user, multi-user, and enterprise licenses priced at USD 4750, USD 5250, and USD 8750 respectively.
10. Is the market size provided in terms of value or volume?
The market size is provided in terms of value, measured in Million and volume, measured in K Unit.
11. Are there any specific market keywords associated with the report?
Yes, the market keyword associated with the report is "Digital Badges Industry," which aids in identifying and referencing the specific market segment covered.
12. How do I determine which pricing option suits my needs best?
The pricing options vary based on user requirements and access needs. Individual users may opt for single-user licenses, while businesses requiring broader access may choose multi-user or enterprise licenses for cost-effective access to the report.
13. Are there any additional resources or data provided in the Digital Badges Industry report?
While the report offers comprehensive insights, it's advisable to review the specific contents or supplementary materials provided to ascertain if additional resources or data are available.
14. How can I stay updated on further developments or reports in the Digital Badges Industry?
To stay informed about further developments, trends, and reports in the Digital Badges Industry, consider subscribing to industry newsletters, following relevant companies and organizations, or regularly checking reputable industry news sources and publications.
Methodology
Step 1 - Identification of Relevant Samples Size from Population Database


Step 2 - Approaches for Defining Global Market Size (Value, Volume* & Price*)

Note*: In applicable scenarios
Step 3 - Data Sources
Primary Research
- Web Analytics
- Survey Reports
- Research Institute
- Latest Research Reports
- Opinion Leaders
Secondary Research
- Annual Reports
- White Paper
- Latest Press Release
- Industry Association
- Paid Database
- Investor Presentations

Step 4 - Data Triangulation
Involves using different sources of information in order to increase the validity of a study
These sources are likely to be stakeholders in a program - participants, other researchers, program staff, other community members, and so on.
Then we put all data in single framework & apply various statistical tools to find out the dynamic on the market.
During the analysis stage, feedback from the stakeholder groups would be compared to determine areas of agreement as well as areas of divergence
