

Key Insights
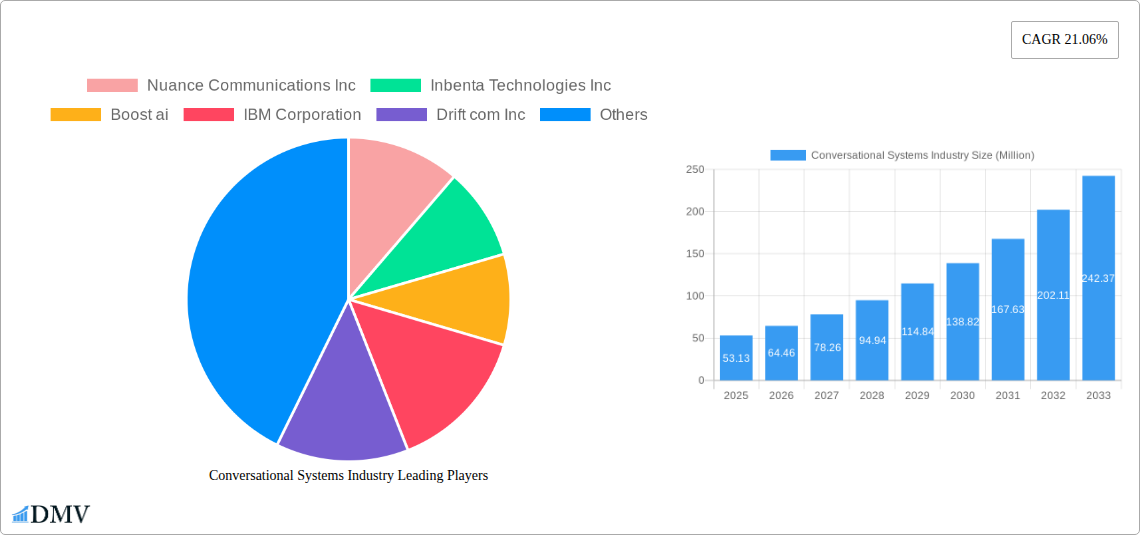
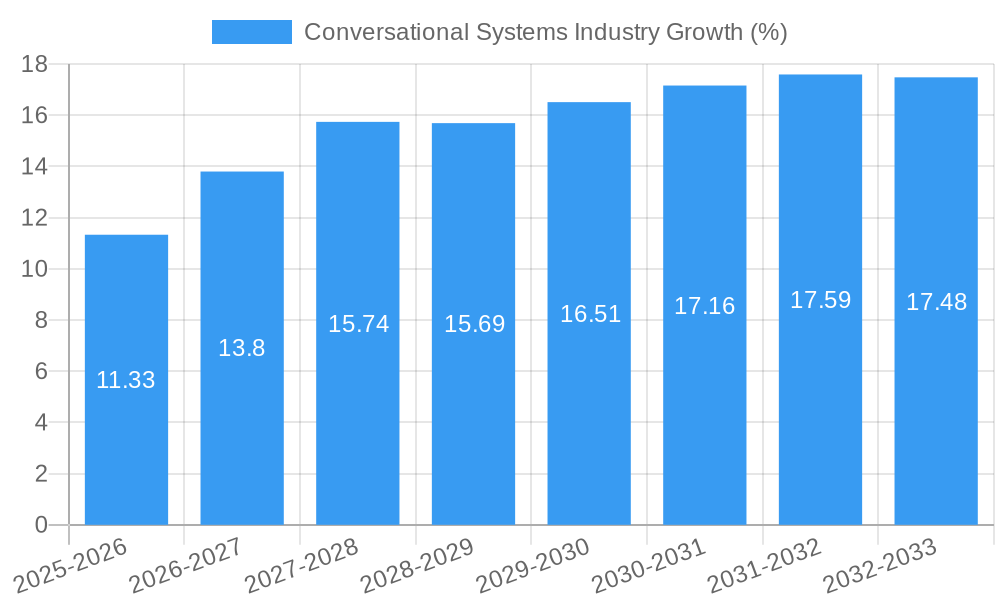
The Conversational Systems market is experiencing robust growth, projected to reach \$53.13 million in 2025 and exhibiting a remarkable Compound Annual Growth Rate (CAGR) of 21.06%. This expansion is fueled by several key drivers. Increasing digital transformation initiatives across various industries, coupled with the rising adoption of artificial intelligence (AI) and machine learning (ML) technologies, are significantly boosting the demand for conversational systems. Businesses are increasingly leveraging these systems to enhance customer engagement, streamline operations, and improve overall efficiency. The shift towards cloud-based deployments offers scalability and cost-effectiveness, further accelerating market growth. The integration of conversational systems across diverse end-user verticals, including IT & Telecommunications, BFSI, and retail, is broadening the market's scope. Furthermore, advancements in natural language processing (NLP) and speech recognition are enhancing the user experience, making these systems more intuitive and user-friendly.
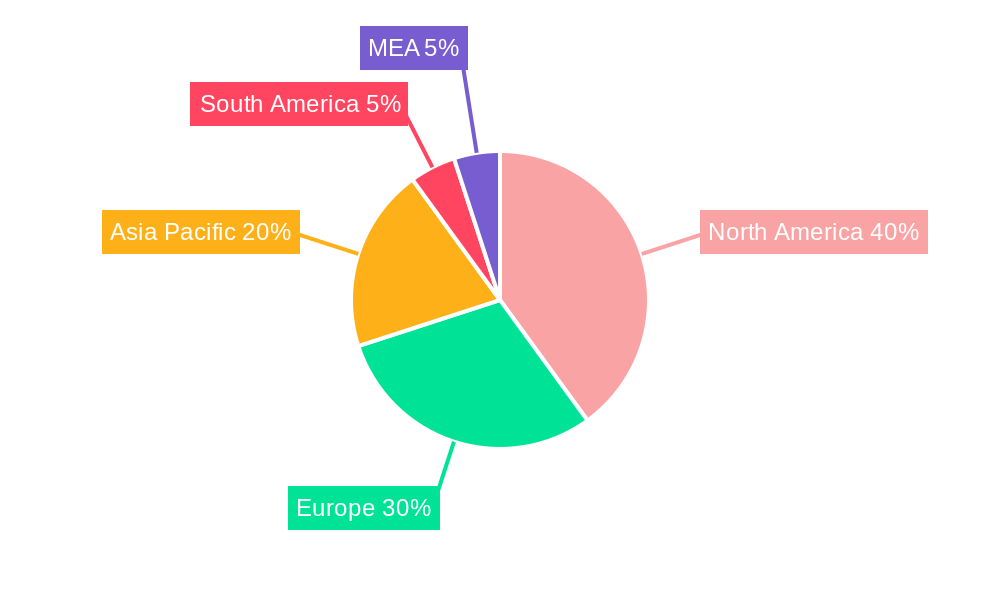
However, several restraints are likely to influence the market's trajectory. Data security and privacy concerns are paramount, especially with the increasing reliance on sensitive customer information. The complexity and cost associated with implementing and maintaining these systems can pose a challenge for smaller enterprises. Moreover, the need for continuous training and updates to maintain accuracy and relevance is an ongoing requirement. Despite these constraints, the long-term outlook remains positive, driven by technological advancements, increasing digital adoption, and the growing demand for personalized customer experiences. The market segmentation reveals a strong preference for cloud-based deployments and a diverse range of applications across various industry sectors. The multi-modal approach, combining voice and text interfaces, is gaining significant traction, reflecting the user preference for flexible interaction methods. North America and Europe are expected to maintain significant market share due to early adoption and technological advancements, while the Asia-Pacific region is projected to witness significant growth in the coming years.
Conversational Systems Industry Market Report: 2019-2033
This comprehensive report provides a detailed analysis of the Conversational Systems industry, projecting a market value exceeding $XX Million by 2033. We examine market dynamics, technological advancements, and key player strategies to offer stakeholders a clear understanding of this rapidly evolving sector. The report covers the period from 2019 to 2033, with 2025 serving as the base and estimated year.
Conversational Systems Industry Market Composition & Trends
The Conversational Systems market, valued at $XX Million in 2024, is experiencing robust growth driven by increasing digital transformation initiatives across various sectors. Market concentration is moderate, with key players like Nuance Communications Inc, IBM Corporation, Google LLC (Alphabet Inc), Microsoft Corporation, and Amazon Web Services Inc. holding significant market share. However, the landscape is dynamic, with numerous smaller players and startups contributing to innovation.
- Market Share Distribution (2024): Google LLC (Alphabet Inc.) - XX%; IBM Corporation - XX%; Nuance Communications Inc - XX%; Others - XX%
- Innovation Catalysts: Advancements in Natural Language Processing (NLP), Machine Learning (ML), and Artificial Intelligence (AI) are fueling innovation, enabling more sophisticated and human-like interactions.
- Regulatory Landscape: Data privacy regulations (e.g., GDPR, CCPA) are shaping the market, influencing data security protocols and user consent mechanisms.
- Substitute Products: Traditional customer service methods (e.g., phone calls, emails) still compete, but the efficiency and scalability of conversational systems are steadily eroding their market share.
- End-User Profiles: Large enterprises are currently the primary adopters, but increasing affordability and accessibility are driving adoption among SMEs.
- M&A Activities: The last five years have witnessed several significant M&A deals, totaling over $XX Million in value, highlighting consolidation and strategic expansion within the industry. Examples include [mention specific examples if available, otherwise remove this bullet].
Conversational Systems Industry Evolution
The Conversational Systems market exhibits a compound annual growth rate (CAGR) of XX% during the forecast period (2025-2033), propelled by several factors. Technological advancements, such as improved NLP algorithms and the integration of multi-modal interactions (voice, text, visuals), are enhancing user experience and expanding application possibilities. Consumer demand for 24/7 availability, personalized experiences, and seamless interactions is driving widespread adoption across various industries. Adoption rates are particularly high in sectors like BFSI and IT & Telecommunications, reflecting the value proposition of improved customer service, operational efficiency, and cost reduction. The market is witnessing a transition from rule-based systems to AI-powered, context-aware conversational AI, allowing for more dynamic and nuanced interactions. By 2033, the market is projected to reach $XX Million, reflecting the sustained growth trajectory.
Leading Regions, Countries, or Segments in Conversational Systems Industry
The Cloud segment dominates the Conversational Systems market, accounting for XX% of the total revenue in 2024, primarily due to its scalability, cost-effectiveness, and ease of deployment. Large enterprises also represent a significant segment, driven by their higher budgets and the potential for substantial ROI from improved operational efficiency and customer engagement.
- Key Drivers:
- Investment Trends: Significant venture capital and private equity investments are fueling growth and innovation.
- Regulatory Support: Government initiatives promoting digital transformation and AI adoption are creating a favorable market environment.
- Dominance Factors:
- Cloud Deployment: Scalability, cost-effectiveness, and accessibility drive strong growth in this segment.
- Large Enterprises: Higher budgets, greater demand for advanced features, and potential for significant ROI lead to higher adoption rates.
- BFSI & IT & Telecommunications Verticals: These sectors are early adopters, driven by the need for improved customer service and operational efficiency.
Conversational Systems Industry Product Innovations
Recent innovations in conversational systems include advanced NLP models capable of handling complex language nuances, context-aware AI that personalize interactions, and multi-modal interfaces integrating voice, text, and visual elements. These advancements are delivering enhanced user experiences, improved accuracy, and increased efficiency, while unique selling propositions are focused on ease of integration, cost savings and superior customer engagement.
Propelling Factors for Conversational Systems Industry Growth
Several factors contribute to the growth of the Conversational Systems market. Technological advancements in AI and NLP are constantly improving the capabilities of these systems, making them more accurate, efficient, and user-friendly. The increasing demand for automated customer service and improved operational efficiency across industries fuels adoption. Furthermore, favorable government policies and initiatives promoting digital transformation further stimulate market growth.
Obstacles in the Conversational Systems Industry Market
Despite its potential, the Conversational Systems market faces several challenges. Data privacy concerns and regulatory compliance are significant barriers, requiring robust security and data governance measures. Integration complexities, high initial implementation costs, and the need for skilled personnel can also hinder adoption. The competitive landscape, with numerous established players and startups, also creates significant pressure.
Future Opportunities in Conversational Systems Industry
The future of Conversational Systems presents significant opportunities. Expanding into new sectors, such as healthcare and education, presents untapped potential. Advancements in AI, such as the development of more sophisticated NLP models and multi-modal interactions, will further enhance capabilities and user experiences. The increasing demand for personalized and hyper-personalized interactions will fuel market growth.
Major Players in the Conversational Systems Industry Ecosystem
- Nuance Communications Inc
- Inbenta Technologies Inc
- Boost ai
- IBM Corporation
- Drift com Inc
- Google LLC (Alphabet Inc)
- Microsoft Corporation
- Amazon Web Services Inc
- Oracle Corporation
- SAP SE
Key Developments in Conversational Systems Industry
- March 2023: Google LLC (Alphabet Inc.) announced plans to integrate AI into healthcare initiatives, impacting medical examinations, research, and app development.
- November 2022: Moveworks partnered with Wipro Ltd., offering collaborative solutions for improved IT efficiency.
- May 2022: DRUID and BARQ Systems partnered to accelerate digital transformation and RPA implementations in the MEA region.
Strategic Conversational Systems Industry Market Forecast
The Conversational Systems market is poised for sustained growth, driven by continuous technological advancements, increasing demand for efficient customer service, and expanding applications across diverse sectors. The market's potential is vast, with opportunities for innovation and expansion into new markets and applications. The focus on AI-driven personalization and improved user experiences will continue to shape market dynamics.
Conversational Systems Industry Segmentation
-
1. Modality Type
- 1.1. Uni-Modal
- 1.2. Multi-Modal
-
2. Type
- 2.1. Voice Assisted
- 2.2. Text Assisted
- 2.3. Other Types
-
3. Deployment
- 3.1. On-Premise
- 3.2. Cloud
-
4. Enterprise Size
- 4.1. Small & Medium Enterprises
- 4.2. Large Enterprises
-
5. End-user Verticals
- 5.1. IT & Telecommunication
- 5.2. BFSI
- 5.3. Government
- 5.4. Retail
- 5.5. Energy & Power
- 5.6. Other En
Conversational Systems Industry Segmentation By Geography
- 1. North America
- 2. Europe
- 3. Asia
- 4. Australia and New Zealand
- 5. Latin America
- 6. Middle East and Africa
Conversational Systems Industry REPORT HIGHLIGHTS
| Aspects | Details |
|---|---|
| Study Period | 2019-2033 |
| Base Year | 2024 |
| Estimated Year | 2025 |
| Forecast Period | 2025-2033 |
| Historical Period | 2019-2024 |
| Growth Rate | CAGR of 21.06% from 2019-2033 |
| Segmentation |
|
Table of Contents
- 1. Introduction
- 1.1. Research Scope
- 1.2. Market Segmentation
- 1.3. Research Methodology
- 1.4. Definitions and Assumptions
- 2. Executive Summary
- 2.1. Introduction
- 3. Market Dynamics
- 3.1. Introduction
- 3.2. Market Drivers
- 3.2.1. Rising Usage of AI-based Solutions for Customer Services
- 3.3. Market Restrains
- 3.3.1. Lack of Cybersecurity Professionals; High Reliance on Traditional Authentication Methods and Low Preparedness
- 3.4. Market Trends
- 3.4.1. Rising Usage of AI-based Solutions for Customer Services Drives the Market Growth
- 4. Market Factor Analysis
- 4.1. Porters Five Forces
- 4.2. Supply/Value Chain
- 4.3. PESTEL analysis
- 4.4. Market Entropy
- 4.5. Patent/Trademark Analysis
- 5. Global Conversational Systems Industry Analysis, Insights and Forecast, 2019-2031
- 5.1. Market Analysis, Insights and Forecast - by Modality Type
- 5.1.1. Uni-Modal
- 5.1.2. Multi-Modal
- 5.2. Market Analysis, Insights and Forecast - by Type
- 5.2.1. Voice Assisted
- 5.2.2. Text Assisted
- 5.2.3. Other Types
- 5.3. Market Analysis, Insights and Forecast - by Deployment
- 5.3.1. On-Premise
- 5.3.2. Cloud
- 5.4. Market Analysis, Insights and Forecast - by Enterprise Size
- 5.4.1. Small & Medium Enterprises
- 5.4.2. Large Enterprises
- 5.5. Market Analysis, Insights and Forecast - by End-user Verticals
- 5.5.1. IT & Telecommunication
- 5.5.2. BFSI
- 5.5.3. Government
- 5.5.4. Retail
- 5.5.5. Energy & Power
- 5.5.6. Other En
- 5.6. Market Analysis, Insights and Forecast - by Region
- 5.6.1. North America
- 5.6.2. Europe
- 5.6.3. Asia
- 5.6.4. Australia and New Zealand
- 5.6.5. Latin America
- 5.6.6. Middle East and Africa
- 5.1. Market Analysis, Insights and Forecast - by Modality Type
- 6. North America Conversational Systems Industry Analysis, Insights and Forecast, 2019-2031
- 6.1. Market Analysis, Insights and Forecast - by Modality Type
- 6.1.1. Uni-Modal
- 6.1.2. Multi-Modal
- 6.2. Market Analysis, Insights and Forecast - by Type
- 6.2.1. Voice Assisted
- 6.2.2. Text Assisted
- 6.2.3. Other Types
- 6.3. Market Analysis, Insights and Forecast - by Deployment
- 6.3.1. On-Premise
- 6.3.2. Cloud
- 6.4. Market Analysis, Insights and Forecast - by Enterprise Size
- 6.4.1. Small & Medium Enterprises
- 6.4.2. Large Enterprises
- 6.5. Market Analysis, Insights and Forecast - by End-user Verticals
- 6.5.1. IT & Telecommunication
- 6.5.2. BFSI
- 6.5.3. Government
- 6.5.4. Retail
- 6.5.5. Energy & Power
- 6.5.6. Other En
- 6.1. Market Analysis, Insights and Forecast - by Modality Type
- 7. Europe Conversational Systems Industry Analysis, Insights and Forecast, 2019-2031
- 7.1. Market Analysis, Insights and Forecast - by Modality Type
- 7.1.1. Uni-Modal
- 7.1.2. Multi-Modal
- 7.2. Market Analysis, Insights and Forecast - by Type
- 7.2.1. Voice Assisted
- 7.2.2. Text Assisted
- 7.2.3. Other Types
- 7.3. Market Analysis, Insights and Forecast - by Deployment
- 7.3.1. On-Premise
- 7.3.2. Cloud
- 7.4. Market Analysis, Insights and Forecast - by Enterprise Size
- 7.4.1. Small & Medium Enterprises
- 7.4.2. Large Enterprises
- 7.5. Market Analysis, Insights and Forecast - by End-user Verticals
- 7.5.1. IT & Telecommunication
- 7.5.2. BFSI
- 7.5.3. Government
- 7.5.4. Retail
- 7.5.5. Energy & Power
- 7.5.6. Other En
- 7.1. Market Analysis, Insights and Forecast - by Modality Type
- 8. Asia Conversational Systems Industry Analysis, Insights and Forecast, 2019-2031
- 8.1. Market Analysis, Insights and Forecast - by Modality Type
- 8.1.1. Uni-Modal
- 8.1.2. Multi-Modal
- 8.2. Market Analysis, Insights and Forecast - by Type
- 8.2.1. Voice Assisted
- 8.2.2. Text Assisted
- 8.2.3. Other Types
- 8.3. Market Analysis, Insights and Forecast - by Deployment
- 8.3.1. On-Premise
- 8.3.2. Cloud
- 8.4. Market Analysis, Insights and Forecast - by Enterprise Size
- 8.4.1. Small & Medium Enterprises
- 8.4.2. Large Enterprises
- 8.5. Market Analysis, Insights and Forecast - by End-user Verticals
- 8.5.1. IT & Telecommunication
- 8.5.2. BFSI
- 8.5.3. Government
- 8.5.4. Retail
- 8.5.5. Energy & Power
- 8.5.6. Other En
- 8.1. Market Analysis, Insights and Forecast - by Modality Type
- 9. Australia and New Zealand Conversational Systems Industry Analysis, Insights and Forecast, 2019-2031
- 9.1. Market Analysis, Insights and Forecast - by Modality Type
- 9.1.1. Uni-Modal
- 9.1.2. Multi-Modal
- 9.2. Market Analysis, Insights and Forecast - by Type
- 9.2.1. Voice Assisted
- 9.2.2. Text Assisted
- 9.2.3. Other Types
- 9.3. Market Analysis, Insights and Forecast - by Deployment
- 9.3.1. On-Premise
- 9.3.2. Cloud
- 9.4. Market Analysis, Insights and Forecast - by Enterprise Size
- 9.4.1. Small & Medium Enterprises
- 9.4.2. Large Enterprises
- 9.5. Market Analysis, Insights and Forecast - by End-user Verticals
- 9.5.1. IT & Telecommunication
- 9.5.2. BFSI
- 9.5.3. Government
- 9.5.4. Retail
- 9.5.5. Energy & Power
- 9.5.6. Other En
- 9.1. Market Analysis, Insights and Forecast - by Modality Type
- 10. Latin America Conversational Systems Industry Analysis, Insights and Forecast, 2019-2031
- 10.1. Market Analysis, Insights and Forecast - by Modality Type
- 10.1.1. Uni-Modal
- 10.1.2. Multi-Modal
- 10.2. Market Analysis, Insights and Forecast - by Type
- 10.2.1. Voice Assisted
- 10.2.2. Text Assisted
- 10.2.3. Other Types
- 10.3. Market Analysis, Insights and Forecast - by Deployment
- 10.3.1. On-Premise
- 10.3.2. Cloud
- 10.4. Market Analysis, Insights and Forecast - by Enterprise Size
- 10.4.1. Small & Medium Enterprises
- 10.4.2. Large Enterprises
- 10.5. Market Analysis, Insights and Forecast - by End-user Verticals
- 10.5.1. IT & Telecommunication
- 10.5.2. BFSI
- 10.5.3. Government
- 10.5.4. Retail
- 10.5.5. Energy & Power
- 10.5.6. Other En
- 10.1. Market Analysis, Insights and Forecast - by Modality Type
- 11. Middle East and Africa Conversational Systems Industry Analysis, Insights and Forecast, 2019-2031
- 11.1. Market Analysis, Insights and Forecast - by Modality Type
- 11.1.1. Uni-Modal
- 11.1.2. Multi-Modal
- 11.2. Market Analysis, Insights and Forecast - by Type
- 11.2.1. Voice Assisted
- 11.2.2. Text Assisted
- 11.2.3. Other Types
- 11.3. Market Analysis, Insights and Forecast - by Deployment
- 11.3.1. On-Premise
- 11.3.2. Cloud
- 11.4. Market Analysis, Insights and Forecast - by Enterprise Size
- 11.4.1. Small & Medium Enterprises
- 11.4.2. Large Enterprises
- 11.5. Market Analysis, Insights and Forecast - by End-user Verticals
- 11.5.1. IT & Telecommunication
- 11.5.2. BFSI
- 11.5.3. Government
- 11.5.4. Retail
- 11.5.5. Energy & Power
- 11.5.6. Other En
- 11.1. Market Analysis, Insights and Forecast - by Modality Type
- 12. North America Conversational Systems Industry Analysis, Insights and Forecast, 2019-2031
- 12.1. Market Analysis, Insights and Forecast - By Country/Sub-region
- 12.1.1 United States
- 12.1.2 Canada
- 12.1.3 Mexico
- 13. Europe Conversational Systems Industry Analysis, Insights and Forecast, 2019-2031
- 13.1. Market Analysis, Insights and Forecast - By Country/Sub-region
- 13.1.1 Germany
- 13.1.2 United Kingdom
- 13.1.3 France
- 13.1.4 Spain
- 13.1.5 Italy
- 13.1.6 Spain
- 13.1.7 Belgium
- 13.1.8 Netherland
- 13.1.9 Nordics
- 13.1.10 Rest of Europe
- 14. Asia Pacific Conversational Systems Industry Analysis, Insights and Forecast, 2019-2031
- 14.1. Market Analysis, Insights and Forecast - By Country/Sub-region
- 14.1.1 China
- 14.1.2 Japan
- 14.1.3 India
- 14.1.4 South Korea
- 14.1.5 Southeast Asia
- 14.1.6 Australia
- 14.1.7 Indonesia
- 14.1.8 Phillipes
- 14.1.9 Singapore
- 14.1.10 Thailandc
- 14.1.11 Rest of Asia Pacific
- 15. South America Conversational Systems Industry Analysis, Insights and Forecast, 2019-2031
- 15.1. Market Analysis, Insights and Forecast - By Country/Sub-region
- 15.1.1 Brazil
- 15.1.2 Argentina
- 15.1.3 Peru
- 15.1.4 Chile
- 15.1.5 Colombia
- 15.1.6 Ecuador
- 15.1.7 Venezuela
- 15.1.8 Rest of South America
- 16. North America Conversational Systems Industry Analysis, Insights and Forecast, 2019-2031
- 16.1. Market Analysis, Insights and Forecast - By Country/Sub-region
- 16.1.1 United States
- 16.1.2 Canada
- 16.1.3 Mexico
- 17. MEA Conversational Systems Industry Analysis, Insights and Forecast, 2019-2031
- 17.1. Market Analysis, Insights and Forecast - By Country/Sub-region
- 17.1.1 United Arab Emirates
- 17.1.2 Saudi Arabia
- 17.1.3 South Africa
- 17.1.4 Rest of Middle East and Africa
- 18. Competitive Analysis
- 18.1. Global Market Share Analysis 2024
- 18.2. Company Profiles
- 18.2.1 Nuance Communications Inc
- 18.2.1.1. Overview
- 18.2.1.2. Products
- 18.2.1.3. SWOT Analysis
- 18.2.1.4. Recent Developments
- 18.2.1.5. Financials (Based on Availability)
- 18.2.2 Inbenta Technologies Inc
- 18.2.2.1. Overview
- 18.2.2.2. Products
- 18.2.2.3. SWOT Analysis
- 18.2.2.4. Recent Developments
- 18.2.2.5. Financials (Based on Availability)
- 18.2.3 Boost ai
- 18.2.3.1. Overview
- 18.2.3.2. Products
- 18.2.3.3. SWOT Analysis
- 18.2.3.4. Recent Developments
- 18.2.3.5. Financials (Based on Availability)
- 18.2.4 IBM Corporation
- 18.2.4.1. Overview
- 18.2.4.2. Products
- 18.2.4.3. SWOT Analysis
- 18.2.4.4. Recent Developments
- 18.2.4.5. Financials (Based on Availability)
- 18.2.5 Drift com Inc
- 18.2.5.1. Overview
- 18.2.5.2. Products
- 18.2.5.3. SWOT Analysis
- 18.2.5.4. Recent Developments
- 18.2.5.5. Financials (Based on Availability)
- 18.2.6 Google LLC (Alphabet Inc )
- 18.2.6.1. Overview
- 18.2.6.2. Products
- 18.2.6.3. SWOT Analysis
- 18.2.6.4. Recent Developments
- 18.2.6.5. Financials (Based on Availability)
- 18.2.7 Microsoft Corporation
- 18.2.7.1. Overview
- 18.2.7.2. Products
- 18.2.7.3. SWOT Analysis
- 18.2.7.4. Recent Developments
- 18.2.7.5. Financials (Based on Availability)
- 18.2.8 Amazon Web Services Inc
- 18.2.8.1. Overview
- 18.2.8.2. Products
- 18.2.8.3. SWOT Analysis
- 18.2.8.4. Recent Developments
- 18.2.8.5. Financials (Based on Availability)
- 18.2.9 Oracle Corporation
- 18.2.9.1. Overview
- 18.2.9.2. Products
- 18.2.9.3. SWOT Analysis
- 18.2.9.4. Recent Developments
- 18.2.9.5. Financials (Based on Availability)
- 18.2.10 SAP SE
- 18.2.10.1. Overview
- 18.2.10.2. Products
- 18.2.10.3. SWOT Analysis
- 18.2.10.4. Recent Developments
- 18.2.10.5. Financials (Based on Availability)
- 18.2.1 Nuance Communications Inc
List of Figures
- Figure 1: Global Conversational Systems Industry Revenue Breakdown (Million, %) by Region 2024 & 2032
- Figure 2: North America Conversational Systems Industry Revenue (Million), by Country 2024 & 2032
- Figure 3: North America Conversational Systems Industry Revenue Share (%), by Country 2024 & 2032
- Figure 4: Europe Conversational Systems Industry Revenue (Million), by Country 2024 & 2032
- Figure 5: Europe Conversational Systems Industry Revenue Share (%), by Country 2024 & 2032
- Figure 6: Asia Pacific Conversational Systems Industry Revenue (Million), by Country 2024 & 2032
- Figure 7: Asia Pacific Conversational Systems Industry Revenue Share (%), by Country 2024 & 2032
- Figure 8: South America Conversational Systems Industry Revenue (Million), by Country 2024 & 2032
- Figure 9: South America Conversational Systems Industry Revenue Share (%), by Country 2024 & 2032
- Figure 10: North America Conversational Systems Industry Revenue (Million), by Country 2024 & 2032
- Figure 11: North America Conversational Systems Industry Revenue Share (%), by Country 2024 & 2032
- Figure 12: MEA Conversational Systems Industry Revenue (Million), by Country 2024 & 2032
- Figure 13: MEA Conversational Systems Industry Revenue Share (%), by Country 2024 & 2032
- Figure 14: North America Conversational Systems Industry Revenue (Million), by Modality Type 2024 & 2032
- Figure 15: North America Conversational Systems Industry Revenue Share (%), by Modality Type 2024 & 2032
- Figure 16: North America Conversational Systems Industry Revenue (Million), by Type 2024 & 2032
- Figure 17: North America Conversational Systems Industry Revenue Share (%), by Type 2024 & 2032
- Figure 18: North America Conversational Systems Industry Revenue (Million), by Deployment 2024 & 2032
- Figure 19: North America Conversational Systems Industry Revenue Share (%), by Deployment 2024 & 2032
- Figure 20: North America Conversational Systems Industry Revenue (Million), by Enterprise Size 2024 & 2032
- Figure 21: North America Conversational Systems Industry Revenue Share (%), by Enterprise Size 2024 & 2032
- Figure 22: North America Conversational Systems Industry Revenue (Million), by End-user Verticals 2024 & 2032
- Figure 23: North America Conversational Systems Industry Revenue Share (%), by End-user Verticals 2024 & 2032
- Figure 24: North America Conversational Systems Industry Revenue (Million), by Country 2024 & 2032
- Figure 25: North America Conversational Systems Industry Revenue Share (%), by Country 2024 & 2032
- Figure 26: Europe Conversational Systems Industry Revenue (Million), by Modality Type 2024 & 2032
- Figure 27: Europe Conversational Systems Industry Revenue Share (%), by Modality Type 2024 & 2032
- Figure 28: Europe Conversational Systems Industry Revenue (Million), by Type 2024 & 2032
- Figure 29: Europe Conversational Systems Industry Revenue Share (%), by Type 2024 & 2032
- Figure 30: Europe Conversational Systems Industry Revenue (Million), by Deployment 2024 & 2032
- Figure 31: Europe Conversational Systems Industry Revenue Share (%), by Deployment 2024 & 2032
- Figure 32: Europe Conversational Systems Industry Revenue (Million), by Enterprise Size 2024 & 2032
- Figure 33: Europe Conversational Systems Industry Revenue Share (%), by Enterprise Size 2024 & 2032
- Figure 34: Europe Conversational Systems Industry Revenue (Million), by End-user Verticals 2024 & 2032
- Figure 35: Europe Conversational Systems Industry Revenue Share (%), by End-user Verticals 2024 & 2032
- Figure 36: Europe Conversational Systems Industry Revenue (Million), by Country 2024 & 2032
- Figure 37: Europe Conversational Systems Industry Revenue Share (%), by Country 2024 & 2032
- Figure 38: Asia Conversational Systems Industry Revenue (Million), by Modality Type 2024 & 2032
- Figure 39: Asia Conversational Systems Industry Revenue Share (%), by Modality Type 2024 & 2032
- Figure 40: Asia Conversational Systems Industry Revenue (Million), by Type 2024 & 2032
- Figure 41: Asia Conversational Systems Industry Revenue Share (%), by Type 2024 & 2032
- Figure 42: Asia Conversational Systems Industry Revenue (Million), by Deployment 2024 & 2032
- Figure 43: Asia Conversational Systems Industry Revenue Share (%), by Deployment 2024 & 2032
- Figure 44: Asia Conversational Systems Industry Revenue (Million), by Enterprise Size 2024 & 2032
- Figure 45: Asia Conversational Systems Industry Revenue Share (%), by Enterprise Size 2024 & 2032
- Figure 46: Asia Conversational Systems Industry Revenue (Million), by End-user Verticals 2024 & 2032
- Figure 47: Asia Conversational Systems Industry Revenue Share (%), by End-user Verticals 2024 & 2032
- Figure 48: Asia Conversational Systems Industry Revenue (Million), by Country 2024 & 2032
- Figure 49: Asia Conversational Systems Industry Revenue Share (%), by Country 2024 & 2032
- Figure 50: Australia and New Zealand Conversational Systems Industry Revenue (Million), by Modality Type 2024 & 2032
- Figure 51: Australia and New Zealand Conversational Systems Industry Revenue Share (%), by Modality Type 2024 & 2032
- Figure 52: Australia and New Zealand Conversational Systems Industry Revenue (Million), by Type 2024 & 2032
- Figure 53: Australia and New Zealand Conversational Systems Industry Revenue Share (%), by Type 2024 & 2032
- Figure 54: Australia and New Zealand Conversational Systems Industry Revenue (Million), by Deployment 2024 & 2032
- Figure 55: Australia and New Zealand Conversational Systems Industry Revenue Share (%), by Deployment 2024 & 2032
- Figure 56: Australia and New Zealand Conversational Systems Industry Revenue (Million), by Enterprise Size 2024 & 2032
- Figure 57: Australia and New Zealand Conversational Systems Industry Revenue Share (%), by Enterprise Size 2024 & 2032
- Figure 58: Australia and New Zealand Conversational Systems Industry Revenue (Million), by End-user Verticals 2024 & 2032
- Figure 59: Australia and New Zealand Conversational Systems Industry Revenue Share (%), by End-user Verticals 2024 & 2032
- Figure 60: Australia and New Zealand Conversational Systems Industry Revenue (Million), by Country 2024 & 2032
- Figure 61: Australia and New Zealand Conversational Systems Industry Revenue Share (%), by Country 2024 & 2032
- Figure 62: Latin America Conversational Systems Industry Revenue (Million), by Modality Type 2024 & 2032
- Figure 63: Latin America Conversational Systems Industry Revenue Share (%), by Modality Type 2024 & 2032
- Figure 64: Latin America Conversational Systems Industry Revenue (Million), by Type 2024 & 2032
- Figure 65: Latin America Conversational Systems Industry Revenue Share (%), by Type 2024 & 2032
- Figure 66: Latin America Conversational Systems Industry Revenue (Million), by Deployment 2024 & 2032
- Figure 67: Latin America Conversational Systems Industry Revenue Share (%), by Deployment 2024 & 2032
- Figure 68: Latin America Conversational Systems Industry Revenue (Million), by Enterprise Size 2024 & 2032
- Figure 69: Latin America Conversational Systems Industry Revenue Share (%), by Enterprise Size 2024 & 2032
- Figure 70: Latin America Conversational Systems Industry Revenue (Million), by End-user Verticals 2024 & 2032
- Figure 71: Latin America Conversational Systems Industry Revenue Share (%), by End-user Verticals 2024 & 2032
- Figure 72: Latin America Conversational Systems Industry Revenue (Million), by Country 2024 & 2032
- Figure 73: Latin America Conversational Systems Industry Revenue Share (%), by Country 2024 & 2032
- Figure 74: Middle East and Africa Conversational Systems Industry Revenue (Million), by Modality Type 2024 & 2032
- Figure 75: Middle East and Africa Conversational Systems Industry Revenue Share (%), by Modality Type 2024 & 2032
- Figure 76: Middle East and Africa Conversational Systems Industry Revenue (Million), by Type 2024 & 2032
- Figure 77: Middle East and Africa Conversational Systems Industry Revenue Share (%), by Type 2024 & 2032
- Figure 78: Middle East and Africa Conversational Systems Industry Revenue (Million), by Deployment 2024 & 2032
- Figure 79: Middle East and Africa Conversational Systems Industry Revenue Share (%), by Deployment 2024 & 2032
- Figure 80: Middle East and Africa Conversational Systems Industry Revenue (Million), by Enterprise Size 2024 & 2032
- Figure 81: Middle East and Africa Conversational Systems Industry Revenue Share (%), by Enterprise Size 2024 & 2032
- Figure 82: Middle East and Africa Conversational Systems Industry Revenue (Million), by End-user Verticals 2024 & 2032
- Figure 83: Middle East and Africa Conversational Systems Industry Revenue Share (%), by End-user Verticals 2024 & 2032
- Figure 84: Middle East and Africa Conversational Systems Industry Revenue (Million), by Country 2024 & 2032
- Figure 85: Middle East and Africa Conversational Systems Industry Revenue Share (%), by Country 2024 & 2032
List of Tables
- Table 1: Global Conversational Systems Industry Revenue Million Forecast, by Region 2019 & 2032
- Table 2: Global Conversational Systems Industry Revenue Million Forecast, by Modality Type 2019 & 2032
- Table 3: Global Conversational Systems Industry Revenue Million Forecast, by Type 2019 & 2032
- Table 4: Global Conversational Systems Industry Revenue Million Forecast, by Deployment 2019 & 2032
- Table 5: Global Conversational Systems Industry Revenue Million Forecast, by Enterprise Size 2019 & 2032
- Table 6: Global Conversational Systems Industry Revenue Million Forecast, by End-user Verticals 2019 & 2032
- Table 7: Global Conversational Systems Industry Revenue Million Forecast, by Region 2019 & 2032
- Table 8: Global Conversational Systems Industry Revenue Million Forecast, by Country 2019 & 2032
- Table 9: United States Conversational Systems Industry Revenue (Million) Forecast, by Application 2019 & 2032
- Table 10: Canada Conversational Systems Industry Revenue (Million) Forecast, by Application 2019 & 2032
- Table 11: Mexico Conversational Systems Industry Revenue (Million) Forecast, by Application 2019 & 2032
- Table 12: Global Conversational Systems Industry Revenue Million Forecast, by Country 2019 & 2032
- Table 13: Germany Conversational Systems Industry Revenue (Million) Forecast, by Application 2019 & 2032
- Table 14: United Kingdom Conversational Systems Industry Revenue (Million) Forecast, by Application 2019 & 2032
- Table 15: France Conversational Systems Industry Revenue (Million) Forecast, by Application 2019 & 2032
- Table 16: Spain Conversational Systems Industry Revenue (Million) Forecast, by Application 2019 & 2032
- Table 17: Italy Conversational Systems Industry Revenue (Million) Forecast, by Application 2019 & 2032
- Table 18: Spain Conversational Systems Industry Revenue (Million) Forecast, by Application 2019 & 2032
- Table 19: Belgium Conversational Systems Industry Revenue (Million) Forecast, by Application 2019 & 2032
- Table 20: Netherland Conversational Systems Industry Revenue (Million) Forecast, by Application 2019 & 2032
- Table 21: Nordics Conversational Systems Industry Revenue (Million) Forecast, by Application 2019 & 2032
- Table 22: Rest of Europe Conversational Systems Industry Revenue (Million) Forecast, by Application 2019 & 2032
- Table 23: Global Conversational Systems Industry Revenue Million Forecast, by Country 2019 & 2032
- Table 24: China Conversational Systems Industry Revenue (Million) Forecast, by Application 2019 & 2032
- Table 25: Japan Conversational Systems Industry Revenue (Million) Forecast, by Application 2019 & 2032
- Table 26: India Conversational Systems Industry Revenue (Million) Forecast, by Application 2019 & 2032
- Table 27: South Korea Conversational Systems Industry Revenue (Million) Forecast, by Application 2019 & 2032
- Table 28: Southeast Asia Conversational Systems Industry Revenue (Million) Forecast, by Application 2019 & 2032
- Table 29: Australia Conversational Systems Industry Revenue (Million) Forecast, by Application 2019 & 2032
- Table 30: Indonesia Conversational Systems Industry Revenue (Million) Forecast, by Application 2019 & 2032
- Table 31: Phillipes Conversational Systems Industry Revenue (Million) Forecast, by Application 2019 & 2032
- Table 32: Singapore Conversational Systems Industry Revenue (Million) Forecast, by Application 2019 & 2032
- Table 33: Thailandc Conversational Systems Industry Revenue (Million) Forecast, by Application 2019 & 2032
- Table 34: Rest of Asia Pacific Conversational Systems Industry Revenue (Million) Forecast, by Application 2019 & 2032
- Table 35: Global Conversational Systems Industry Revenue Million Forecast, by Country 2019 & 2032
- Table 36: Brazil Conversational Systems Industry Revenue (Million) Forecast, by Application 2019 & 2032
- Table 37: Argentina Conversational Systems Industry Revenue (Million) Forecast, by Application 2019 & 2032
- Table 38: Peru Conversational Systems Industry Revenue (Million) Forecast, by Application 2019 & 2032
- Table 39: Chile Conversational Systems Industry Revenue (Million) Forecast, by Application 2019 & 2032
- Table 40: Colombia Conversational Systems Industry Revenue (Million) Forecast, by Application 2019 & 2032
- Table 41: Ecuador Conversational Systems Industry Revenue (Million) Forecast, by Application 2019 & 2032
- Table 42: Venezuela Conversational Systems Industry Revenue (Million) Forecast, by Application 2019 & 2032
- Table 43: Rest of South America Conversational Systems Industry Revenue (Million) Forecast, by Application 2019 & 2032
- Table 44: Global Conversational Systems Industry Revenue Million Forecast, by Country 2019 & 2032
- Table 45: United States Conversational Systems Industry Revenue (Million) Forecast, by Application 2019 & 2032
- Table 46: Canada Conversational Systems Industry Revenue (Million) Forecast, by Application 2019 & 2032
- Table 47: Mexico Conversational Systems Industry Revenue (Million) Forecast, by Application 2019 & 2032
- Table 48: Global Conversational Systems Industry Revenue Million Forecast, by Country 2019 & 2032
- Table 49: United Arab Emirates Conversational Systems Industry Revenue (Million) Forecast, by Application 2019 & 2032
- Table 50: Saudi Arabia Conversational Systems Industry Revenue (Million) Forecast, by Application 2019 & 2032
- Table 51: South Africa Conversational Systems Industry Revenue (Million) Forecast, by Application 2019 & 2032
- Table 52: Rest of Middle East and Africa Conversational Systems Industry Revenue (Million) Forecast, by Application 2019 & 2032
- Table 53: Global Conversational Systems Industry Revenue Million Forecast, by Modality Type 2019 & 2032
- Table 54: Global Conversational Systems Industry Revenue Million Forecast, by Type 2019 & 2032
- Table 55: Global Conversational Systems Industry Revenue Million Forecast, by Deployment 2019 & 2032
- Table 56: Global Conversational Systems Industry Revenue Million Forecast, by Enterprise Size 2019 & 2032
- Table 57: Global Conversational Systems Industry Revenue Million Forecast, by End-user Verticals 2019 & 2032
- Table 58: Global Conversational Systems Industry Revenue Million Forecast, by Country 2019 & 2032
- Table 59: Global Conversational Systems Industry Revenue Million Forecast, by Modality Type 2019 & 2032
- Table 60: Global Conversational Systems Industry Revenue Million Forecast, by Type 2019 & 2032
- Table 61: Global Conversational Systems Industry Revenue Million Forecast, by Deployment 2019 & 2032
- Table 62: Global Conversational Systems Industry Revenue Million Forecast, by Enterprise Size 2019 & 2032
- Table 63: Global Conversational Systems Industry Revenue Million Forecast, by End-user Verticals 2019 & 2032
- Table 64: Global Conversational Systems Industry Revenue Million Forecast, by Country 2019 & 2032
- Table 65: Global Conversational Systems Industry Revenue Million Forecast, by Modality Type 2019 & 2032
- Table 66: Global Conversational Systems Industry Revenue Million Forecast, by Type 2019 & 2032
- Table 67: Global Conversational Systems Industry Revenue Million Forecast, by Deployment 2019 & 2032
- Table 68: Global Conversational Systems Industry Revenue Million Forecast, by Enterprise Size 2019 & 2032
- Table 69: Global Conversational Systems Industry Revenue Million Forecast, by End-user Verticals 2019 & 2032
- Table 70: Global Conversational Systems Industry Revenue Million Forecast, by Country 2019 & 2032
- Table 71: Global Conversational Systems Industry Revenue Million Forecast, by Modality Type 2019 & 2032
- Table 72: Global Conversational Systems Industry Revenue Million Forecast, by Type 2019 & 2032
- Table 73: Global Conversational Systems Industry Revenue Million Forecast, by Deployment 2019 & 2032
- Table 74: Global Conversational Systems Industry Revenue Million Forecast, by Enterprise Size 2019 & 2032
- Table 75: Global Conversational Systems Industry Revenue Million Forecast, by End-user Verticals 2019 & 2032
- Table 76: Global Conversational Systems Industry Revenue Million Forecast, by Country 2019 & 2032
- Table 77: Global Conversational Systems Industry Revenue Million Forecast, by Modality Type 2019 & 2032
- Table 78: Global Conversational Systems Industry Revenue Million Forecast, by Type 2019 & 2032
- Table 79: Global Conversational Systems Industry Revenue Million Forecast, by Deployment 2019 & 2032
- Table 80: Global Conversational Systems Industry Revenue Million Forecast, by Enterprise Size 2019 & 2032
- Table 81: Global Conversational Systems Industry Revenue Million Forecast, by End-user Verticals 2019 & 2032
- Table 82: Global Conversational Systems Industry Revenue Million Forecast, by Country 2019 & 2032
- Table 83: Global Conversational Systems Industry Revenue Million Forecast, by Modality Type 2019 & 2032
- Table 84: Global Conversational Systems Industry Revenue Million Forecast, by Type 2019 & 2032
- Table 85: Global Conversational Systems Industry Revenue Million Forecast, by Deployment 2019 & 2032
- Table 86: Global Conversational Systems Industry Revenue Million Forecast, by Enterprise Size 2019 & 2032
- Table 87: Global Conversational Systems Industry Revenue Million Forecast, by End-user Verticals 2019 & 2032
- Table 88: Global Conversational Systems Industry Revenue Million Forecast, by Country 2019 & 2032
Frequently Asked Questions
1. What is the projected Compound Annual Growth Rate (CAGR) of the Conversational Systems Industry?
The projected CAGR is approximately 21.06%.
2. Which companies are prominent players in the Conversational Systems Industry?
Key companies in the market include Nuance Communications Inc, Inbenta Technologies Inc, Boost ai, IBM Corporation, Drift com Inc, Google LLC (Alphabet Inc ), Microsoft Corporation, Amazon Web Services Inc, Oracle Corporation, SAP SE.
3. What are the main segments of the Conversational Systems Industry?
The market segments include Modality Type, Type, Deployment, Enterprise Size, End-user Verticals.
4. Can you provide details about the market size?
The market size is estimated to be USD 53.13 Million as of 2022.
5. What are some drivers contributing to market growth?
Rising Usage of AI-based Solutions for Customer Services.
6. What are the notable trends driving market growth?
Rising Usage of AI-based Solutions for Customer Services Drives the Market Growth.
7. Are there any restraints impacting market growth?
Lack of Cybersecurity Professionals; High Reliance on Traditional Authentication Methods and Low Preparedness.
8. Can you provide examples of recent developments in the market?
March 2023: Google LLC (Alphabet Inc.) has announced Plans to integrate artificial intelligence into health related initiatives, including an update on the use of language generation technology in medical examinations and AI assisted research, ways to help consumers find information more quickly through Internet searching and tools to help developers build healthcare apps throughout the world.
9. What pricing options are available for accessing the report?
Pricing options include single-user, multi-user, and enterprise licenses priced at USD 4750, USD 5250, and USD 8750 respectively.
10. Is the market size provided in terms of value or volume?
The market size is provided in terms of value, measured in Million.
11. Are there any specific market keywords associated with the report?
Yes, the market keyword associated with the report is "Conversational Systems Industry," which aids in identifying and referencing the specific market segment covered.
12. How do I determine which pricing option suits my needs best?
The pricing options vary based on user requirements and access needs. Individual users may opt for single-user licenses, while businesses requiring broader access may choose multi-user or enterprise licenses for cost-effective access to the report.
13. Are there any additional resources or data provided in the Conversational Systems Industry report?
While the report offers comprehensive insights, it's advisable to review the specific contents or supplementary materials provided to ascertain if additional resources or data are available.
14. How can I stay updated on further developments or reports in the Conversational Systems Industry?
To stay informed about further developments, trends, and reports in the Conversational Systems Industry, consider subscribing to industry newsletters, following relevant companies and organizations, or regularly checking reputable industry news sources and publications.
Methodology
Step 1 - Identification of Relevant Samples Size from Population Database


Step 2 - Approaches for Defining Global Market Size (Value, Volume* & Price*)

Note*: In applicable scenarios
Step 3 - Data Sources
Primary Research
- Web Analytics
- Survey Reports
- Research Institute
- Latest Research Reports
- Opinion Leaders
Secondary Research
- Annual Reports
- White Paper
- Latest Press Release
- Industry Association
- Paid Database
- Investor Presentations

Step 4 - Data Triangulation
Involves using different sources of information in order to increase the validity of a study
These sources are likely to be stakeholders in a program - participants, other researchers, program staff, other community members, and so on.
Then we put all data in single framework & apply various statistical tools to find out the dynamic on the market.
During the analysis stage, feedback from the stakeholder groups would be compared to determine areas of agreement as well as areas of divergence
