

Key Insights
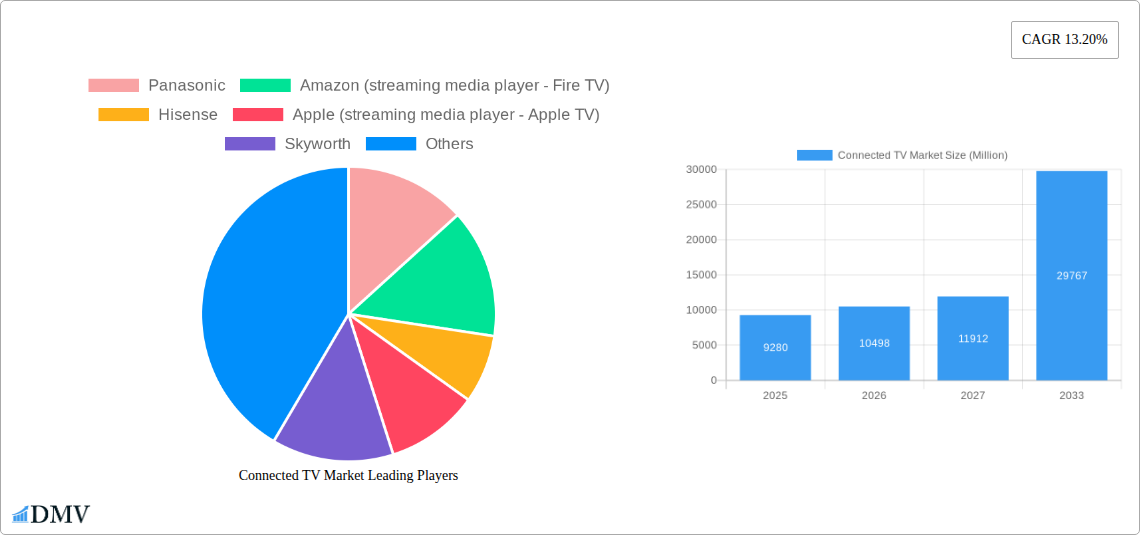
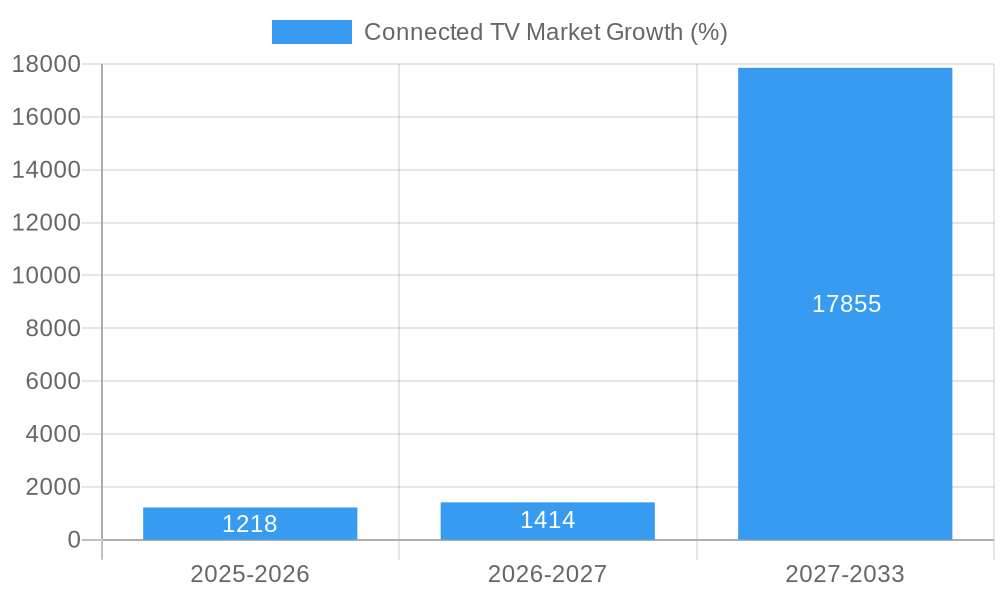
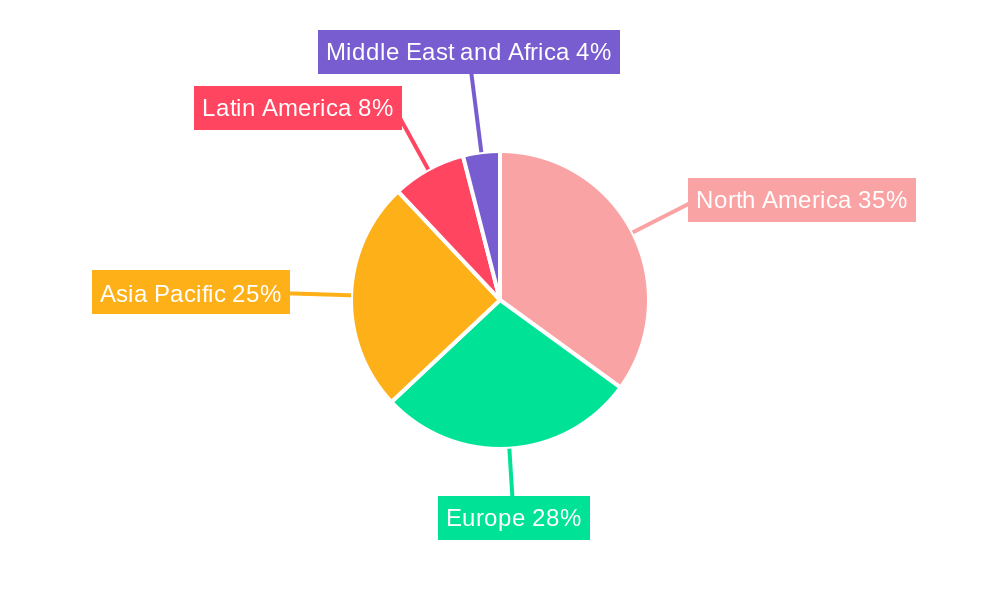
The Connected TV (CTV) market is experiencing robust growth, projected to reach a substantial size by 2033. The market's 2025 value of $9.28 billion, coupled with a Compound Annual Growth Rate (CAGR) of 13.20%, indicates a significant upward trajectory. This expansion is fueled by several key factors. The increasing adoption of streaming services and the rise of over-the-top (OTT) platforms are driving demand for smart TVs and streaming media players. Technological advancements, particularly in display resolution (4K, 8K), enhance user experience and further stimulate market growth. Consumers are increasingly shifting from traditional cable television to the convenience and flexibility offered by CTV platforms, boosting the adoption of smart TVs and streaming devices from manufacturers such as Samsung, LG, Roku, Amazon (Fire TV), and Google (Chromecast). The geographic distribution of this growth is expected to be diverse, with significant contributions from North America and Asia Pacific regions, driven by high internet penetration and rising disposable incomes. However, challenges such as varying internet infrastructure across regions and potential cybersecurity concerns related to streaming devices could pose some restraints to the market's growth.
The competitive landscape is characterized by a mix of established electronics manufacturers like Samsung and LG, and tech giants like Amazon and Google who are actively vying for market share with their own streaming platforms. This competition fosters innovation, resulting in improved features and more affordable prices, benefiting consumers. Future growth will likely depend on continued technological advancements, expansion into emerging markets, the development of more sophisticated content delivery platforms and effective address of consumer concerns around data privacy and security. The increasing integration of CTV with other smart home devices and the development of more personalized and targeted advertising strategies are also poised to further shape the market's evolution.
Connected TV Market: A Comprehensive Report (2019-2033)
This insightful report provides a deep dive into the dynamic Connected TV market, offering a comprehensive analysis of market trends, leading players, and future growth prospects. With a study period spanning 2019-2033, a base year of 2025, and a forecast period of 2025-2033, this report is an indispensable resource for stakeholders seeking to understand and capitalize on the opportunities within this rapidly evolving sector. The report incorporates data from the historical period of 2019-2024 and offers valuable insights into the market's current state and future trajectory. Key segments analyzed include Smart TVs and Streaming Media Players, with a particular focus on the evolution of Smart TV resolutions (4K, Ultra HD, 8K). We analyze the market in Million units throughout.
Connected TV Market Composition & Trends
This section evaluates the Connected TV market's competitive landscape, highlighting key trends shaping its evolution. We analyze market concentration, identifying the dominant players and their respective market shares. Innovation catalysts, such as advancements in display technology and streaming capabilities, are examined, alongside the regulatory environment and its impact on market dynamics. Substitute products and their competitive threat are assessed. Finally, we analyze end-user profiles and their evolving viewing habits, and delve into M&A activities within the sector, including deal values and their implications for market consolidation.
- Market Share Distribution: Samsung, LG, and TCL are projected to hold a combined market share of approximately xx% in 2025, with other significant players including Sony, Hisense, and Xiaomi.
- M&A Activity: The total value of M&A deals in the Connected TV sector between 2020 and 2024 is estimated at $xx Million, reflecting a growing trend of consolidation within the industry.
Connected TV Market Industry Evolution
This section delves into the historical and projected growth trajectories of the Connected TV market, exploring the key technological advancements and shifts in consumer demand that are driving its expansion. We analyze the factors contributing to market growth, including increasing internet penetration, the rising adoption of streaming services, and the development of more sophisticated Smart TV features. Detailed data points, such as compound annual growth rates (CAGR) and market penetration rates for various technologies, will be provided. The impact of emerging technologies like 8K resolution and HDR on market growth will be meticulously explored. The shift from traditional television viewing to streaming platforms is also thoroughly examined.
Leading Regions, Countries, or Segments in Connected TV Market
This section identifies the leading regions, countries, and segments within the Connected TV market. The analysis focuses on Smart TV penetration and the prevalence of specific resolutions (4K, Ultra HD, 8K) and Streaming Media Players.
- Key Drivers (Smart TVs):
- Increasing disposable incomes and rising consumer spending on electronics.
- Government initiatives promoting digitalization and broadband infrastructure development.
- The proliferation of affordable and high-quality Smart TVs.
- Key Drivers (Streaming Media Players):
- Growing popularity of streaming services (Netflix, Amazon Prime, Disney+, etc.).
- Ease of use and affordability of Streaming Media Players compared to Smart TVs.
- Support for 4K and HDR content across leading platforms.
- Market Overview and Estimates for Streaming Media Players (Million Units):
- 2020: xx Million
- 2021: xx Million
- 2022: xx Million
- 2023: xx Million
- 2024: xx Million
- 2025: xx Million
- 2026: xx Million
- 2027: xx Million
The dominance of specific regions and countries is analyzed, considering factors like market size, consumer preferences, and regulatory policies. North America and Asia are projected to continue as leading markets, however, emerging markets in the MEA region are predicted to show significant potential.
Connected TV Market Product Innovations
This section details recent product innovations, highlighting unique selling propositions (USPs) and technological advancements that are shaping the Connected TV landscape. The report will showcase cutting-edge features, improved user interfaces, and enhanced streaming capabilities driving market growth. For example, the rise of AI-powered features in Smart TVs to provide personalized content recommendations and improved voice control will be examined.
Propelling Factors for Connected TV Market Growth
Several factors are driving the growth of the Connected TV market, including technological advancements, increased affordability of devices, and growing demand for high-quality content. The proliferation of affordable high-speed internet access is key for both streaming and Smart TV adoption. Furthermore, supportive government policies in certain regions are fostering market expansion.
Obstacles in the Connected TV Market Market
The Connected TV market faces certain challenges, including supply chain disruptions, which can impact device availability and pricing. Intense competition among manufacturers for market share also creates price pressures and necessitates continuous innovation to stay ahead. Regulatory hurdles, particularly concerning data privacy and cybersecurity, pose significant challenges. Furthermore, the reliance on stable internet infrastructure can hinder market expansion in certain regions.
Future Opportunities in Connected TV Market
The Connected TV market presents several compelling opportunities for future growth. The increasing penetration of 5G networks promises faster speeds and better streaming experiences. The evolution of 8K resolution displays could drive future upgrades. Further exploration of niche markets and the expansion into developing economies with increasing internet access represent significant growth areas.
Major Players in the Connected TV Market Ecosystem
- Panasonic
- Amazon (streaming media player - Fire TV)
- Hisense
- Apple (streaming media player - Apple TV)
- Skyworth
- Google (Chromecast)
- Sharp Electronics
- Xiaomi Corporation
- TCL
- Haier Group
- Vizio Inc
- Roku (streaming media player - Roku)
- Samsung Corporation
- LG Electronics
- Sony Corporation
Key Developments in Connected TV Market Industry
- May 2023: Blaupunkt and Flipkart partnered to launch the 40-inch Android TV Sigma series, featuring a bezel-less design and enhanced audio-visual capabilities. This partnership expands Blaupunkt's market reach in India.
- May 2023: Hisense launched its ULED X and U8 TV products in the UAE, significantly increasing its brand awareness in the region. This highlights successful product launches in key markets.
- November 2022: Samsung launched the Samsung Crystal 55AU7700 55-inch Ultra HD 4K Smart LED TV in India, expanding its product portfolio in a key growth market. This illustrates the ongoing push for higher resolution Smart TVs.
Strategic Connected TV Market Market Forecast
The Connected TV market is poised for continued expansion, driven by technological innovations, increasing consumer demand for high-quality content, and the growing adoption of streaming services. The market's future is bright, with significant opportunities in emerging markets and the development of new technologies. The ongoing shift from traditional broadcasting to streaming platforms, coupled with the rising adoption of smart home technologies, is expected to fuel substantial growth in the coming years. This growth will present significant opportunities for market participants.
Connected TV Market Segmentation
-
1. Device
-
1.1. Smart TV
- 1.1.1. Smart TV
- 1.1.2. Smart TV
- 1.1.3. Key shif
- 1.2. Streamin
-
1.1. Smart TV
Connected TV Market Segmentation By Geography
-
1. North America
- 1.1. United States
- 1.2. Canada
-
2. Europe
- 2.1. United Kingdom
- 2.2. Germany
- 2.3. France
-
3. Asia
- 3.1. China
- 3.2. India
- 3.3. Japan
- 3.4. Australia and New Zealand
- 4. Latin America
- 5. Middle East and Africa
Connected TV Market REPORT HIGHLIGHTS
| Aspects | Details |
|---|---|
| Study Period | 2019-2033 |
| Base Year | 2024 |
| Estimated Year | 2025 |
| Forecast Period | 2025-2033 |
| Historical Period | 2019-2024 |
| Growth Rate | CAGR of 13.20% from 2019-2033 |
| Segmentation |
|
Table of Contents
- 1. Introduction
- 1.1. Research Scope
- 1.2. Market Segmentation
- 1.3. Research Methodology
- 1.4. Definitions and Assumptions
- 2. Executive Summary
- 2.1. Introduction
- 3. Market Dynamics
- 3.1. Introduction
- 3.2. Market Drivers
- 3.2.1. Growing internet penetration and anticipated shift from conventional TVs; Industry collaborations and favorable market conditions (shift from internet TV to smart TV)
- 3.3. Market Restrains
- 3.3.1. The Need for High Investment in Content Creation and Broadcasting; Bandwidth Allocation for 4K Resolution
- 3.4. Market Trends
- 3.4.1. Smart TV Accounts for the Largest Market Share
- 4. Market Factor Analysis
- 4.1. Porters Five Forces
- 4.2. Supply/Value Chain
- 4.3. PESTEL analysis
- 4.4. Market Entropy
- 4.5. Patent/Trademark Analysis
- 5. Global Connected TV Market Analysis, Insights and Forecast, 2019-2031
- 5.1. Market Analysis, Insights and Forecast - by Device
- 5.1.1. Smart TV
- 5.1.1.1. Smart TV
- 5.1.1.2. Smart TV
- 5.1.1.3. Key shif
- 5.1.2. Streamin
- 5.1.1. Smart TV
- 5.2. Market Analysis, Insights and Forecast - by Region
- 5.2.1. North America
- 5.2.2. Europe
- 5.2.3. Asia
- 5.2.4. Latin America
- 5.2.5. Middle East and Africa
- 5.1. Market Analysis, Insights and Forecast - by Device
- 6. North America Connected TV Market Analysis, Insights and Forecast, 2019-2031
- 6.1. Market Analysis, Insights and Forecast - by Device
- 6.1.1. Smart TV
- 6.1.1.1. Smart TV
- 6.1.1.2. Smart TV
- 6.1.1.3. Key shif
- 6.1.2. Streamin
- 6.1.1. Smart TV
- 6.1. Market Analysis, Insights and Forecast - by Device
- 7. Europe Connected TV Market Analysis, Insights and Forecast, 2019-2031
- 7.1. Market Analysis, Insights and Forecast - by Device
- 7.1.1. Smart TV
- 7.1.1.1. Smart TV
- 7.1.1.2. Smart TV
- 7.1.1.3. Key shif
- 7.1.2. Streamin
- 7.1.1. Smart TV
- 7.1. Market Analysis, Insights and Forecast - by Device
- 8. Asia Connected TV Market Analysis, Insights and Forecast, 2019-2031
- 8.1. Market Analysis, Insights and Forecast - by Device
- 8.1.1. Smart TV
- 8.1.1.1. Smart TV
- 8.1.1.2. Smart TV
- 8.1.1.3. Key shif
- 8.1.2. Streamin
- 8.1.1. Smart TV
- 8.1. Market Analysis, Insights and Forecast - by Device
- 9. Latin America Connected TV Market Analysis, Insights and Forecast, 2019-2031
- 9.1. Market Analysis, Insights and Forecast - by Device
- 9.1.1. Smart TV
- 9.1.1.1. Smart TV
- 9.1.1.2. Smart TV
- 9.1.1.3. Key shif
- 9.1.2. Streamin
- 9.1.1. Smart TV
- 9.1. Market Analysis, Insights and Forecast - by Device
- 10. Middle East and Africa Connected TV Market Analysis, Insights and Forecast, 2019-2031
- 10.1. Market Analysis, Insights and Forecast - by Device
- 10.1.1. Smart TV
- 10.1.1.1. Smart TV
- 10.1.1.2. Smart TV
- 10.1.1.3. Key shif
- 10.1.2. Streamin
- 10.1.1. Smart TV
- 10.1. Market Analysis, Insights and Forecast - by Device
- 11. North America Connected TV Market Analysis, Insights and Forecast, 2019-2031
- 11.1. Market Analysis, Insights and Forecast - By Country/Sub-region
- 11.1.1 United States
- 11.1.2 Canada
- 12. Europe Connected TV Market Analysis, Insights and Forecast, 2019-2031
- 12.1. Market Analysis, Insights and Forecast - By Country/Sub-region
- 12.1.1 United Kingdom
- 12.1.2 Germany
- 12.1.3 France
- 12.1.4 Rest of Europe
- 13. Asia Pacific Connected TV Market Analysis, Insights and Forecast, 2019-2031
- 13.1. Market Analysis, Insights and Forecast - By Country/Sub-region
- 13.1.1 China
- 13.1.2 India
- 13.1.3 Japan
- 13.1.4 Rest of Asia Pacific
- 14. Latin America Connected TV Market Analysis, Insights and Forecast, 2019-2031
- 14.1. Market Analysis, Insights and Forecast - By Country/Sub-region
- 14.1.1.
- 15. Middle East and Africa Connected TV Market Analysis, Insights and Forecast, 2019-2031
- 15.1. Market Analysis, Insights and Forecast - By Country/Sub-region
- 15.1.1.
- 16. Competitive Analysis
- 16.1. Global Market Share Analysis 2024
- 16.2. Company Profiles
- 16.2.1 Panasonic
- 16.2.1.1. Overview
- 16.2.1.2. Products
- 16.2.1.3. SWOT Analysis
- 16.2.1.4. Recent Developments
- 16.2.1.5. Financials (Based on Availability)
- 16.2.2 Amazon (streaming media player - Fire TV)
- 16.2.2.1. Overview
- 16.2.2.2. Products
- 16.2.2.3. SWOT Analysis
- 16.2.2.4. Recent Developments
- 16.2.2.5. Financials (Based on Availability)
- 16.2.3 Hisense
- 16.2.3.1. Overview
- 16.2.3.2. Products
- 16.2.3.3. SWOT Analysis
- 16.2.3.4. Recent Developments
- 16.2.3.5. Financials (Based on Availability)
- 16.2.4 Apple (streaming media player - Apple TV)
- 16.2.4.1. Overview
- 16.2.4.2. Products
- 16.2.4.3. SWOT Analysis
- 16.2.4.4. Recent Developments
- 16.2.4.5. Financials (Based on Availability)
- 16.2.5 Skyworth
- 16.2.5.1. Overview
- 16.2.5.2. Products
- 16.2.5.3. SWOT Analysis
- 16.2.5.4. Recent Developments
- 16.2.5.5. Financials (Based on Availability)
- 16.2.6 Google (Chromecast)*List Not Exhaustive
- 16.2.6.1. Overview
- 16.2.6.2. Products
- 16.2.6.3. SWOT Analysis
- 16.2.6.4. Recent Developments
- 16.2.6.5. Financials (Based on Availability)
- 16.2.7 Sharp Electronics
- 16.2.7.1. Overview
- 16.2.7.2. Products
- 16.2.7.3. SWOT Analysis
- 16.2.7.4. Recent Developments
- 16.2.7.5. Financials (Based on Availability)
- 16.2.8 Xiaomi Corporation
- 16.2.8.1. Overview
- 16.2.8.2. Products
- 16.2.8.3. SWOT Analysis
- 16.2.8.4. Recent Developments
- 16.2.8.5. Financials (Based on Availability)
- 16.2.9 TCL
- 16.2.9.1. Overview
- 16.2.9.2. Products
- 16.2.9.3. SWOT Analysis
- 16.2.9.4. Recent Developments
- 16.2.9.5. Financials (Based on Availability)
- 16.2.10 Haier Group
- 16.2.10.1. Overview
- 16.2.10.2. Products
- 16.2.10.3. SWOT Analysis
- 16.2.10.4. Recent Developments
- 16.2.10.5. Financials (Based on Availability)
- 16.2.11 Vizio Inc
- 16.2.11.1. Overview
- 16.2.11.2. Products
- 16.2.11.3. SWOT Analysis
- 16.2.11.4. Recent Developments
- 16.2.11.5. Financials (Based on Availability)
- 16.2.12 Roku (streaming media player - Roku)
- 16.2.12.1. Overview
- 16.2.12.2. Products
- 16.2.12.3. SWOT Analysis
- 16.2.12.4. Recent Developments
- 16.2.12.5. Financials (Based on Availability)
- 16.2.13 Samsung Corporation
- 16.2.13.1. Overview
- 16.2.13.2. Products
- 16.2.13.3. SWOT Analysis
- 16.2.13.4. Recent Developments
- 16.2.13.5. Financials (Based on Availability)
- 16.2.14 LG Electronics
- 16.2.14.1. Overview
- 16.2.14.2. Products
- 16.2.14.3. SWOT Analysis
- 16.2.14.4. Recent Developments
- 16.2.14.5. Financials (Based on Availability)
- 16.2.15 Sony Corporation
- 16.2.15.1. Overview
- 16.2.15.2. Products
- 16.2.15.3. SWOT Analysis
- 16.2.15.4. Recent Developments
- 16.2.15.5. Financials (Based on Availability)
- 16.2.1 Panasonic
List of Figures
- Figure 1: Global Connected TV Market Revenue Breakdown (Million, %) by Region 2024 & 2032
- Figure 2: North America Connected TV Market Revenue (Million), by Country 2024 & 2032
- Figure 3: North America Connected TV Market Revenue Share (%), by Country 2024 & 2032
- Figure 4: Europe Connected TV Market Revenue (Million), by Country 2024 & 2032
- Figure 5: Europe Connected TV Market Revenue Share (%), by Country 2024 & 2032
- Figure 6: Asia Pacific Connected TV Market Revenue (Million), by Country 2024 & 2032
- Figure 7: Asia Pacific Connected TV Market Revenue Share (%), by Country 2024 & 2032
- Figure 8: Latin America Connected TV Market Revenue (Million), by Country 2024 & 2032
- Figure 9: Latin America Connected TV Market Revenue Share (%), by Country 2024 & 2032
- Figure 10: Middle East and Africa Connected TV Market Revenue (Million), by Country 2024 & 2032
- Figure 11: Middle East and Africa Connected TV Market Revenue Share (%), by Country 2024 & 2032
- Figure 12: North America Connected TV Market Revenue (Million), by Device 2024 & 2032
- Figure 13: North America Connected TV Market Revenue Share (%), by Device 2024 & 2032
- Figure 14: North America Connected TV Market Revenue (Million), by Country 2024 & 2032
- Figure 15: North America Connected TV Market Revenue Share (%), by Country 2024 & 2032
- Figure 16: Europe Connected TV Market Revenue (Million), by Device 2024 & 2032
- Figure 17: Europe Connected TV Market Revenue Share (%), by Device 2024 & 2032
- Figure 18: Europe Connected TV Market Revenue (Million), by Country 2024 & 2032
- Figure 19: Europe Connected TV Market Revenue Share (%), by Country 2024 & 2032
- Figure 20: Asia Connected TV Market Revenue (Million), by Device 2024 & 2032
- Figure 21: Asia Connected TV Market Revenue Share (%), by Device 2024 & 2032
- Figure 22: Asia Connected TV Market Revenue (Million), by Country 2024 & 2032
- Figure 23: Asia Connected TV Market Revenue Share (%), by Country 2024 & 2032
- Figure 24: Latin America Connected TV Market Revenue (Million), by Device 2024 & 2032
- Figure 25: Latin America Connected TV Market Revenue Share (%), by Device 2024 & 2032
- Figure 26: Latin America Connected TV Market Revenue (Million), by Country 2024 & 2032
- Figure 27: Latin America Connected TV Market Revenue Share (%), by Country 2024 & 2032
- Figure 28: Middle East and Africa Connected TV Market Revenue (Million), by Device 2024 & 2032
- Figure 29: Middle East and Africa Connected TV Market Revenue Share (%), by Device 2024 & 2032
- Figure 30: Middle East and Africa Connected TV Market Revenue (Million), by Country 2024 & 2032
- Figure 31: Middle East and Africa Connected TV Market Revenue Share (%), by Country 2024 & 2032
List of Tables
- Table 1: Global Connected TV Market Revenue Million Forecast, by Region 2019 & 2032
- Table 2: Global Connected TV Market Revenue Million Forecast, by Device 2019 & 2032
- Table 3: Global Connected TV Market Revenue Million Forecast, by Region 2019 & 2032
- Table 4: Global Connected TV Market Revenue Million Forecast, by Country 2019 & 2032
- Table 5: United States Connected TV Market Revenue (Million) Forecast, by Application 2019 & 2032
- Table 6: Canada Connected TV Market Revenue (Million) Forecast, by Application 2019 & 2032
- Table 7: Global Connected TV Market Revenue Million Forecast, by Country 2019 & 2032
- Table 8: United Kingdom Connected TV Market Revenue (Million) Forecast, by Application 2019 & 2032
- Table 9: Germany Connected TV Market Revenue (Million) Forecast, by Application 2019 & 2032
- Table 10: France Connected TV Market Revenue (Million) Forecast, by Application 2019 & 2032
- Table 11: Rest of Europe Connected TV Market Revenue (Million) Forecast, by Application 2019 & 2032
- Table 12: Global Connected TV Market Revenue Million Forecast, by Country 2019 & 2032
- Table 13: China Connected TV Market Revenue (Million) Forecast, by Application 2019 & 2032
- Table 14: India Connected TV Market Revenue (Million) Forecast, by Application 2019 & 2032
- Table 15: Japan Connected TV Market Revenue (Million) Forecast, by Application 2019 & 2032
- Table 16: Rest of Asia Pacific Connected TV Market Revenue (Million) Forecast, by Application 2019 & 2032
- Table 17: Global Connected TV Market Revenue Million Forecast, by Country 2019 & 2032
- Table 18: Connected TV Market Revenue (Million) Forecast, by Application 2019 & 2032
- Table 19: Global Connected TV Market Revenue Million Forecast, by Country 2019 & 2032
- Table 20: Connected TV Market Revenue (Million) Forecast, by Application 2019 & 2032
- Table 21: Global Connected TV Market Revenue Million Forecast, by Device 2019 & 2032
- Table 22: Global Connected TV Market Revenue Million Forecast, by Country 2019 & 2032
- Table 23: United States Connected TV Market Revenue (Million) Forecast, by Application 2019 & 2032
- Table 24: Canada Connected TV Market Revenue (Million) Forecast, by Application 2019 & 2032
- Table 25: Global Connected TV Market Revenue Million Forecast, by Device 2019 & 2032
- Table 26: Global Connected TV Market Revenue Million Forecast, by Country 2019 & 2032
- Table 27: United Kingdom Connected TV Market Revenue (Million) Forecast, by Application 2019 & 2032
- Table 28: Germany Connected TV Market Revenue (Million) Forecast, by Application 2019 & 2032
- Table 29: France Connected TV Market Revenue (Million) Forecast, by Application 2019 & 2032
- Table 30: Global Connected TV Market Revenue Million Forecast, by Device 2019 & 2032
- Table 31: Global Connected TV Market Revenue Million Forecast, by Country 2019 & 2032
- Table 32: China Connected TV Market Revenue (Million) Forecast, by Application 2019 & 2032
- Table 33: India Connected TV Market Revenue (Million) Forecast, by Application 2019 & 2032
- Table 34: Japan Connected TV Market Revenue (Million) Forecast, by Application 2019 & 2032
- Table 35: Australia and New Zealand Connected TV Market Revenue (Million) Forecast, by Application 2019 & 2032
- Table 36: Global Connected TV Market Revenue Million Forecast, by Device 2019 & 2032
- Table 37: Global Connected TV Market Revenue Million Forecast, by Country 2019 & 2032
- Table 38: Global Connected TV Market Revenue Million Forecast, by Device 2019 & 2032
- Table 39: Global Connected TV Market Revenue Million Forecast, by Country 2019 & 2032
Frequently Asked Questions
1. What is the projected Compound Annual Growth Rate (CAGR) of the Connected TV Market?
The projected CAGR is approximately 13.20%.
2. Which companies are prominent players in the Connected TV Market?
Key companies in the market include Panasonic, Amazon (streaming media player - Fire TV), Hisense, Apple (streaming media player - Apple TV), Skyworth, Google (Chromecast)*List Not Exhaustive, Sharp Electronics, Xiaomi Corporation, TCL, Haier Group, Vizio Inc, Roku (streaming media player - Roku), Samsung Corporation, LG Electronics, Sony Corporation.
3. What are the main segments of the Connected TV Market?
The market segments include Device.
4. Can you provide details about the market size?
The market size is estimated to be USD 9.28 Million as of 2022.
5. What are some drivers contributing to market growth?
Growing internet penetration and anticipated shift from conventional TVs; Industry collaborations and favorable market conditions (shift from internet TV to smart TV).
6. What are the notable trends driving market growth?
Smart TV Accounts for the Largest Market Share.
7. Are there any restraints impacting market growth?
The Need for High Investment in Content Creation and Broadcasting; Bandwidth Allocation for 4K Resolution.
8. Can you provide examples of recent developments in the market?
May 2023: Blaupunkt and Flipkart announced a partnership to launch the 40-inch Android TV Sigma series. The new Blaupunkt Sigma Series Android TV has a bezel-less design, 512 MB RAM, 4 GB ROM, two bottom-firing built-in speakers with surround sound technology, and 3 HDMI and 2 USB ports.
9. What pricing options are available for accessing the report?
Pricing options include single-user, multi-user, and enterprise licenses priced at USD 4750, USD 5250, and USD 8750 respectively.
10. Is the market size provided in terms of value or volume?
The market size is provided in terms of value, measured in Million.
11. Are there any specific market keywords associated with the report?
Yes, the market keyword associated with the report is "Connected TV Market," which aids in identifying and referencing the specific market segment covered.
12. How do I determine which pricing option suits my needs best?
The pricing options vary based on user requirements and access needs. Individual users may opt for single-user licenses, while businesses requiring broader access may choose multi-user or enterprise licenses for cost-effective access to the report.
13. Are there any additional resources or data provided in the Connected TV Market report?
While the report offers comprehensive insights, it's advisable to review the specific contents or supplementary materials provided to ascertain if additional resources or data are available.
14. How can I stay updated on further developments or reports in the Connected TV Market?
To stay informed about further developments, trends, and reports in the Connected TV Market, consider subscribing to industry newsletters, following relevant companies and organizations, or regularly checking reputable industry news sources and publications.
Methodology
Step 1 - Identification of Relevant Samples Size from Population Database


Step 2 - Approaches for Defining Global Market Size (Value, Volume* & Price*)

Note*: In applicable scenarios
Step 3 - Data Sources
Primary Research
- Web Analytics
- Survey Reports
- Research Institute
- Latest Research Reports
- Opinion Leaders
Secondary Research
- Annual Reports
- White Paper
- Latest Press Release
- Industry Association
- Paid Database
- Investor Presentations

Step 4 - Data Triangulation
Involves using different sources of information in order to increase the validity of a study
These sources are likely to be stakeholders in a program - participants, other researchers, program staff, other community members, and so on.
Then we put all data in single framework & apply various statistical tools to find out the dynamic on the market.
During the analysis stage, feedback from the stakeholder groups would be compared to determine areas of agreement as well as areas of divergence
