

Key Insights
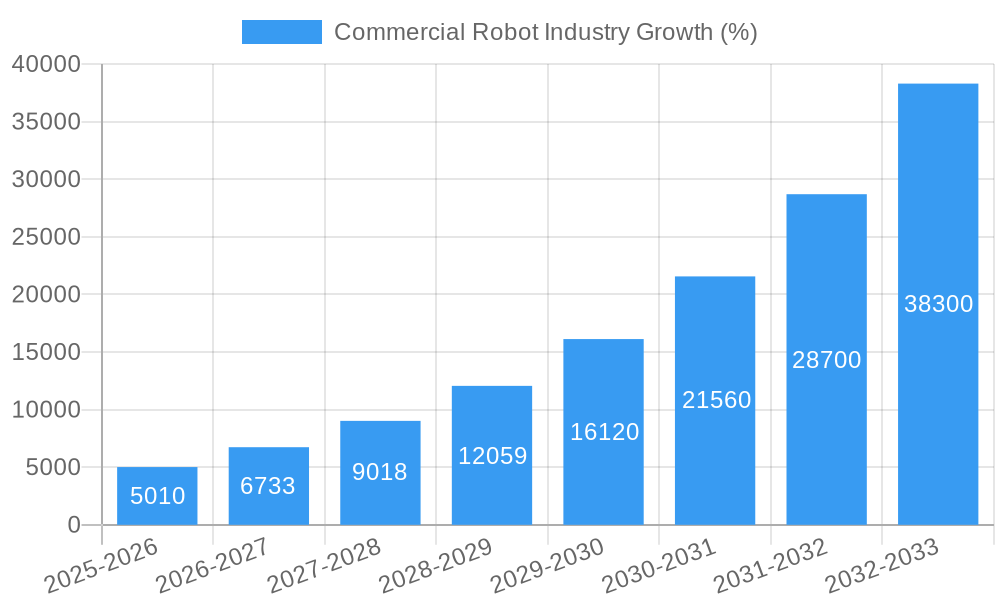
The commercial robot industry is experiencing explosive growth, projected to reach a substantial market size driven by advancements in artificial intelligence, automation needs across various sectors, and decreasing production costs. The 33.65% CAGR from 2019-2033 indicates a significant upward trajectory, with substantial expansion anticipated across all segments. Key drivers include the increasing adoption of automation in manufacturing, logistics, healthcare, and agriculture to improve efficiency, productivity, and safety. Emerging trends such as the development of more sophisticated AI-powered robots capable of complex tasks, the rise of collaborative robots (cobots) for human-robot interaction, and the growing demand for robots in service industries are further fueling this expansion. While initial investment costs and regulatory hurdles pose some restraints, the long-term benefits of automation are outweighing these challenges. The market is segmented by robot type (drones, field robots, medical robots, autonomous guided vehicles, and others) and application (medical & healthcare, defense & security, agriculture & forestry, marine, and others), each exhibiting unique growth patterns. The North American and Asia-Pacific regions are expected to dominate the market due to early adoption and significant technological advancements in those areas. Companies like iRobot, Kuka, and Yaskawa are leading players, continuously innovating and expanding their product portfolios to meet the evolving market demands. The forecast period of 2025-2033 presents significant opportunities for market expansion, particularly in emerging economies seeking to leverage automation for economic growth and improved infrastructure.
The diverse applications of commercial robots across various industries contribute to this substantial market growth. Medical robots are revolutionizing healthcare through minimally invasive surgeries and improved patient care. Drones and autonomous guided vehicles are transforming logistics and delivery services, increasing efficiency and reducing costs. In agriculture, robots are enhancing precision farming techniques and optimizing resource utilization. The defense and security sectors also heavily utilize robots for surveillance, bomb disposal, and other critical operations. As technology continues to advance, we can expect to see even greater integration of commercial robots into everyday life and across various aspects of the global economy, potentially creating new job roles and shifting economic paradigms. Further, the rise of service robots in hospitality, retail, and other consumer-facing areas will significantly contribute to overall market expansion.
Commercial Robot Industry Market Report: 2019-2033
This comprehensive report provides an in-depth analysis of the Commercial Robot Industry, projecting a market valuation of xx Million by 2033. It covers market composition, technological advancements, leading players, and future growth opportunities, offering invaluable insights for stakeholders across the value chain. The study period spans 2019-2033, with 2025 serving as the base and estimated year. The forecast period extends from 2025 to 2033, while the historical period covers 2019-2024.
Commercial Robot Industry Market Composition & Trends
This section delves into the competitive landscape of the Commercial Robot Industry, analyzing market concentration, innovation drivers, regulatory frameworks, substitute products, end-user profiles, and mergers & acquisitions (M&A) activities. The market exhibits a moderately concentrated structure, with key players holding significant market share. However, the entry of numerous startups and technological advancements are fostering a dynamic competitive environment.
- Market Share Distribution: The top 5 players hold an estimated xx% of the market share in 2025, while the remaining share is distributed among numerous smaller companies and emerging players. Precise figures will vary by segment.
- Innovation Catalysts: Significant investments in R&D, particularly in areas like AI, machine learning, and sensor technologies, are driving continuous product innovation.
- Regulatory Landscape: Stringent safety and ethical regulations, varying across regions, significantly impact market development and adoption rates.
- Substitute Products: Traditional manual labor remains a substitute for robots in some applications, although automation's cost-effectiveness and efficiency advantages continue to drive wider adoption.
- End-User Profiles: Key end-users include manufacturing, logistics, healthcare, defense, and agriculture sectors. Demand varies significantly across segments.
- M&A Activities: The industry has seen several notable M&A deals in recent years, totaling an estimated value of xx Million in the period 2019-2024, driven by the desire to expand product portfolios and market reach. This trend is expected to continue.
Commercial Robot Industry Industry Evolution
The Commercial Robot Industry has witnessed exponential growth in recent years, driven by technological advancements and increasing demand across diverse sectors. From 2019 to 2024, the industry registered a Compound Annual Growth Rate (CAGR) of xx%, reaching a market value of xx Million. This growth is projected to continue, with a projected CAGR of xx% from 2025 to 2033, fueled by the integration of Artificial Intelligence (AI), advancements in sensor technology, and the rising need for automation across various sectors. Increased adoption in logistics, driven by e-commerce expansion, has been a key growth catalyst. Furthermore, the ongoing development of more sophisticated and versatile robots capable of handling complex tasks is significantly impacting market expansion. Consumer demand for improved efficiency, increased productivity, and reduced labor costs are further accelerating adoption rates. The integration of robotics into service sectors like hospitality and retail shows promising growth potential.
Leading Regions, Countries, or Segments in Commercial Robot Industry
The Commercial Robot Industry is geographically diverse, with notable variations in market size and growth across different regions. While the global market is expanding rapidly, specific segments and regions are exhibiting particularly strong growth.
- Dominant Segment (By Type): Autonomous Guided Vehicles (AGVs) are expected to dominate the market in 2025 due to their increasing adoption in manufacturing and logistics.
- Dominant Segment (By Application): The medical and healthcare sector is projected to be the leading application segment, driven by demand for surgical robots and automation in clinical settings.
- Key Drivers:
- High Investment in R&D: Significant funding directed towards robotics research, particularly in AI and machine learning, is accelerating innovation.
- Favorable Government Policies: Several governments are actively promoting robotics adoption through incentives and supportive regulations.
- Labor Shortages: The growing scarcity of skilled labor in many sectors is driving demand for automated solutions.
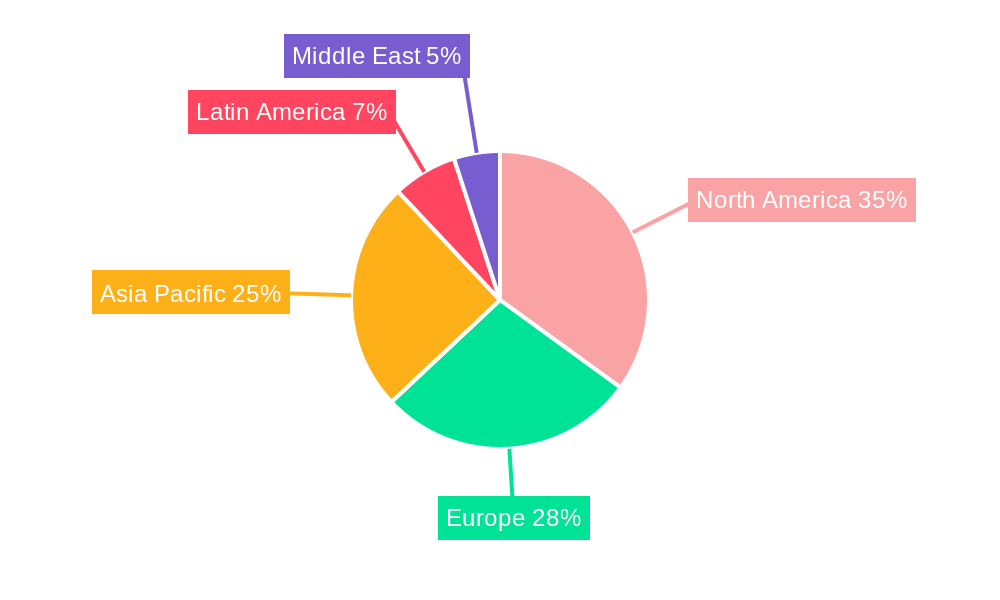
The North American and European markets currently hold the largest shares but significant growth is anticipated in the Asia-Pacific region, fueled by rising industrial automation and economic growth.
Commercial Robot Industry Product Innovations
Recent innovations include advancements in collaborative robots (cobots), capable of working safely alongside humans, and the development of more sophisticated AI-powered robots with enhanced dexterity and perception abilities. These advancements are expanding the range of applications for robots across various industries. Unique selling propositions include increased efficiency, safety features, and ease of integration into existing systems. The integration of advanced sensor technology, such as 3D vision and force sensing, enables robots to perform increasingly complex tasks with greater precision and accuracy.
Propelling Factors for Commercial Robot Industry Growth
Technological advancements, economic factors, and supportive regulatory environments are key drivers of the Commercial Robot Industry's growth. Technological breakthroughs, particularly in AI, machine learning, and sensor technologies, are constantly expanding the capabilities of robots, enabling their adoption in increasingly diverse applications. The rising need for automation due to labor shortages and increased operational efficiency demands also significantly contributes. Governments worldwide are actively promoting robotics through tax incentives and supportive regulations, further accelerating market expansion.
Obstacles in the Commercial Robot Industry Market
The Commercial Robot Industry faces challenges, including high initial investment costs, concerns about job displacement, and the need for skilled labor for robot deployment and maintenance. Supply chain disruptions can impact production timelines and costs. Furthermore, stringent regulatory requirements and safety standards can add complexity to product development and market entry. The competitive landscape is intensifying with new players entering the market.
Future Opportunities in Commercial Robot Industry
Expanding into new markets, such as agriculture, construction, and space exploration, presents significant opportunities. Developing more adaptable, modular, and easy-to-program robots will expand their use cases. The integration of cutting-edge technologies like edge computing and blockchain can enhance data security and robot operations. Focusing on developing customized solutions for specific industry requirements will drive the adoption of specialized robotic systems.
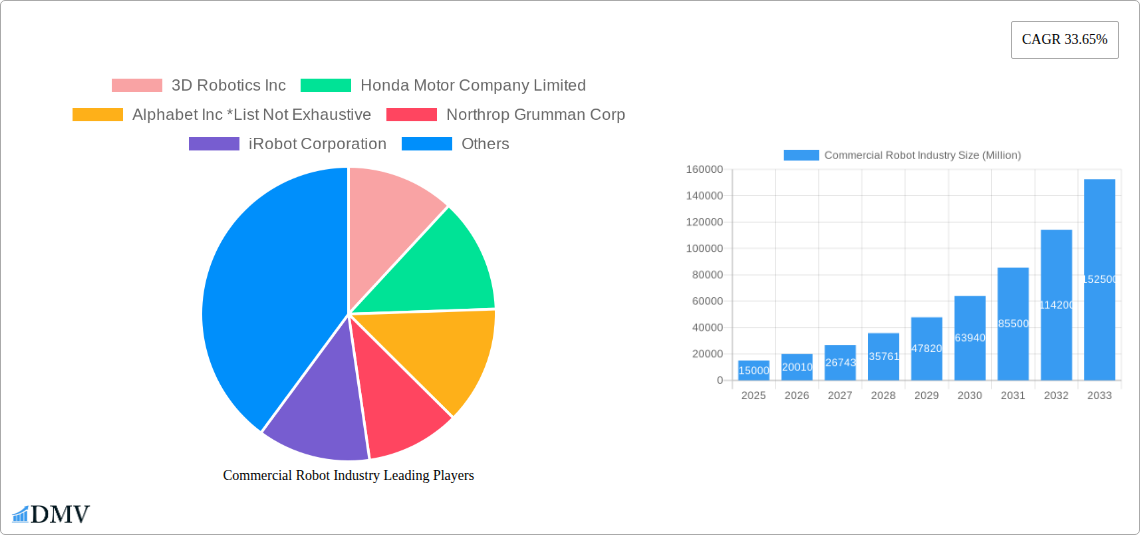
Major Players in the Commercial Robot Industry Ecosystem
- 3D Robotics Inc
- Honda Motor Company Limited
- Alphabet Inc
- Northrop Grumman Corp
- iRobot Corporation
- Kuka AG
- Omron Adept Technologies Inc
- Yaskawa Electric Corporation
Key Developments in Commercial Robot Industry Industry
- January 2022: LG launched the CLOi service robot in the US, expanding the market for commercial robots in service sectors.
- July 2022: Ganymed Robotics secured EUR 21 Million in Series B funding, indicating significant investment in next-generation surgical robots.
Strategic Commercial Robot Industry Market Forecast
The Commercial Robot Industry is poised for continued growth, driven by technological innovation, increasing demand for automation, and favorable regulatory environments. Emerging applications in diverse sectors and the development of advanced robotic systems will fuel this expansion. The market is expected to witness significant growth in the coming years, opening up new opportunities for both established players and emerging startups. The integration of AI and IoT will be pivotal to enhancing robots' capabilities and driving further adoption.
Commercial Robot Industry Segmentation
-
1. Type of Robot
- 1.1. Drones
- 1.2. Field Robots
- 1.3. Medical Robots
- 1.4. Autonomous Guided Robotics
- 1.5. Other Types of Robots
-
2. Application
- 2.1. Medical and Healthcare
- 2.2. Defense and Security
- 2.3. Agriculture and Forestry
- 2.4. Marine
- 2.5. Other Applications
Commercial Robot Industry Segmentation By Geography
-
1. North America
- 1.1. United States
- 1.2. Canada
-
2. Europe
- 2.1. United Kingdom
- 2.2. Germany
- 2.3. France
- 2.4. Spain
- 2.5. Rest of Europe
-
3. Asia Pacific
- 3.1. China
- 3.2. India
- 3.3. Japan
- 3.4. Singapore
- 3.5. Australia
- 3.6. Rest of Asia Pacific
-
4. Latin America
- 4.1. Brazil
- 4.2. Mexico
- 4.3. Argentina
- 4.4. Rest of Latin America
- 5. Middle East
-
6. United Arab Emirates
- 6.1. Saudi Arabia
- 6.2. South Africa
- 6.3. Rest of Middle East
Commercial Robot Industry REPORT HIGHLIGHTS
| Aspects | Details |
|---|---|
| Study Period | 2019-2033 |
| Base Year | 2024 |
| Estimated Year | 2025 |
| Forecast Period | 2025-2033 |
| Historical Period | 2019-2024 |
| Growth Rate | CAGR of 33.65% from 2019-2033 |
| Segmentation |
|
Table of Contents
- 1. Introduction
- 1.1. Research Scope
- 1.2. Market Segmentation
- 1.3. Research Methodology
- 1.4. Definitions and Assumptions
- 2. Executive Summary
- 2.1. Introduction
- 3. Market Dynamics
- 3.1. Introduction
- 3.2. Market Drivers
- 3.2.1. Technological Advancements and Convergence of Robotics and Artificial Intelligence; Increasing Government Spending on Defense
- 3.3. Market Restrains
- 3.3.1. Higher Costs of the Robotic Systems
- 3.4. Market Trends
- 3.4.1. Drones in Military and Defense to Present Significant Opportunities for the Commercial Robotics Market
- 4. Market Factor Analysis
- 4.1. Porters Five Forces
- 4.2. Supply/Value Chain
- 4.3. PESTEL analysis
- 4.4. Market Entropy
- 4.5. Patent/Trademark Analysis
- 5. Global Commercial Robot Industry Analysis, Insights and Forecast, 2019-2031
- 5.1. Market Analysis, Insights and Forecast - by Type of Robot
- 5.1.1. Drones
- 5.1.2. Field Robots
- 5.1.3. Medical Robots
- 5.1.4. Autonomous Guided Robotics
- 5.1.5. Other Types of Robots
- 5.2. Market Analysis, Insights and Forecast - by Application
- 5.2.1. Medical and Healthcare
- 5.2.2. Defense and Security
- 5.2.3. Agriculture and Forestry
- 5.2.4. Marine
- 5.2.5. Other Applications
- 5.3. Market Analysis, Insights and Forecast - by Region
- 5.3.1. North America
- 5.3.2. Europe
- 5.3.3. Asia Pacific
- 5.3.4. Latin America
- 5.3.5. Middle East
- 5.3.6. United Arab Emirates
- 5.1. Market Analysis, Insights and Forecast - by Type of Robot
- 6. North America Commercial Robot Industry Analysis, Insights and Forecast, 2019-2031
- 6.1. Market Analysis, Insights and Forecast - by Type of Robot
- 6.1.1. Drones
- 6.1.2. Field Robots
- 6.1.3. Medical Robots
- 6.1.4. Autonomous Guided Robotics
- 6.1.5. Other Types of Robots
- 6.2. Market Analysis, Insights and Forecast - by Application
- 6.2.1. Medical and Healthcare
- 6.2.2. Defense and Security
- 6.2.3. Agriculture and Forestry
- 6.2.4. Marine
- 6.2.5. Other Applications
- 6.1. Market Analysis, Insights and Forecast - by Type of Robot
- 7. Europe Commercial Robot Industry Analysis, Insights and Forecast, 2019-2031
- 7.1. Market Analysis, Insights and Forecast - by Type of Robot
- 7.1.1. Drones
- 7.1.2. Field Robots
- 7.1.3. Medical Robots
- 7.1.4. Autonomous Guided Robotics
- 7.1.5. Other Types of Robots
- 7.2. Market Analysis, Insights and Forecast - by Application
- 7.2.1. Medical and Healthcare
- 7.2.2. Defense and Security
- 7.2.3. Agriculture and Forestry
- 7.2.4. Marine
- 7.2.5. Other Applications
- 7.1. Market Analysis, Insights and Forecast - by Type of Robot
- 8. Asia Pacific Commercial Robot Industry Analysis, Insights and Forecast, 2019-2031
- 8.1. Market Analysis, Insights and Forecast - by Type of Robot
- 8.1.1. Drones
- 8.1.2. Field Robots
- 8.1.3. Medical Robots
- 8.1.4. Autonomous Guided Robotics
- 8.1.5. Other Types of Robots
- 8.2. Market Analysis, Insights and Forecast - by Application
- 8.2.1. Medical and Healthcare
- 8.2.2. Defense and Security
- 8.2.3. Agriculture and Forestry
- 8.2.4. Marine
- 8.2.5. Other Applications
- 8.1. Market Analysis, Insights and Forecast - by Type of Robot
- 9. Latin America Commercial Robot Industry Analysis, Insights and Forecast, 2019-2031
- 9.1. Market Analysis, Insights and Forecast - by Type of Robot
- 9.1.1. Drones
- 9.1.2. Field Robots
- 9.1.3. Medical Robots
- 9.1.4. Autonomous Guided Robotics
- 9.1.5. Other Types of Robots
- 9.2. Market Analysis, Insights and Forecast - by Application
- 9.2.1. Medical and Healthcare
- 9.2.2. Defense and Security
- 9.2.3. Agriculture and Forestry
- 9.2.4. Marine
- 9.2.5. Other Applications
- 9.1. Market Analysis, Insights and Forecast - by Type of Robot
- 10. Middle East Commercial Robot Industry Analysis, Insights and Forecast, 2019-2031
- 10.1. Market Analysis, Insights and Forecast - by Type of Robot
- 10.1.1. Drones
- 10.1.2. Field Robots
- 10.1.3. Medical Robots
- 10.1.4. Autonomous Guided Robotics
- 10.1.5. Other Types of Robots
- 10.2. Market Analysis, Insights and Forecast - by Application
- 10.2.1. Medical and Healthcare
- 10.2.2. Defense and Security
- 10.2.3. Agriculture and Forestry
- 10.2.4. Marine
- 10.2.5. Other Applications
- 10.1. Market Analysis, Insights and Forecast - by Type of Robot
- 11. United Arab Emirates Commercial Robot Industry Analysis, Insights and Forecast, 2019-2031
- 11.1. Market Analysis, Insights and Forecast - by Type of Robot
- 11.1.1. Drones
- 11.1.2. Field Robots
- 11.1.3. Medical Robots
- 11.1.4. Autonomous Guided Robotics
- 11.1.5. Other Types of Robots
- 11.2. Market Analysis, Insights and Forecast - by Application
- 11.2.1. Medical and Healthcare
- 11.2.2. Defense and Security
- 11.2.3. Agriculture and Forestry
- 11.2.4. Marine
- 11.2.5. Other Applications
- 11.1. Market Analysis, Insights and Forecast - by Type of Robot
- 12. North America Commercial Robot Industry Analysis, Insights and Forecast, 2019-2031
- 12.1. Market Analysis, Insights and Forecast - By Country/Sub-region
- 12.1.1 United States
- 12.1.2 Canada
- 13. Europe Commercial Robot Industry Analysis, Insights and Forecast, 2019-2031
- 13.1. Market Analysis, Insights and Forecast - By Country/Sub-region
- 13.1.1 United Kingdom
- 13.1.2 Germany
- 13.1.3 France
- 13.1.4 Spain
- 13.1.5 Rest of Europe
- 14. Asia Pacific Commercial Robot Industry Analysis, Insights and Forecast, 2019-2031
- 14.1. Market Analysis, Insights and Forecast - By Country/Sub-region
- 14.1.1 China
- 14.1.2 India
- 14.1.3 Japan
- 14.1.4 Singapore
- 14.1.5 Australia
- 14.1.6 Rest of Asia Pacific
- 15. Latin America Commercial Robot Industry Analysis, Insights and Forecast, 2019-2031
- 15.1. Market Analysis, Insights and Forecast - By Country/Sub-region
- 15.1.1 Brazil
- 15.1.2 Mexico
- 15.1.3 Argentina
- 15.1.4 Rest of Latin America
- 16. Middle East Commercial Robot Industry Analysis, Insights and Forecast, 2019-2031
- 16.1. Market Analysis, Insights and Forecast - By Country/Sub-region
- 16.1.1.
- 17. United Arab Emirates Commercial Robot Industry Analysis, Insights and Forecast, 2019-2031
- 17.1. Market Analysis, Insights and Forecast - By Country/Sub-region
- 17.1.1 Saudi Arabia
- 17.1.2 South Africa
- 17.1.3 Rest of Middle East
- 18. Competitive Analysis
- 18.1. Global Market Share Analysis 2024
- 18.2. Company Profiles
- 18.2.1 3D Robotics Inc
- 18.2.1.1. Overview
- 18.2.1.2. Products
- 18.2.1.3. SWOT Analysis
- 18.2.1.4. Recent Developments
- 18.2.1.5. Financials (Based on Availability)
- 18.2.2 Honda Motor Company Limited
- 18.2.2.1. Overview
- 18.2.2.2. Products
- 18.2.2.3. SWOT Analysis
- 18.2.2.4. Recent Developments
- 18.2.2.5. Financials (Based on Availability)
- 18.2.3 Alphabet Inc *List Not Exhaustive
- 18.2.3.1. Overview
- 18.2.3.2. Products
- 18.2.3.3. SWOT Analysis
- 18.2.3.4. Recent Developments
- 18.2.3.5. Financials (Based on Availability)
- 18.2.4 Northrop Grumman Corp
- 18.2.4.1. Overview
- 18.2.4.2. Products
- 18.2.4.3. SWOT Analysis
- 18.2.4.4. Recent Developments
- 18.2.4.5. Financials (Based on Availability)
- 18.2.5 iRobot Corporation
- 18.2.5.1. Overview
- 18.2.5.2. Products
- 18.2.5.3. SWOT Analysis
- 18.2.5.4. Recent Developments
- 18.2.5.5. Financials (Based on Availability)
- 18.2.6 Kuka AG
- 18.2.6.1. Overview
- 18.2.6.2. Products
- 18.2.6.3. SWOT Analysis
- 18.2.6.4. Recent Developments
- 18.2.6.5. Financials (Based on Availability)
- 18.2.7 Omron Adept Technologies Inc
- 18.2.7.1. Overview
- 18.2.7.2. Products
- 18.2.7.3. SWOT Analysis
- 18.2.7.4. Recent Developments
- 18.2.7.5. Financials (Based on Availability)
- 18.2.8 Yaskawa Electric Corporation
- 18.2.8.1. Overview
- 18.2.8.2. Products
- 18.2.8.3. SWOT Analysis
- 18.2.8.4. Recent Developments
- 18.2.8.5. Financials (Based on Availability)
- 18.2.1 3D Robotics Inc
List of Figures
- Figure 1: Global Commercial Robot Industry Revenue Breakdown (Million, %) by Region 2024 & 2032
- Figure 2: North America Commercial Robot Industry Revenue (Million), by Country 2024 & 2032
- Figure 3: North America Commercial Robot Industry Revenue Share (%), by Country 2024 & 2032
- Figure 4: Europe Commercial Robot Industry Revenue (Million), by Country 2024 & 2032
- Figure 5: Europe Commercial Robot Industry Revenue Share (%), by Country 2024 & 2032
- Figure 6: Asia Pacific Commercial Robot Industry Revenue (Million), by Country 2024 & 2032
- Figure 7: Asia Pacific Commercial Robot Industry Revenue Share (%), by Country 2024 & 2032
- Figure 8: Latin America Commercial Robot Industry Revenue (Million), by Country 2024 & 2032
- Figure 9: Latin America Commercial Robot Industry Revenue Share (%), by Country 2024 & 2032
- Figure 10: Middle East Commercial Robot Industry Revenue (Million), by Country 2024 & 2032
- Figure 11: Middle East Commercial Robot Industry Revenue Share (%), by Country 2024 & 2032
- Figure 12: United Arab Emirates Commercial Robot Industry Revenue (Million), by Country 2024 & 2032
- Figure 13: United Arab Emirates Commercial Robot Industry Revenue Share (%), by Country 2024 & 2032
- Figure 14: North America Commercial Robot Industry Revenue (Million), by Type of Robot 2024 & 2032
- Figure 15: North America Commercial Robot Industry Revenue Share (%), by Type of Robot 2024 & 2032
- Figure 16: North America Commercial Robot Industry Revenue (Million), by Application 2024 & 2032
- Figure 17: North America Commercial Robot Industry Revenue Share (%), by Application 2024 & 2032
- Figure 18: North America Commercial Robot Industry Revenue (Million), by Country 2024 & 2032
- Figure 19: North America Commercial Robot Industry Revenue Share (%), by Country 2024 & 2032
- Figure 20: Europe Commercial Robot Industry Revenue (Million), by Type of Robot 2024 & 2032
- Figure 21: Europe Commercial Robot Industry Revenue Share (%), by Type of Robot 2024 & 2032
- Figure 22: Europe Commercial Robot Industry Revenue (Million), by Application 2024 & 2032
- Figure 23: Europe Commercial Robot Industry Revenue Share (%), by Application 2024 & 2032
- Figure 24: Europe Commercial Robot Industry Revenue (Million), by Country 2024 & 2032
- Figure 25: Europe Commercial Robot Industry Revenue Share (%), by Country 2024 & 2032
- Figure 26: Asia Pacific Commercial Robot Industry Revenue (Million), by Type of Robot 2024 & 2032
- Figure 27: Asia Pacific Commercial Robot Industry Revenue Share (%), by Type of Robot 2024 & 2032
- Figure 28: Asia Pacific Commercial Robot Industry Revenue (Million), by Application 2024 & 2032
- Figure 29: Asia Pacific Commercial Robot Industry Revenue Share (%), by Application 2024 & 2032
- Figure 30: Asia Pacific Commercial Robot Industry Revenue (Million), by Country 2024 & 2032
- Figure 31: Asia Pacific Commercial Robot Industry Revenue Share (%), by Country 2024 & 2032
- Figure 32: Latin America Commercial Robot Industry Revenue (Million), by Type of Robot 2024 & 2032
- Figure 33: Latin America Commercial Robot Industry Revenue Share (%), by Type of Robot 2024 & 2032
- Figure 34: Latin America Commercial Robot Industry Revenue (Million), by Application 2024 & 2032
- Figure 35: Latin America Commercial Robot Industry Revenue Share (%), by Application 2024 & 2032
- Figure 36: Latin America Commercial Robot Industry Revenue (Million), by Country 2024 & 2032
- Figure 37: Latin America Commercial Robot Industry Revenue Share (%), by Country 2024 & 2032
- Figure 38: Middle East Commercial Robot Industry Revenue (Million), by Type of Robot 2024 & 2032
- Figure 39: Middle East Commercial Robot Industry Revenue Share (%), by Type of Robot 2024 & 2032
- Figure 40: Middle East Commercial Robot Industry Revenue (Million), by Application 2024 & 2032
- Figure 41: Middle East Commercial Robot Industry Revenue Share (%), by Application 2024 & 2032
- Figure 42: Middle East Commercial Robot Industry Revenue (Million), by Country 2024 & 2032
- Figure 43: Middle East Commercial Robot Industry Revenue Share (%), by Country 2024 & 2032
- Figure 44: United Arab Emirates Commercial Robot Industry Revenue (Million), by Type of Robot 2024 & 2032
- Figure 45: United Arab Emirates Commercial Robot Industry Revenue Share (%), by Type of Robot 2024 & 2032
- Figure 46: United Arab Emirates Commercial Robot Industry Revenue (Million), by Application 2024 & 2032
- Figure 47: United Arab Emirates Commercial Robot Industry Revenue Share (%), by Application 2024 & 2032
- Figure 48: United Arab Emirates Commercial Robot Industry Revenue (Million), by Country 2024 & 2032
- Figure 49: United Arab Emirates Commercial Robot Industry Revenue Share (%), by Country 2024 & 2032
List of Tables
- Table 1: Global Commercial Robot Industry Revenue Million Forecast, by Region 2019 & 2032
- Table 2: Global Commercial Robot Industry Revenue Million Forecast, by Type of Robot 2019 & 2032
- Table 3: Global Commercial Robot Industry Revenue Million Forecast, by Application 2019 & 2032
- Table 4: Global Commercial Robot Industry Revenue Million Forecast, by Region 2019 & 2032
- Table 5: Global Commercial Robot Industry Revenue Million Forecast, by Country 2019 & 2032
- Table 6: United States Commercial Robot Industry Revenue (Million) Forecast, by Application 2019 & 2032
- Table 7: Canada Commercial Robot Industry Revenue (Million) Forecast, by Application 2019 & 2032
- Table 8: Global Commercial Robot Industry Revenue Million Forecast, by Country 2019 & 2032
- Table 9: United Kingdom Commercial Robot Industry Revenue (Million) Forecast, by Application 2019 & 2032
- Table 10: Germany Commercial Robot Industry Revenue (Million) Forecast, by Application 2019 & 2032
- Table 11: France Commercial Robot Industry Revenue (Million) Forecast, by Application 2019 & 2032
- Table 12: Spain Commercial Robot Industry Revenue (Million) Forecast, by Application 2019 & 2032
- Table 13: Rest of Europe Commercial Robot Industry Revenue (Million) Forecast, by Application 2019 & 2032
- Table 14: Global Commercial Robot Industry Revenue Million Forecast, by Country 2019 & 2032
- Table 15: China Commercial Robot Industry Revenue (Million) Forecast, by Application 2019 & 2032
- Table 16: India Commercial Robot Industry Revenue (Million) Forecast, by Application 2019 & 2032
- Table 17: Japan Commercial Robot Industry Revenue (Million) Forecast, by Application 2019 & 2032
- Table 18: Singapore Commercial Robot Industry Revenue (Million) Forecast, by Application 2019 & 2032
- Table 19: Australia Commercial Robot Industry Revenue (Million) Forecast, by Application 2019 & 2032
- Table 20: Rest of Asia Pacific Commercial Robot Industry Revenue (Million) Forecast, by Application 2019 & 2032
- Table 21: Global Commercial Robot Industry Revenue Million Forecast, by Country 2019 & 2032
- Table 22: Brazil Commercial Robot Industry Revenue (Million) Forecast, by Application 2019 & 2032
- Table 23: Mexico Commercial Robot Industry Revenue (Million) Forecast, by Application 2019 & 2032
- Table 24: Argentina Commercial Robot Industry Revenue (Million) Forecast, by Application 2019 & 2032
- Table 25: Rest of Latin America Commercial Robot Industry Revenue (Million) Forecast, by Application 2019 & 2032
- Table 26: Global Commercial Robot Industry Revenue Million Forecast, by Country 2019 & 2032
- Table 27: Commercial Robot Industry Revenue (Million) Forecast, by Application 2019 & 2032
- Table 28: Global Commercial Robot Industry Revenue Million Forecast, by Country 2019 & 2032
- Table 29: Saudi Arabia Commercial Robot Industry Revenue (Million) Forecast, by Application 2019 & 2032
- Table 30: South Africa Commercial Robot Industry Revenue (Million) Forecast, by Application 2019 & 2032
- Table 31: Rest of Middle East Commercial Robot Industry Revenue (Million) Forecast, by Application 2019 & 2032
- Table 32: Global Commercial Robot Industry Revenue Million Forecast, by Type of Robot 2019 & 2032
- Table 33: Global Commercial Robot Industry Revenue Million Forecast, by Application 2019 & 2032
- Table 34: Global Commercial Robot Industry Revenue Million Forecast, by Country 2019 & 2032
- Table 35: United States Commercial Robot Industry Revenue (Million) Forecast, by Application 2019 & 2032
- Table 36: Canada Commercial Robot Industry Revenue (Million) Forecast, by Application 2019 & 2032
- Table 37: Global Commercial Robot Industry Revenue Million Forecast, by Type of Robot 2019 & 2032
- Table 38: Global Commercial Robot Industry Revenue Million Forecast, by Application 2019 & 2032
- Table 39: Global Commercial Robot Industry Revenue Million Forecast, by Country 2019 & 2032
- Table 40: United Kingdom Commercial Robot Industry Revenue (Million) Forecast, by Application 2019 & 2032
- Table 41: Germany Commercial Robot Industry Revenue (Million) Forecast, by Application 2019 & 2032
- Table 42: France Commercial Robot Industry Revenue (Million) Forecast, by Application 2019 & 2032
- Table 43: Spain Commercial Robot Industry Revenue (Million) Forecast, by Application 2019 & 2032
- Table 44: Rest of Europe Commercial Robot Industry Revenue (Million) Forecast, by Application 2019 & 2032
- Table 45: Global Commercial Robot Industry Revenue Million Forecast, by Type of Robot 2019 & 2032
- Table 46: Global Commercial Robot Industry Revenue Million Forecast, by Application 2019 & 2032
- Table 47: Global Commercial Robot Industry Revenue Million Forecast, by Country 2019 & 2032
- Table 48: China Commercial Robot Industry Revenue (Million) Forecast, by Application 2019 & 2032
- Table 49: India Commercial Robot Industry Revenue (Million) Forecast, by Application 2019 & 2032
- Table 50: Japan Commercial Robot Industry Revenue (Million) Forecast, by Application 2019 & 2032
- Table 51: Singapore Commercial Robot Industry Revenue (Million) Forecast, by Application 2019 & 2032
- Table 52: Australia Commercial Robot Industry Revenue (Million) Forecast, by Application 2019 & 2032
- Table 53: Rest of Asia Pacific Commercial Robot Industry Revenue (Million) Forecast, by Application 2019 & 2032
- Table 54: Global Commercial Robot Industry Revenue Million Forecast, by Type of Robot 2019 & 2032
- Table 55: Global Commercial Robot Industry Revenue Million Forecast, by Application 2019 & 2032
- Table 56: Global Commercial Robot Industry Revenue Million Forecast, by Country 2019 & 2032
- Table 57: Brazil Commercial Robot Industry Revenue (Million) Forecast, by Application 2019 & 2032
- Table 58: Mexico Commercial Robot Industry Revenue (Million) Forecast, by Application 2019 & 2032
- Table 59: Argentina Commercial Robot Industry Revenue (Million) Forecast, by Application 2019 & 2032
- Table 60: Rest of Latin America Commercial Robot Industry Revenue (Million) Forecast, by Application 2019 & 2032
- Table 61: Global Commercial Robot Industry Revenue Million Forecast, by Type of Robot 2019 & 2032
- Table 62: Global Commercial Robot Industry Revenue Million Forecast, by Application 2019 & 2032
- Table 63: Global Commercial Robot Industry Revenue Million Forecast, by Country 2019 & 2032
- Table 64: Global Commercial Robot Industry Revenue Million Forecast, by Type of Robot 2019 & 2032
- Table 65: Global Commercial Robot Industry Revenue Million Forecast, by Application 2019 & 2032
- Table 66: Global Commercial Robot Industry Revenue Million Forecast, by Country 2019 & 2032
- Table 67: Saudi Arabia Commercial Robot Industry Revenue (Million) Forecast, by Application 2019 & 2032
- Table 68: South Africa Commercial Robot Industry Revenue (Million) Forecast, by Application 2019 & 2032
- Table 69: Rest of Middle East Commercial Robot Industry Revenue (Million) Forecast, by Application 2019 & 2032
Frequently Asked Questions
1. What is the projected Compound Annual Growth Rate (CAGR) of the Commercial Robot Industry?
The projected CAGR is approximately 33.65%.
2. Which companies are prominent players in the Commercial Robot Industry?
Key companies in the market include 3D Robotics Inc, Honda Motor Company Limited, Alphabet Inc *List Not Exhaustive, Northrop Grumman Corp, iRobot Corporation, Kuka AG, Omron Adept Technologies Inc, Yaskawa Electric Corporation.
3. What are the main segments of the Commercial Robot Industry?
The market segments include Type of Robot, Application.
4. Can you provide details about the market size?
The market size is estimated to be USD XX Million as of 2022.
5. What are some drivers contributing to market growth?
Technological Advancements and Convergence of Robotics and Artificial Intelligence; Increasing Government Spending on Defense.
6. What are the notable trends driving market growth?
Drones in Military and Defense to Present Significant Opportunities for the Commercial Robotics Market.
7. Are there any restraints impacting market growth?
Higher Costs of the Robotic Systems.
8. Can you provide examples of recent developments in the market?
July 2022 - Ganymed Robotics announced that the company had received funding of EUR 21 million in the series B funding round to complete the development of its next-generation surgical robot and prepare for a commercial launch.
9. What pricing options are available for accessing the report?
Pricing options include single-user, multi-user, and enterprise licenses priced at USD 4750, USD 5250, and USD 8750 respectively.
10. Is the market size provided in terms of value or volume?
The market size is provided in terms of value, measured in Million.
11. Are there any specific market keywords associated with the report?
Yes, the market keyword associated with the report is "Commercial Robot Industry," which aids in identifying and referencing the specific market segment covered.
12. How do I determine which pricing option suits my needs best?
The pricing options vary based on user requirements and access needs. Individual users may opt for single-user licenses, while businesses requiring broader access may choose multi-user or enterprise licenses for cost-effective access to the report.
13. Are there any additional resources or data provided in the Commercial Robot Industry report?
While the report offers comprehensive insights, it's advisable to review the specific contents or supplementary materials provided to ascertain if additional resources or data are available.
14. How can I stay updated on further developments or reports in the Commercial Robot Industry?
To stay informed about further developments, trends, and reports in the Commercial Robot Industry, consider subscribing to industry newsletters, following relevant companies and organizations, or regularly checking reputable industry news sources and publications.
Methodology
Step 1 - Identification of Relevant Samples Size from Population Database


Step 2 - Approaches for Defining Global Market Size (Value, Volume* & Price*)

Note*: In applicable scenarios
Step 3 - Data Sources
Primary Research
- Web Analytics
- Survey Reports
- Research Institute
- Latest Research Reports
- Opinion Leaders
Secondary Research
- Annual Reports
- White Paper
- Latest Press Release
- Industry Association
- Paid Database
- Investor Presentations

Step 4 - Data Triangulation
Involves using different sources of information in order to increase the validity of a study
These sources are likely to be stakeholders in a program - participants, other researchers, program staff, other community members, and so on.
Then we put all data in single framework & apply various statistical tools to find out the dynamic on the market.
During the analysis stage, feedback from the stakeholder groups would be compared to determine areas of agreement as well as areas of divergence
