

Key Insights
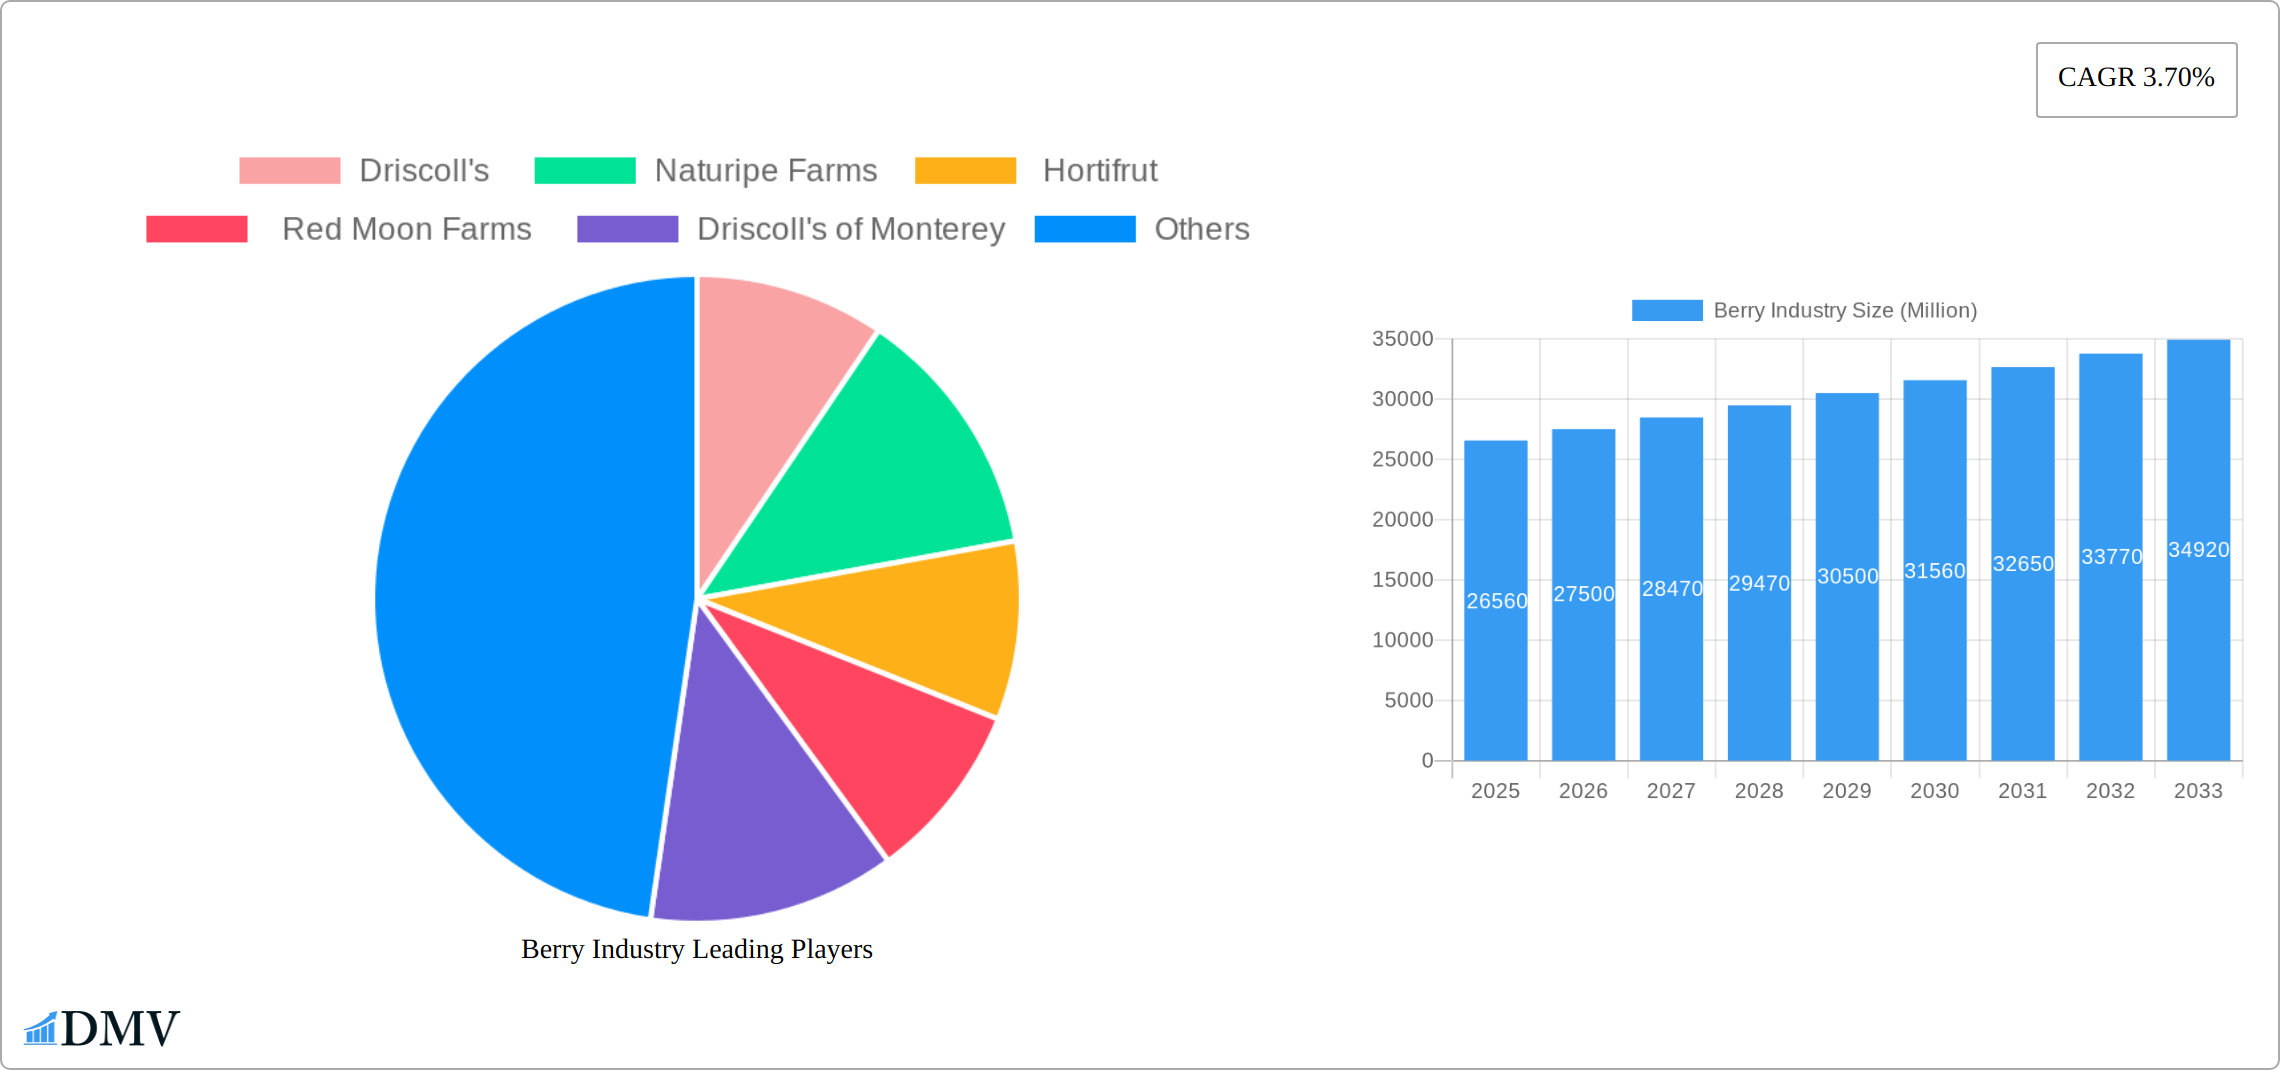
The global berry industry, valued at $26.56 billion in 2025, is projected to experience robust growth, driven by increasing consumer demand for healthy and convenient food options. The market's Compound Annual Growth Rate (CAGR) of 3.70% from 2025 to 2033 indicates a significant expansion over the forecast period. This growth is fueled by several key factors. Firstly, the rising awareness of berries' nutritional benefits, rich in antioxidants and vitamins, is driving consumption across various demographics. Secondly, the increasing incorporation of berries into diverse food and beverage products, from smoothies and yogurts to baked goods and confectionery, fuels market expansion. Furthermore, the growing popularity of convenient, ready-to-eat berry products, such as frozen and processed berries, caters to busy lifestyles and boosts market demand. The food and beverage industry remains the largest application segment, while the retail sector contributes significantly through fresh berry sales in supermarkets and specialty stores. The healthcare sector also shows growing interest in berries due to their functional properties, used in dietary supplements and therapeutic foods. Geographic expansion, particularly in emerging markets with rising disposable incomes, further contributes to the market's growth trajectory.
However, challenges exist. Seasonal variations in berry production can lead to supply chain disruptions and price fluctuations. Furthermore, maintaining the freshness and quality of berries throughout the supply chain is crucial, necessitating investment in advanced preservation and transportation technologies. Competition among numerous players, including both large multinational corporations and smaller regional producers, also presents a dynamic market landscape. Nevertheless, the industry's favorable growth prospects driven by consumer health consciousness and product innovation are likely to outweigh these challenges, leading to consistent market expansion over the coming years. Specific regional growth will vary, with North America and Europe expected to maintain significant market shares due to established consumption patterns, but regions like Asia-Pacific are poised for substantial growth driven by increasing incomes and changing dietary habits.
Berry Industry Market Report: 2019-2033
This comprehensive report provides an in-depth analysis of the global berry industry, projecting a market value exceeding $XX Million by 2033. We delve into market composition, key players, innovative trends, and future growth potential, equipping stakeholders with crucial insights for strategic decision-making. The study period spans 2019-2033, with 2025 serving as the base and estimated year. The forecast period covers 2025-2033, and the historical period encompasses 2019-2024.
Berry Industry Market Composition & Trends
The $XX million berry market presents a dynamic landscape shaped by competitive pressures, innovative advancements, regulatory frameworks, substitute products, diverse end-users, and strategic mergers and acquisitions (M&A). This analysis delves into the market share distribution among key players, including Driscoll's, Naturipe Farms, Hortifrut, Red Moon Farms, and Driscoll's of Monterey, revealing a moderately concentrated market with the top five companies holding an estimated xx% market share in 2025. We examine the forces driving growth and the challenges impacting stability within this vibrant sector.
- Market Concentration and Competition: The fresh berry segment exhibits high concentration, while frozen and processed berry markets witness escalating competition, driving innovation and efficiency improvements.
- Innovation Drivers: The industry thrives on developing higher-yielding, disease-resistant berry varieties, alongside a growing emphasis on organic and sustainably sourced production methods. Technological advancements in cultivation and processing are key contributors to efficiency gains and improved product quality.
- Regulatory Landscape and Sustainability: Stringent food safety regulations and a rising demand for traceability and sustainability certifications significantly influence market dynamics, pushing companies towards more transparent and eco-friendly practices.
- Substitute Products and Market Segmentation: Other fruits and fruit-based products represent indirect competition, particularly within the processed berry segment. Understanding end-user preferences across diverse segments – including food and beverage manufacturers, retailers, and the healthcare sector – is crucial for effective market positioning.
- Mergers & Acquisitions (M&A) Activity: Analysis of significant M&A deals reveals a total deal value exceeding $XX million. These strategic activities frequently aim to expand market access, diversify product portfolios, and enhance supply chain resilience.
Berry Industry Evolution
This section examines the market’s growth trajectory, technological advancements, and evolving consumer preferences. The global berry market demonstrated robust growth between 2019 and 2024, exhibiting a Compound Annual Growth Rate (CAGR) of xx%. This growth is anticipated to continue, with a projected CAGR of xx% from 2025 to 2033, driven by increasing health consciousness, rising disposable incomes, and product diversification. Technological advancements like precision agriculture and improved processing techniques contribute to higher yields and product quality. Consumer demand shifts towards convenient, healthy, and premium berry products are influencing product development and marketing strategies.
Leading Regions, Countries, or Segments in Berry Industry
This section identifies the leading geographical regions and product segments within the berry market. North America currently holds a significant market share, driven by high consumption and robust production capabilities. However, regions such as Europe and Asia-Pacific are demonstrating significant growth potential.
- Type: Fresh berries dominate the market, accounting for xx% of total revenue in 2025, followed by frozen berries and processed products.
- Application: The food and beverage industry is the largest consumer, representing xx% of overall demand, with retail and healthcare showing steady growth.
- Key Drivers (North America): High per capita consumption, established supply chains, and strong consumer preference for fresh berries.
- Key Drivers (Europe): Growing demand for organic and sustainably sourced berries and increasing adoption of convenient berry-based products.
- Key Drivers (Asia-Pacific): Rapid economic growth, increasing urbanization, and changing dietary preferences fueling market expansion.
Berry Industry Product Innovations
Recent product innovations in the berry industry include the launch of premium berry lines such as Naturipe Farms' "Sweet Selections" and Driscoll's "Tropical Bliss." These lines showcase superior flavor profiles and innovative packaging solutions, reflecting the ongoing efforts by major players to meet evolving consumer demands for high-quality and convenient products. These innovations utilize advanced breeding techniques and optimized processing methods to enhance taste, shelf life, and nutritional value.
Propelling Factors for Berry Industry Growth
The projected growth of the berry industry is fueled by a confluence of factors. Technological advancements in cultivation and processing techniques continue to enhance efficiency and product quality. Economic factors, such as rising disposable incomes in developing economies, contribute to increased consumer demand. Supportive regulatory policies promoting food safety and sustainable practices further stimulate industry expansion. The burgeoning health and wellness market is a major driver, with consumers increasingly incorporating berries into their diets for their nutritional benefits.
Obstacles in the Berry Industry Market
Despite its growth trajectory, the berry industry faces significant challenges. Fluctuating weather patterns pose a considerable threat to yields, while rising input costs (labor, land, packaging, etc.) squeeze profit margins. Supply chain disruptions can lead to price volatility and shortages. Stringent regulatory compliance requirements, particularly for smaller players, can be a substantial hurdle. Finally, intense competition among established players and the emergence of new entrants create uncertainty in pricing and production stability.
Future Opportunities in Berry Industry
Future opportunities lie in tapping into emerging markets, particularly in Asia-Pacific, with tailored product offerings. Further innovation in processing technologies, such as freeze-drying and novel preservation methods, will improve product quality and extend shelf life. Exploiting emerging consumer trends, such as the growing demand for functional foods and customized berry products, will offer significant growth prospects.
Major Players in the Berry Industry Ecosystem
- Driscoll's
- Naturipe Farms
- Hortifrut
- Red Moon Farms
- Driscoll's of Monterey
Key Developments in Berry Industry
- May 2022: Driscoll's launched Tropical Bliss, a new premium strawberry line, highlighting innovation in product offerings.
- October 2023: Naturipe Farms introduced the "Sweet Selections" premium berries line, demonstrating a focus on high-quality products.
- [Add more recent key developments here with dates and brief descriptions]
Strategic Berry Industry Market Forecast
The berry industry is poised for significant growth driven by consumer preference for healthy foods and the continuous innovation in cultivation and processing techniques. The forecast indicates strong expansion in key geographical regions and application segments, presenting substantial opportunities for industry players to capitalize on. Meeting increasing demand through sustainable and efficient practices will be crucial for sustained market success.
Berry Industry Segmentation
- 1. Production Analysis
- 2. Consumption Analysis
- 3. Import Market Analysis (Value & Volume)
- 4. Export Market Analysis (Value & Volume)
- 5. Price Trend Analysis
Berry Industry Segmentation By Geography
-
1. North America
- 1.1. United States
- 1.2. Canada
-
2. Europe
- 2.1. Germany
- 2.2. United Kingdom
- 2.3. France
- 2.4. Spain
- 2.5. Netherlands
- 2.6. Poland
-
3. Asia Pacific
- 3.1. China
- 3.2. Australia
- 3.3. India
- 3.4. Japan
-
4. South America
- 4.1. Brazil
- 4.2. Argentina
-
5. Africa
- 5.1. South Africa
- 5.2. Egypt

Berry Industry REPORT HIGHLIGHTS
| Aspects | Details |
|---|---|
| Study Period | 2019-2033 |
| Base Year | 2024 |
| Estimated Year | 2025 |
| Forecast Period | 2025-2033 |
| Historical Period | 2019-2024 |
| Growth Rate | CAGR of 3.70% from 2019-2033 |
| Segmentation |
|
Table of Contents
- 1. Introduction
- 1.1. Research Scope
- 1.2. Market Segmentation
- 1.3. Research Methodology
- 1.4. Definitions and Assumptions
- 2. Executive Summary
- 2.1. Introduction
- 3. Market Dynamics
- 3.1. Introduction
- 3.2. Market Drivers
- 3.2.1. Increasing Berry Consumption for Health Benefits; Increasing Adoption of High-Technology Farm Practices; Growing Usage of Berries in the Food and Beverage Industries
- 3.3. Market Restrains
- 3.3.1. High Production Cost Involved in Berry Production; Increasing Disease and Pest Infestations
- 3.4. Market Trends
- 3.4.1. Increasing Export of Berries from United States is Driving the Market
- 4. Market Factor Analysis
- 4.1. Porters Five Forces
- 4.2. Supply/Value Chain
- 4.3. PESTEL analysis
- 4.4. Market Entropy
- 4.5. Patent/Trademark Analysis
- 5. Global Berry Industry Analysis, Insights and Forecast, 2019-2031
- 5.1. Market Analysis, Insights and Forecast - by Production Analysis
- 5.2. Market Analysis, Insights and Forecast - by Consumption Analysis
- 5.3. Market Analysis, Insights and Forecast - by Import Market Analysis (Value & Volume)
- 5.4. Market Analysis, Insights and Forecast - by Export Market Analysis (Value & Volume)
- 5.5. Market Analysis, Insights and Forecast - by Price Trend Analysis
- 5.6. Market Analysis, Insights and Forecast - by Region
- 5.6.1. North America
- 5.6.2. Europe
- 5.6.3. Asia Pacific
- 5.6.4. South America
- 5.6.5. Africa
- 5.1. Market Analysis, Insights and Forecast - by Production Analysis
- 6. North America Berry Industry Analysis, Insights and Forecast, 2019-2031
- 6.1. Market Analysis, Insights and Forecast - by Production Analysis
- 6.2. Market Analysis, Insights and Forecast - by Consumption Analysis
- 6.3. Market Analysis, Insights and Forecast - by Import Market Analysis (Value & Volume)
- 6.4. Market Analysis, Insights and Forecast - by Export Market Analysis (Value & Volume)
- 6.5. Market Analysis, Insights and Forecast - by Price Trend Analysis
- 6.1. Market Analysis, Insights and Forecast - by Production Analysis
- 7. Europe Berry Industry Analysis, Insights and Forecast, 2019-2031
- 7.1. Market Analysis, Insights and Forecast - by Production Analysis
- 7.2. Market Analysis, Insights and Forecast - by Consumption Analysis
- 7.3. Market Analysis, Insights and Forecast - by Import Market Analysis (Value & Volume)
- 7.4. Market Analysis, Insights and Forecast - by Export Market Analysis (Value & Volume)
- 7.5. Market Analysis, Insights and Forecast - by Price Trend Analysis
- 7.1. Market Analysis, Insights and Forecast - by Production Analysis
- 8. Asia Pacific Berry Industry Analysis, Insights and Forecast, 2019-2031
- 8.1. Market Analysis, Insights and Forecast - by Production Analysis
- 8.2. Market Analysis, Insights and Forecast - by Consumption Analysis
- 8.3. Market Analysis, Insights and Forecast - by Import Market Analysis (Value & Volume)
- 8.4. Market Analysis, Insights and Forecast - by Export Market Analysis (Value & Volume)
- 8.5. Market Analysis, Insights and Forecast - by Price Trend Analysis
- 8.1. Market Analysis, Insights and Forecast - by Production Analysis
- 9. South America Berry Industry Analysis, Insights and Forecast, 2019-2031
- 9.1. Market Analysis, Insights and Forecast - by Production Analysis
- 9.2. Market Analysis, Insights and Forecast - by Consumption Analysis
- 9.3. Market Analysis, Insights and Forecast - by Import Market Analysis (Value & Volume)
- 9.4. Market Analysis, Insights and Forecast - by Export Market Analysis (Value & Volume)
- 9.5. Market Analysis, Insights and Forecast - by Price Trend Analysis
- 9.1. Market Analysis, Insights and Forecast - by Production Analysis
- 10. Africa Berry Industry Analysis, Insights and Forecast, 2019-2031
- 10.1. Market Analysis, Insights and Forecast - by Production Analysis
- 10.2. Market Analysis, Insights and Forecast - by Consumption Analysis
- 10.3. Market Analysis, Insights and Forecast - by Import Market Analysis (Value & Volume)
- 10.4. Market Analysis, Insights and Forecast - by Export Market Analysis (Value & Volume)
- 10.5. Market Analysis, Insights and Forecast - by Price Trend Analysis
- 10.1. Market Analysis, Insights and Forecast - by Production Analysis
- 11. North America Berry Industry Analysis, Insights and Forecast, 2019-2031
- 11.1. Market Analysis, Insights and Forecast - By Country/Sub-region
- 11.1.1 United States
- 11.1.2 Canada
- 11.1.3 Mexico
- 12. Europe Berry Industry Analysis, Insights and Forecast, 2019-2031
- 12.1. Market Analysis, Insights and Forecast - By Country/Sub-region
- 12.1.1 Germany
- 12.1.2 United Kingdom
- 12.1.3 France
- 12.1.4 Spain
- 12.1.5 Italy
- 12.1.6 Spain
- 12.1.7 Belgium
- 12.1.8 Netherland
- 12.1.9 Nordics
- 12.1.10 Rest of Europe
- 13. Asia Pacific Berry Industry Analysis, Insights and Forecast, 2019-2031
- 13.1. Market Analysis, Insights and Forecast - By Country/Sub-region
- 13.1.1 China
- 13.1.2 Japan
- 13.1.3 India
- 13.1.4 South Korea
- 13.1.5 Southeast Asia
- 13.1.6 Australia
- 13.1.7 Indonesia
- 13.1.8 Phillipes
- 13.1.9 Singapore
- 13.1.10 Thailandc
- 13.1.11 Rest of Asia Pacific
- 14. South America Berry Industry Analysis, Insights and Forecast, 2019-2031
- 14.1. Market Analysis, Insights and Forecast - By Country/Sub-region
- 14.1.1 Brazil
- 14.1.2 Argentina
- 14.1.3 Peru
- 14.1.4 Chile
- 14.1.5 Colombia
- 14.1.6 Ecuador
- 14.1.7 Venezuela
- 14.1.8 Rest of South America
- 15. MEA Berry Industry Analysis, Insights and Forecast, 2019-2031
- 15.1. Market Analysis, Insights and Forecast - By Country/Sub-region
- 15.1.1 United Arab Emirates
- 15.1.2 Saudi Arabia
- 15.1.3 South Africa
- 15.1.4 Rest of Middle East and Africa
- 16. Competitive Analysis
- 16.1. Global Market Share Analysis 2024
- 16.2. Company Profiles
- 16.2.1 Driscoll's
- 16.2.1.1. Overview
- 16.2.1.2. Products
- 16.2.1.3. SWOT Analysis
- 16.2.1.4. Recent Developments
- 16.2.1.5. Financials (Based on Availability)
- 16.2.2 Naturipe Farms
- 16.2.2.1. Overview
- 16.2.2.2. Products
- 16.2.2.3. SWOT Analysis
- 16.2.2.4. Recent Developments
- 16.2.2.5. Financials (Based on Availability)
- 16.2.3 Hortifrut
- 16.2.3.1. Overview
- 16.2.3.2. Products
- 16.2.3.3. SWOT Analysis
- 16.2.3.4. Recent Developments
- 16.2.3.5. Financials (Based on Availability)
- 16.2.4 Red Moon Farms
- 16.2.4.1. Overview
- 16.2.4.2. Products
- 16.2.4.3. SWOT Analysis
- 16.2.4.4. Recent Developments
- 16.2.4.5. Financials (Based on Availability)
- 16.2.5 Driscoll's of Monterey
- 16.2.5.1. Overview
- 16.2.5.2. Products
- 16.2.5.3. SWOT Analysis
- 16.2.5.4. Recent Developments
- 16.2.5.5. Financials (Based on Availability)
- 16.2.1 Driscoll's
List of Figures
- Figure 1: Global Berry Industry Revenue Breakdown (Million, %) by Region 2024 & 2032
- Figure 2: North America Berry Industry Revenue (Million), by Country 2024 & 2032
- Figure 3: North America Berry Industry Revenue Share (%), by Country 2024 & 2032
- Figure 4: Europe Berry Industry Revenue (Million), by Country 2024 & 2032
- Figure 5: Europe Berry Industry Revenue Share (%), by Country 2024 & 2032
- Figure 6: Asia Pacific Berry Industry Revenue (Million), by Country 2024 & 2032
- Figure 7: Asia Pacific Berry Industry Revenue Share (%), by Country 2024 & 2032
- Figure 8: South America Berry Industry Revenue (Million), by Country 2024 & 2032
- Figure 9: South America Berry Industry Revenue Share (%), by Country 2024 & 2032
- Figure 10: MEA Berry Industry Revenue (Million), by Country 2024 & 2032
- Figure 11: MEA Berry Industry Revenue Share (%), by Country 2024 & 2032
- Figure 12: North America Berry Industry Revenue (Million), by Production Analysis 2024 & 2032
- Figure 13: North America Berry Industry Revenue Share (%), by Production Analysis 2024 & 2032
- Figure 14: North America Berry Industry Revenue (Million), by Consumption Analysis 2024 & 2032
- Figure 15: North America Berry Industry Revenue Share (%), by Consumption Analysis 2024 & 2032
- Figure 16: North America Berry Industry Revenue (Million), by Import Market Analysis (Value & Volume) 2024 & 2032
- Figure 17: North America Berry Industry Revenue Share (%), by Import Market Analysis (Value & Volume) 2024 & 2032
- Figure 18: North America Berry Industry Revenue (Million), by Export Market Analysis (Value & Volume) 2024 & 2032
- Figure 19: North America Berry Industry Revenue Share (%), by Export Market Analysis (Value & Volume) 2024 & 2032
- Figure 20: North America Berry Industry Revenue (Million), by Price Trend Analysis 2024 & 2032
- Figure 21: North America Berry Industry Revenue Share (%), by Price Trend Analysis 2024 & 2032
- Figure 22: North America Berry Industry Revenue (Million), by Country 2024 & 2032
- Figure 23: North America Berry Industry Revenue Share (%), by Country 2024 & 2032
- Figure 24: Europe Berry Industry Revenue (Million), by Production Analysis 2024 & 2032
- Figure 25: Europe Berry Industry Revenue Share (%), by Production Analysis 2024 & 2032
- Figure 26: Europe Berry Industry Revenue (Million), by Consumption Analysis 2024 & 2032
- Figure 27: Europe Berry Industry Revenue Share (%), by Consumption Analysis 2024 & 2032
- Figure 28: Europe Berry Industry Revenue (Million), by Import Market Analysis (Value & Volume) 2024 & 2032
- Figure 29: Europe Berry Industry Revenue Share (%), by Import Market Analysis (Value & Volume) 2024 & 2032
- Figure 30: Europe Berry Industry Revenue (Million), by Export Market Analysis (Value & Volume) 2024 & 2032
- Figure 31: Europe Berry Industry Revenue Share (%), by Export Market Analysis (Value & Volume) 2024 & 2032
- Figure 32: Europe Berry Industry Revenue (Million), by Price Trend Analysis 2024 & 2032
- Figure 33: Europe Berry Industry Revenue Share (%), by Price Trend Analysis 2024 & 2032
- Figure 34: Europe Berry Industry Revenue (Million), by Country 2024 & 2032
- Figure 35: Europe Berry Industry Revenue Share (%), by Country 2024 & 2032
- Figure 36: Asia Pacific Berry Industry Revenue (Million), by Production Analysis 2024 & 2032
- Figure 37: Asia Pacific Berry Industry Revenue Share (%), by Production Analysis 2024 & 2032
- Figure 38: Asia Pacific Berry Industry Revenue (Million), by Consumption Analysis 2024 & 2032
- Figure 39: Asia Pacific Berry Industry Revenue Share (%), by Consumption Analysis 2024 & 2032
- Figure 40: Asia Pacific Berry Industry Revenue (Million), by Import Market Analysis (Value & Volume) 2024 & 2032
- Figure 41: Asia Pacific Berry Industry Revenue Share (%), by Import Market Analysis (Value & Volume) 2024 & 2032
- Figure 42: Asia Pacific Berry Industry Revenue (Million), by Export Market Analysis (Value & Volume) 2024 & 2032
- Figure 43: Asia Pacific Berry Industry Revenue Share (%), by Export Market Analysis (Value & Volume) 2024 & 2032
- Figure 44: Asia Pacific Berry Industry Revenue (Million), by Price Trend Analysis 2024 & 2032
- Figure 45: Asia Pacific Berry Industry Revenue Share (%), by Price Trend Analysis 2024 & 2032
- Figure 46: Asia Pacific Berry Industry Revenue (Million), by Country 2024 & 2032
- Figure 47: Asia Pacific Berry Industry Revenue Share (%), by Country 2024 & 2032
- Figure 48: South America Berry Industry Revenue (Million), by Production Analysis 2024 & 2032
- Figure 49: South America Berry Industry Revenue Share (%), by Production Analysis 2024 & 2032
- Figure 50: South America Berry Industry Revenue (Million), by Consumption Analysis 2024 & 2032
- Figure 51: South America Berry Industry Revenue Share (%), by Consumption Analysis 2024 & 2032
- Figure 52: South America Berry Industry Revenue (Million), by Import Market Analysis (Value & Volume) 2024 & 2032
- Figure 53: South America Berry Industry Revenue Share (%), by Import Market Analysis (Value & Volume) 2024 & 2032
- Figure 54: South America Berry Industry Revenue (Million), by Export Market Analysis (Value & Volume) 2024 & 2032
- Figure 55: South America Berry Industry Revenue Share (%), by Export Market Analysis (Value & Volume) 2024 & 2032
- Figure 56: South America Berry Industry Revenue (Million), by Price Trend Analysis 2024 & 2032
- Figure 57: South America Berry Industry Revenue Share (%), by Price Trend Analysis 2024 & 2032
- Figure 58: South America Berry Industry Revenue (Million), by Country 2024 & 2032
- Figure 59: South America Berry Industry Revenue Share (%), by Country 2024 & 2032
- Figure 60: Africa Berry Industry Revenue (Million), by Production Analysis 2024 & 2032
- Figure 61: Africa Berry Industry Revenue Share (%), by Production Analysis 2024 & 2032
- Figure 62: Africa Berry Industry Revenue (Million), by Consumption Analysis 2024 & 2032
- Figure 63: Africa Berry Industry Revenue Share (%), by Consumption Analysis 2024 & 2032
- Figure 64: Africa Berry Industry Revenue (Million), by Import Market Analysis (Value & Volume) 2024 & 2032
- Figure 65: Africa Berry Industry Revenue Share (%), by Import Market Analysis (Value & Volume) 2024 & 2032
- Figure 66: Africa Berry Industry Revenue (Million), by Export Market Analysis (Value & Volume) 2024 & 2032
- Figure 67: Africa Berry Industry Revenue Share (%), by Export Market Analysis (Value & Volume) 2024 & 2032
- Figure 68: Africa Berry Industry Revenue (Million), by Price Trend Analysis 2024 & 2032
- Figure 69: Africa Berry Industry Revenue Share (%), by Price Trend Analysis 2024 & 2032
- Figure 70: Africa Berry Industry Revenue (Million), by Country 2024 & 2032
- Figure 71: Africa Berry Industry Revenue Share (%), by Country 2024 & 2032
List of Tables
- Table 1: Global Berry Industry Revenue Million Forecast, by Region 2019 & 2032
- Table 2: Global Berry Industry Revenue Million Forecast, by Production Analysis 2019 & 2032
- Table 3: Global Berry Industry Revenue Million Forecast, by Consumption Analysis 2019 & 2032
- Table 4: Global Berry Industry Revenue Million Forecast, by Import Market Analysis (Value & Volume) 2019 & 2032
- Table 5: Global Berry Industry Revenue Million Forecast, by Export Market Analysis (Value & Volume) 2019 & 2032
- Table 6: Global Berry Industry Revenue Million Forecast, by Price Trend Analysis 2019 & 2032
- Table 7: Global Berry Industry Revenue Million Forecast, by Region 2019 & 2032
- Table 8: Global Berry Industry Revenue Million Forecast, by Country 2019 & 2032
- Table 9: United States Berry Industry Revenue (Million) Forecast, by Application 2019 & 2032
- Table 10: Canada Berry Industry Revenue (Million) Forecast, by Application 2019 & 2032
- Table 11: Mexico Berry Industry Revenue (Million) Forecast, by Application 2019 & 2032
- Table 12: Global Berry Industry Revenue Million Forecast, by Country 2019 & 2032
- Table 13: Germany Berry Industry Revenue (Million) Forecast, by Application 2019 & 2032
- Table 14: United Kingdom Berry Industry Revenue (Million) Forecast, by Application 2019 & 2032
- Table 15: France Berry Industry Revenue (Million) Forecast, by Application 2019 & 2032
- Table 16: Spain Berry Industry Revenue (Million) Forecast, by Application 2019 & 2032
- Table 17: Italy Berry Industry Revenue (Million) Forecast, by Application 2019 & 2032
- Table 18: Spain Berry Industry Revenue (Million) Forecast, by Application 2019 & 2032
- Table 19: Belgium Berry Industry Revenue (Million) Forecast, by Application 2019 & 2032
- Table 20: Netherland Berry Industry Revenue (Million) Forecast, by Application 2019 & 2032
- Table 21: Nordics Berry Industry Revenue (Million) Forecast, by Application 2019 & 2032
- Table 22: Rest of Europe Berry Industry Revenue (Million) Forecast, by Application 2019 & 2032
- Table 23: Global Berry Industry Revenue Million Forecast, by Country 2019 & 2032
- Table 24: China Berry Industry Revenue (Million) Forecast, by Application 2019 & 2032
- Table 25: Japan Berry Industry Revenue (Million) Forecast, by Application 2019 & 2032
- Table 26: India Berry Industry Revenue (Million) Forecast, by Application 2019 & 2032
- Table 27: South Korea Berry Industry Revenue (Million) Forecast, by Application 2019 & 2032
- Table 28: Southeast Asia Berry Industry Revenue (Million) Forecast, by Application 2019 & 2032
- Table 29: Australia Berry Industry Revenue (Million) Forecast, by Application 2019 & 2032
- Table 30: Indonesia Berry Industry Revenue (Million) Forecast, by Application 2019 & 2032
- Table 31: Phillipes Berry Industry Revenue (Million) Forecast, by Application 2019 & 2032
- Table 32: Singapore Berry Industry Revenue (Million) Forecast, by Application 2019 & 2032
- Table 33: Thailandc Berry Industry Revenue (Million) Forecast, by Application 2019 & 2032
- Table 34: Rest of Asia Pacific Berry Industry Revenue (Million) Forecast, by Application 2019 & 2032
- Table 35: Global Berry Industry Revenue Million Forecast, by Country 2019 & 2032
- Table 36: Brazil Berry Industry Revenue (Million) Forecast, by Application 2019 & 2032
- Table 37: Argentina Berry Industry Revenue (Million) Forecast, by Application 2019 & 2032
- Table 38: Peru Berry Industry Revenue (Million) Forecast, by Application 2019 & 2032
- Table 39: Chile Berry Industry Revenue (Million) Forecast, by Application 2019 & 2032
- Table 40: Colombia Berry Industry Revenue (Million) Forecast, by Application 2019 & 2032
- Table 41: Ecuador Berry Industry Revenue (Million) Forecast, by Application 2019 & 2032
- Table 42: Venezuela Berry Industry Revenue (Million) Forecast, by Application 2019 & 2032
- Table 43: Rest of South America Berry Industry Revenue (Million) Forecast, by Application 2019 & 2032
- Table 44: Global Berry Industry Revenue Million Forecast, by Country 2019 & 2032
- Table 45: United Arab Emirates Berry Industry Revenue (Million) Forecast, by Application 2019 & 2032
- Table 46: Saudi Arabia Berry Industry Revenue (Million) Forecast, by Application 2019 & 2032
- Table 47: South Africa Berry Industry Revenue (Million) Forecast, by Application 2019 & 2032
- Table 48: Rest of Middle East and Africa Berry Industry Revenue (Million) Forecast, by Application 2019 & 2032
- Table 49: Global Berry Industry Revenue Million Forecast, by Production Analysis 2019 & 2032
- Table 50: Global Berry Industry Revenue Million Forecast, by Consumption Analysis 2019 & 2032
- Table 51: Global Berry Industry Revenue Million Forecast, by Import Market Analysis (Value & Volume) 2019 & 2032
- Table 52: Global Berry Industry Revenue Million Forecast, by Export Market Analysis (Value & Volume) 2019 & 2032
- Table 53: Global Berry Industry Revenue Million Forecast, by Price Trend Analysis 2019 & 2032
- Table 54: Global Berry Industry Revenue Million Forecast, by Country 2019 & 2032
- Table 55: United States Berry Industry Revenue (Million) Forecast, by Application 2019 & 2032
- Table 56: Canada Berry Industry Revenue (Million) Forecast, by Application 2019 & 2032
- Table 57: Global Berry Industry Revenue Million Forecast, by Production Analysis 2019 & 2032
- Table 58: Global Berry Industry Revenue Million Forecast, by Consumption Analysis 2019 & 2032
- Table 59: Global Berry Industry Revenue Million Forecast, by Import Market Analysis (Value & Volume) 2019 & 2032
- Table 60: Global Berry Industry Revenue Million Forecast, by Export Market Analysis (Value & Volume) 2019 & 2032
- Table 61: Global Berry Industry Revenue Million Forecast, by Price Trend Analysis 2019 & 2032
- Table 62: Global Berry Industry Revenue Million Forecast, by Country 2019 & 2032
- Table 63: Germany Berry Industry Revenue (Million) Forecast, by Application 2019 & 2032
- Table 64: United Kingdom Berry Industry Revenue (Million) Forecast, by Application 2019 & 2032
- Table 65: France Berry Industry Revenue (Million) Forecast, by Application 2019 & 2032
- Table 66: Spain Berry Industry Revenue (Million) Forecast, by Application 2019 & 2032
- Table 67: Netherlands Berry Industry Revenue (Million) Forecast, by Application 2019 & 2032
- Table 68: Poland Berry Industry Revenue (Million) Forecast, by Application 2019 & 2032
- Table 69: Global Berry Industry Revenue Million Forecast, by Production Analysis 2019 & 2032
- Table 70: Global Berry Industry Revenue Million Forecast, by Consumption Analysis 2019 & 2032
- Table 71: Global Berry Industry Revenue Million Forecast, by Import Market Analysis (Value & Volume) 2019 & 2032
- Table 72: Global Berry Industry Revenue Million Forecast, by Export Market Analysis (Value & Volume) 2019 & 2032
- Table 73: Global Berry Industry Revenue Million Forecast, by Price Trend Analysis 2019 & 2032
- Table 74: Global Berry Industry Revenue Million Forecast, by Country 2019 & 2032
- Table 75: China Berry Industry Revenue (Million) Forecast, by Application 2019 & 2032
- Table 76: Australia Berry Industry Revenue (Million) Forecast, by Application 2019 & 2032
- Table 77: India Berry Industry Revenue (Million) Forecast, by Application 2019 & 2032
- Table 78: Japan Berry Industry Revenue (Million) Forecast, by Application 2019 & 2032
- Table 79: Global Berry Industry Revenue Million Forecast, by Production Analysis 2019 & 2032
- Table 80: Global Berry Industry Revenue Million Forecast, by Consumption Analysis 2019 & 2032
- Table 81: Global Berry Industry Revenue Million Forecast, by Import Market Analysis (Value & Volume) 2019 & 2032
- Table 82: Global Berry Industry Revenue Million Forecast, by Export Market Analysis (Value & Volume) 2019 & 2032
- Table 83: Global Berry Industry Revenue Million Forecast, by Price Trend Analysis 2019 & 2032
- Table 84: Global Berry Industry Revenue Million Forecast, by Country 2019 & 2032
- Table 85: Brazil Berry Industry Revenue (Million) Forecast, by Application 2019 & 2032
- Table 86: Argentina Berry Industry Revenue (Million) Forecast, by Application 2019 & 2032
- Table 87: Global Berry Industry Revenue Million Forecast, by Production Analysis 2019 & 2032
- Table 88: Global Berry Industry Revenue Million Forecast, by Consumption Analysis 2019 & 2032
- Table 89: Global Berry Industry Revenue Million Forecast, by Import Market Analysis (Value & Volume) 2019 & 2032
- Table 90: Global Berry Industry Revenue Million Forecast, by Export Market Analysis (Value & Volume) 2019 & 2032
- Table 91: Global Berry Industry Revenue Million Forecast, by Price Trend Analysis 2019 & 2032
- Table 92: Global Berry Industry Revenue Million Forecast, by Country 2019 & 2032
- Table 93: South Africa Berry Industry Revenue (Million) Forecast, by Application 2019 & 2032
- Table 94: Egypt Berry Industry Revenue (Million) Forecast, by Application 2019 & 2032
Frequently Asked Questions
1. What is the projected Compound Annual Growth Rate (CAGR) of the Berry Industry?
The projected CAGR is approximately 3.70%.
2. Which companies are prominent players in the Berry Industry?
Key companies in the market include Driscoll's , Naturipe Farms , Hortifrut, Red Moon Farms , Driscoll's of Monterey.
3. What are the main segments of the Berry Industry?
The market segments include Production Analysis, Consumption Analysis, Import Market Analysis (Value & Volume), Export Market Analysis (Value & Volume), Price Trend Analysis.
4. Can you provide details about the market size?
The market size is estimated to be USD 26.56 Million as of 2022.
5. What are some drivers contributing to market growth?
Increasing Berry Consumption for Health Benefits; Increasing Adoption of High-Technology Farm Practices; Growing Usage of Berries in the Food and Beverage Industries.
6. What are the notable trends driving market growth?
Increasing Export of Berries from United States is Driving the Market.
7. Are there any restraints impacting market growth?
High Production Cost Involved in Berry Production; Increasing Disease and Pest Infestations.
8. Can you provide examples of recent developments in the market?
October 2023: Naturipe Farms has launched the “Sweet Selections” premium berries line. The Sweet Selections line featured Naturipe’s proprietary berry varieties that were meticulously bred and selected for high flavor and overall eating experience.
9. What pricing options are available for accessing the report?
Pricing options include single-user, multi-user, and enterprise licenses priced at USD 4750, USD 5250, and USD 8750 respectively.
10. Is the market size provided in terms of value or volume?
The market size is provided in terms of value, measured in Million.
11. Are there any specific market keywords associated with the report?
Yes, the market keyword associated with the report is "Berry Industry," which aids in identifying and referencing the specific market segment covered.
12. How do I determine which pricing option suits my needs best?
The pricing options vary based on user requirements and access needs. Individual users may opt for single-user licenses, while businesses requiring broader access may choose multi-user or enterprise licenses for cost-effective access to the report.
13. Are there any additional resources or data provided in the Berry Industry report?
While the report offers comprehensive insights, it's advisable to review the specific contents or supplementary materials provided to ascertain if additional resources or data are available.
14. How can I stay updated on further developments or reports in the Berry Industry?
To stay informed about further developments, trends, and reports in the Berry Industry, consider subscribing to industry newsletters, following relevant companies and organizations, or regularly checking reputable industry news sources and publications.
Methodology
Step 1 - Identification of Relevant Samples Size from Population Database


Step 2 - Approaches for Defining Global Market Size (Value, Volume* & Price*)

Note*: In applicable scenarios
Step 3 - Data Sources
Primary Research
- Web Analytics
- Survey Reports
- Research Institute
- Latest Research Reports
- Opinion Leaders
Secondary Research
- Annual Reports
- White Paper
- Latest Press Release
- Industry Association
- Paid Database
- Investor Presentations

Step 4 - Data Triangulation
Involves using different sources of information in order to increase the validity of a study
These sources are likely to be stakeholders in a program - participants, other researchers, program staff, other community members, and so on.
Then we put all data in single framework & apply various statistical tools to find out the dynamic on the market.
During the analysis stage, feedback from the stakeholder groups would be compared to determine areas of agreement as well as areas of divergence
