

Key Insights
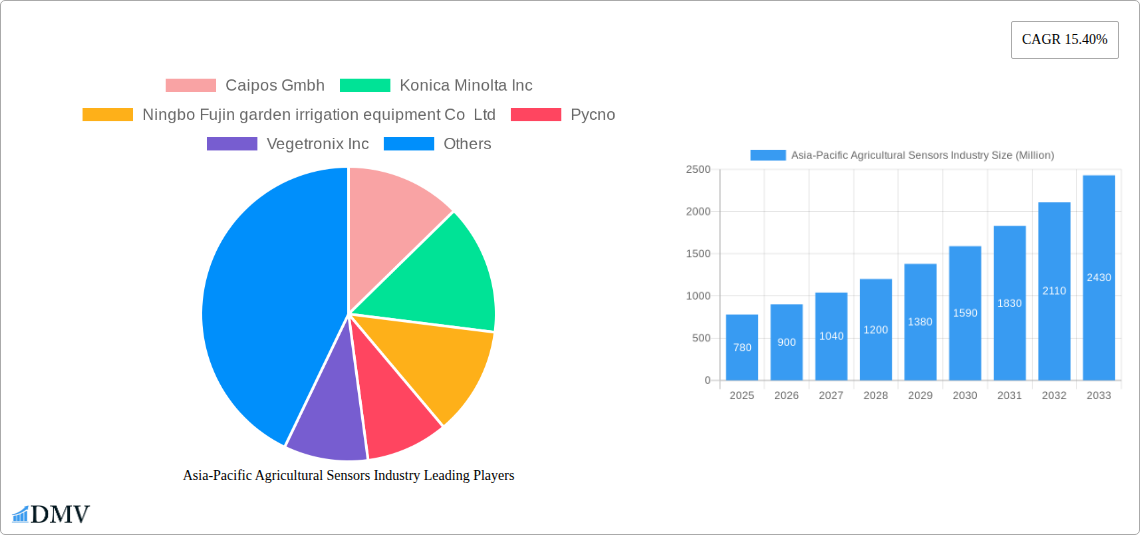
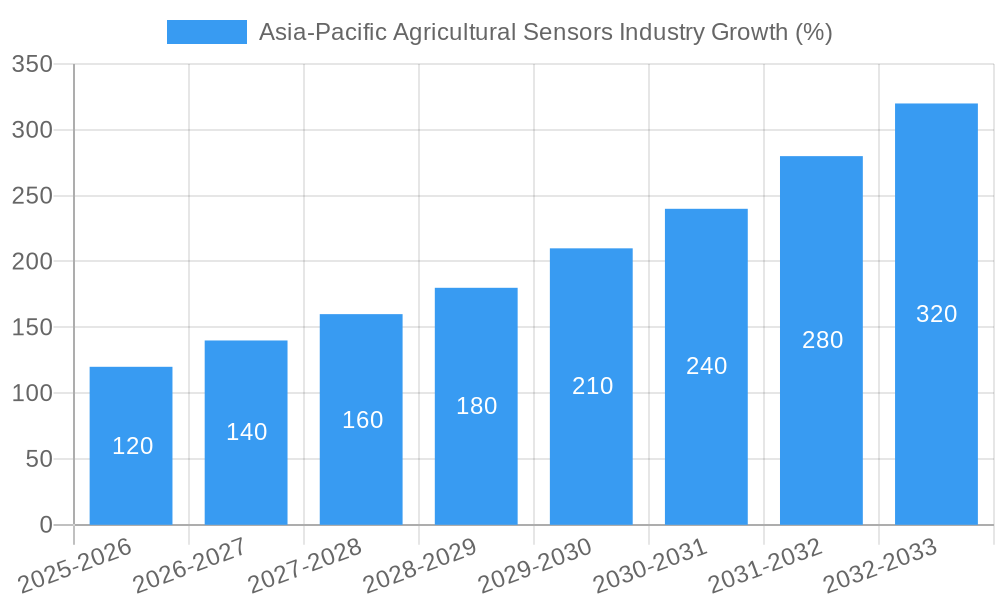
The Asia-Pacific agricultural sensors market, valued at $0.78 billion in 2025, is projected to experience robust growth, driven by a Compound Annual Growth Rate (CAGR) of 15.40% from 2025 to 2033. This expansion is fueled by several key factors. Firstly, the increasing adoption of precision agriculture techniques across the region necessitates advanced sensor technologies for optimized resource management (water, fertilizer, pesticides). Secondly, rising concerns about food security and the need to enhance crop yields are propelling investment in smart farming solutions. Governments across the Asia-Pacific are actively promoting digital agriculture initiatives, further stimulating market growth. Technological advancements, including the development of more cost-effective and energy-efficient sensors, also contribute to the market's positive trajectory. Specific sensor types like pressure sensors (for irrigation management), temperature sensors (for climate control), and location sensors (for precision spraying and harvesting) are witnessing significant demand. Major players like Caipos GmbH, Konica Minolta Inc., and Trimble Inc. are strategically expanding their product portfolios and market presence in the region, reflecting the market's immense potential. While challenges such as high initial investment costs and the need for robust digital infrastructure exist, the long-term benefits of improved efficiency and yield are outweighing these hurdles.
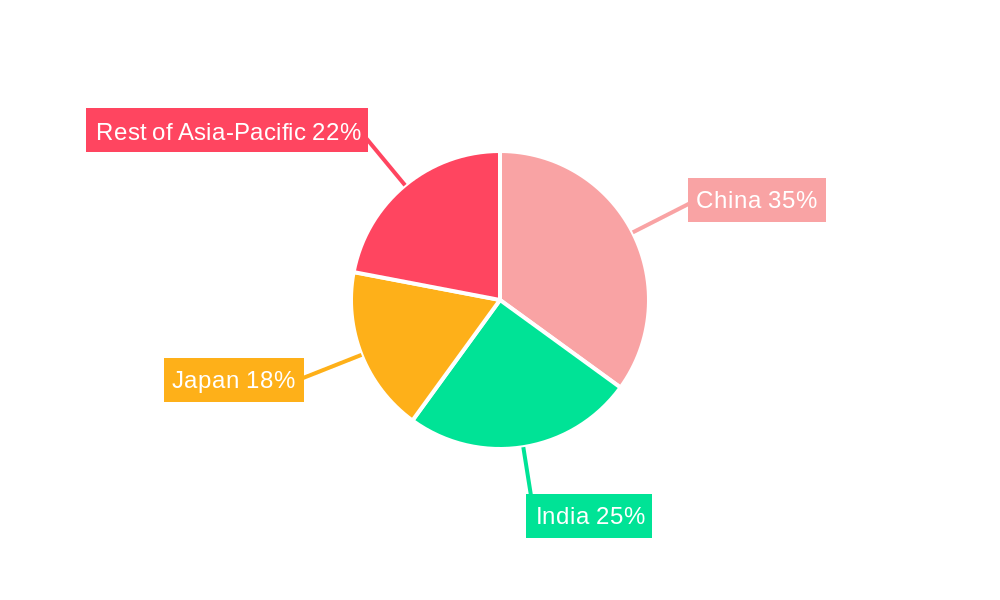
The dominant regional contributors to this growth are China, India, and Japan, reflecting their large agricultural sectors and significant investments in technological advancements. However, other countries in the Asia-Pacific are also witnessing increasing sensor adoption, spurred by government support and the growing awareness of the benefits of precision agriculture among farmers. The market segmentation by sensor type highlights the diverse applications of agricultural sensors, demonstrating the need for a comprehensive suite of solutions for efficient farming practices. The forecast period (2025-2033) anticipates continued strong growth, driven by ongoing technological innovation and increasing adoption across various agricultural segments. This suggests lucrative investment opportunities for businesses involved in the development, manufacturing, and distribution of agricultural sensors in the Asia-Pacific region.
Asia-Pacific Agricultural Sensors Industry Market Report: 2019-2033
This comprehensive report provides an in-depth analysis of the Asia-Pacific agricultural sensors industry, offering valuable insights for stakeholders seeking to navigate this dynamic market. From market sizing and segmentation to technological advancements and future growth projections, this report equips readers with the knowledge needed to make informed business decisions. The study period covers 2019-2033, with a base year of 2025 and a forecast period spanning 2025-2033. The market value is presented in Millions.
Asia-Pacific Agricultural Sensors Industry Market Composition & Trends
This section dissects the competitive landscape of the Asia-Pacific agricultural sensors market, evaluating market concentration, innovation drivers, regulatory frameworks, substitute products, end-user profiles, and mergers & acquisitions (M&A) activity. The report analyzes the market share distribution among key players, including Caipos GmbH, Konica Minolta Inc, Ningbo Fujin garden irrigation equipment Co Ltd, Pycno, Vegetronix Inc, TekBox Digital Solutions Vietnam Co Lt, Libelium Comunicaciones Distribuidas Sl, and Trimble Inc. The analysis includes an assessment of the total market value (estimated at xx Million in 2025) and provides insights into the factors influencing market concentration. M&A activity is evaluated based on the number of deals and their aggregate value (estimated at xx Million during the historical period).
- Market Concentration: A detailed analysis of the Herfindahl-Hirschman Index (HHI) and market share distribution among top players.
- Innovation Catalysts: Identification and assessment of key technological advancements driving market growth.
- Regulatory Landscape: An overview of relevant regulations and their impact on market dynamics in various Asia-Pacific countries.
- Substitute Products: Examination of alternative technologies and their potential impact on market share.
- End-User Profiles: Detailed analysis of the characteristics and needs of different end-user segments (e.g., smallholder farmers, large agricultural corporations).
- M&A Activity: A comprehensive review of significant M&A deals, including their strategic rationale and financial implications.
Asia-Pacific Agricultural Sensors Industry Industry Evolution
This section examines the historical and projected growth trajectories of the Asia-Pacific agricultural sensors market. It analyzes technological advancements such as the integration of IoT (Internet of Things) technologies, AI and machine learning capabilities, and the shift toward precision agriculture. The report delves into evolving consumer demands, including the need for higher accuracy, data-driven decision-making, and increased sustainability. Specific data points on growth rates (e.g., a projected CAGR of xx% during the forecast period) and adoption metrics (e.g., penetration rate of agricultural sensors in different countries) are included. The analysis considers factors influencing market evolution, including technological advancements, shifting farming practices, and government initiatives promoting precision agriculture.
Leading Regions, Countries, or Segments in Asia-Pacific Agricultural Sensors Industry
This section identifies the leading regions, countries, and segments within the Asia-Pacific agricultural sensors market. A detailed analysis of the dominant segment (e.g., temperature sensors, if data indicates this is dominant) is provided, exploring the underlying factors driving its success. This analysis considers all segments: Pressure Sensors, Temperature Sensors, Location Sensors, Optical Sensors, and Other Types.
Key Drivers (Dominant Segment):
- Investment trends in specific technologies and regions
- Government policies and subsidies supporting the adoption of sensors
- Strong growth in specific agricultural sectors (e.g., horticulture or rice cultivation)
- Favorable climatic conditions suitable for sensor deployment
In-depth Analysis: The report provides in-depth analysis of factors contributing to the dominance of the leading segment, considering factors such as market size, growth rate, technological advancements, and regulatory support. The analysis also incorporates geographical factors and their influence on the adoption of specific sensor types.
Asia-Pacific Agricultural Sensors Industry Product Innovations
This section highlights recent product innovations in the Asia-Pacific agricultural sensors market, focusing on features such as improved accuracy, enhanced durability, and wireless connectivity. It also explores emerging applications of agricultural sensors in various farming practices and analyses their performance metrics (e.g., yield improvement rates, resource efficiency gains). The unique selling propositions (USPs) of various sensor technologies are discussed, along with their technological advancements compared to previous generations. Examples of specific innovative sensors and their applications are provided.
Propelling Factors for Asia-Pacific Agricultural Sensors Industry Growth
The robust growth of the Asia-Pacific agricultural sensors market is driven by a confluence of technological, economic, and regulatory factors. Technological advancements, such as the development of more affordable and reliable sensors, play a crucial role. Economic factors like the rising demand for food security and increasing agricultural productivity drive the adoption of technology. Supportive government policies and initiatives promoting precision agriculture further stimulate market growth. Specific examples of these factors and their impact on market growth are provided.
Obstacles in the Asia-Pacific Agricultural Sensors Industry Market
Despite its significant potential, the Asia-Pacific agricultural sensors market faces several challenges. Regulatory hurdles, such as complex certification processes and data privacy concerns, can impede market expansion. Supply chain disruptions can lead to price volatility and impact the availability of sensors. Intense competition among existing players and the emergence of new entrants create competitive pressures. Quantifiable impacts of these obstacles on market growth are highlighted (e.g., estimated reduction in market growth due to supply chain issues).
Future Opportunities in Asia-Pacific Agricultural Sensors Industry
The Asia-Pacific agricultural sensors market is poised for significant growth, driven by emerging opportunities in new markets, technological advancements, and changing consumer trends. The adoption of advanced technologies like AI and machine learning for data analysis offers vast potential. The development of low-cost, user-friendly sensors targeted at smallholder farmers can unlock significant market growth. Government initiatives supporting digital agriculture and precision farming will create further opportunities.
Major Players in the Asia-Pacific Agricultural Sensors Industry Ecosystem
- Caipos GmbH
- Konica Minolta Inc
- Ningbo Fujin garden irrigation equipment Co Ltd
- Pycno
- Vegetronix Inc
- TekBox Digital Solutions Vietnam Co Lt
- Libelium Comunicaciones Distribuidas Sl
- Trimble Inc
Key Developments in Asia-Pacific Agricultural Sensors Industry Industry
- 2022-Q4: Launch of a new high-precision soil moisture sensor by [Company Name] significantly improving yield prediction accuracy.
- 2023-Q1: Strategic partnership between [Company A] and [Company B] leading to the development of an integrated sensor platform for smart farms.
- 2023-Q3: Government of [Country] announces a new subsidy program to promote the adoption of agricultural sensors amongst smallholder farmers.
- (Add more developments as needed, maintaining the year/quarter format)
Strategic Asia-Pacific Agricultural Sensors Industry Market Forecast
The Asia-Pacific agricultural sensors market is projected to experience significant growth over the forecast period, driven by a combination of factors. Continued technological advancements, increasing government support, and rising demand for food security will fuel market expansion. The adoption of precision agriculture practices and increasing integration of IoT devices will drive the market. The report provides a detailed forecast of market growth across different segments and geographical regions, offering insights into market potential and growth catalysts.
Asia-Pacific Agricultural Sensors Industry Segmentation
- 1. Production Analysis
- 2. Consumption Analysis
- 3. Import Market Analysis (Value & Volume)
- 4. Export Market Analysis (Value & Volume)
- 5. Price Trend Analysis
Asia-Pacific Agricultural Sensors Industry Segmentation By Geography
-
1. Asia Pacific
- 1.1. China
- 1.2. Japan
- 1.3. South Korea
- 1.4. India
- 1.5. Australia
- 1.6. New Zealand
- 1.7. Indonesia
- 1.8. Malaysia
- 1.9. Singapore
- 1.10. Thailand
- 1.11. Vietnam
- 1.12. Philippines
Asia-Pacific Agricultural Sensors Industry REPORT HIGHLIGHTS
| Aspects | Details |
|---|---|
| Study Period | 2019-2033 |
| Base Year | 2024 |
| Estimated Year | 2025 |
| Forecast Period | 2025-2033 |
| Historical Period | 2019-2024 |
| Growth Rate | CAGR of 15.40% from 2019-2033 |
| Segmentation |
|
Table of Contents
- 1. Introduction
- 1.1. Research Scope
- 1.2. Market Segmentation
- 1.3. Research Methodology
- 1.4. Definitions and Assumptions
- 2. Executive Summary
- 2.1. Introduction
- 3. Market Dynamics
- 3.1. Introduction
- 3.2. Market Drivers
- 3.2.1. Increasing Legalization of Cannabis; Growing Focus on Health Benefits of Cannabis
- 3.3. Market Restrains
- 3.3.1. Lack of Data on Dosages and Results; Lack of Access to Financial Assistance
- 3.4. Market Trends
- 3.4.1. Increasing Farm Mechanization Rates
- 4. Market Factor Analysis
- 4.1. Porters Five Forces
- 4.2. Supply/Value Chain
- 4.3. PESTEL analysis
- 4.4. Market Entropy
- 4.5. Patent/Trademark Analysis
- 5. Asia-Pacific Agricultural Sensors Industry Analysis, Insights and Forecast, 2019-2031
- 5.1. Market Analysis, Insights and Forecast - by Production Analysis
- 5.2. Market Analysis, Insights and Forecast - by Consumption Analysis
- 5.3. Market Analysis, Insights and Forecast - by Import Market Analysis (Value & Volume)
- 5.4. Market Analysis, Insights and Forecast - by Export Market Analysis (Value & Volume)
- 5.5. Market Analysis, Insights and Forecast - by Price Trend Analysis
- 5.6. Market Analysis, Insights and Forecast - by Region
- 5.6.1. Asia Pacific
- 5.1. Market Analysis, Insights and Forecast - by Production Analysis
- 6. China Asia-Pacific Agricultural Sensors Industry Analysis, Insights and Forecast, 2019-2031
- 7. Japan Asia-Pacific Agricultural Sensors Industry Analysis, Insights and Forecast, 2019-2031
- 8. India Asia-Pacific Agricultural Sensors Industry Analysis, Insights and Forecast, 2019-2031
- 9. South Korea Asia-Pacific Agricultural Sensors Industry Analysis, Insights and Forecast, 2019-2031
- 10. Taiwan Asia-Pacific Agricultural Sensors Industry Analysis, Insights and Forecast, 2019-2031
- 11. Australia Asia-Pacific Agricultural Sensors Industry Analysis, Insights and Forecast, 2019-2031
- 12. Rest of Asia-Pacific Asia-Pacific Agricultural Sensors Industry Analysis, Insights and Forecast, 2019-2031
- 13. Competitive Analysis
- 13.1. Market Share Analysis 2024
- 13.2. Company Profiles
- 13.2.1 Caipos Gmbh
- 13.2.1.1. Overview
- 13.2.1.2. Products
- 13.2.1.3. SWOT Analysis
- 13.2.1.4. Recent Developments
- 13.2.1.5. Financials (Based on Availability)
- 13.2.2 Konica Minolta Inc
- 13.2.2.1. Overview
- 13.2.2.2. Products
- 13.2.2.3. SWOT Analysis
- 13.2.2.4. Recent Developments
- 13.2.2.5. Financials (Based on Availability)
- 13.2.3 Ningbo Fujin garden irrigation equipment Co Ltd
- 13.2.3.1. Overview
- 13.2.3.2. Products
- 13.2.3.3. SWOT Analysis
- 13.2.3.4. Recent Developments
- 13.2.3.5. Financials (Based on Availability)
- 13.2.4 Pycno
- 13.2.4.1. Overview
- 13.2.4.2. Products
- 13.2.4.3. SWOT Analysis
- 13.2.4.4. Recent Developments
- 13.2.4.5. Financials (Based on Availability)
- 13.2.5 Vegetronix Inc
- 13.2.5.1. Overview
- 13.2.5.2. Products
- 13.2.5.3. SWOT Analysis
- 13.2.5.4. Recent Developments
- 13.2.5.5. Financials (Based on Availability)
- 13.2.6 TekBox Digital Solutions Vietnam Co Lt
- 13.2.6.1. Overview
- 13.2.6.2. Products
- 13.2.6.3. SWOT Analysis
- 13.2.6.4. Recent Developments
- 13.2.6.5. Financials (Based on Availability)
- 13.2.7 Libelium Comunicaciones Distribuidas Sl
- 13.2.7.1. Overview
- 13.2.7.2. Products
- 13.2.7.3. SWOT Analysis
- 13.2.7.4. Recent Developments
- 13.2.7.5. Financials (Based on Availability)
- 13.2.8 Trimble Inc
- 13.2.8.1. Overview
- 13.2.8.2. Products
- 13.2.8.3. SWOT Analysis
- 13.2.8.4. Recent Developments
- 13.2.8.5. Financials (Based on Availability)
- 13.2.1 Caipos Gmbh
List of Figures
- Figure 1: Asia-Pacific Agricultural Sensors Industry Revenue Breakdown (Million, %) by Product 2024 & 2032
- Figure 2: Asia-Pacific Agricultural Sensors Industry Share (%) by Company 2024
List of Tables
- Table 1: Asia-Pacific Agricultural Sensors Industry Revenue Million Forecast, by Region 2019 & 2032
- Table 2: Asia-Pacific Agricultural Sensors Industry Volume Kiloton Forecast, by Region 2019 & 2032
- Table 3: Asia-Pacific Agricultural Sensors Industry Revenue Million Forecast, by Production Analysis 2019 & 2032
- Table 4: Asia-Pacific Agricultural Sensors Industry Volume Kiloton Forecast, by Production Analysis 2019 & 2032
- Table 5: Asia-Pacific Agricultural Sensors Industry Revenue Million Forecast, by Consumption Analysis 2019 & 2032
- Table 6: Asia-Pacific Agricultural Sensors Industry Volume Kiloton Forecast, by Consumption Analysis 2019 & 2032
- Table 7: Asia-Pacific Agricultural Sensors Industry Revenue Million Forecast, by Import Market Analysis (Value & Volume) 2019 & 2032
- Table 8: Asia-Pacific Agricultural Sensors Industry Volume Kiloton Forecast, by Import Market Analysis (Value & Volume) 2019 & 2032
- Table 9: Asia-Pacific Agricultural Sensors Industry Revenue Million Forecast, by Export Market Analysis (Value & Volume) 2019 & 2032
- Table 10: Asia-Pacific Agricultural Sensors Industry Volume Kiloton Forecast, by Export Market Analysis (Value & Volume) 2019 & 2032
- Table 11: Asia-Pacific Agricultural Sensors Industry Revenue Million Forecast, by Price Trend Analysis 2019 & 2032
- Table 12: Asia-Pacific Agricultural Sensors Industry Volume Kiloton Forecast, by Price Trend Analysis 2019 & 2032
- Table 13: Asia-Pacific Agricultural Sensors Industry Revenue Million Forecast, by Region 2019 & 2032
- Table 14: Asia-Pacific Agricultural Sensors Industry Volume Kiloton Forecast, by Region 2019 & 2032
- Table 15: Asia-Pacific Agricultural Sensors Industry Revenue Million Forecast, by Country 2019 & 2032
- Table 16: Asia-Pacific Agricultural Sensors Industry Volume Kiloton Forecast, by Country 2019 & 2032
- Table 17: China Asia-Pacific Agricultural Sensors Industry Revenue (Million) Forecast, by Application 2019 & 2032
- Table 18: China Asia-Pacific Agricultural Sensors Industry Volume (Kiloton) Forecast, by Application 2019 & 2032
- Table 19: Japan Asia-Pacific Agricultural Sensors Industry Revenue (Million) Forecast, by Application 2019 & 2032
- Table 20: Japan Asia-Pacific Agricultural Sensors Industry Volume (Kiloton) Forecast, by Application 2019 & 2032
- Table 21: India Asia-Pacific Agricultural Sensors Industry Revenue (Million) Forecast, by Application 2019 & 2032
- Table 22: India Asia-Pacific Agricultural Sensors Industry Volume (Kiloton) Forecast, by Application 2019 & 2032
- Table 23: South Korea Asia-Pacific Agricultural Sensors Industry Revenue (Million) Forecast, by Application 2019 & 2032
- Table 24: South Korea Asia-Pacific Agricultural Sensors Industry Volume (Kiloton) Forecast, by Application 2019 & 2032
- Table 25: Taiwan Asia-Pacific Agricultural Sensors Industry Revenue (Million) Forecast, by Application 2019 & 2032
- Table 26: Taiwan Asia-Pacific Agricultural Sensors Industry Volume (Kiloton) Forecast, by Application 2019 & 2032
- Table 27: Australia Asia-Pacific Agricultural Sensors Industry Revenue (Million) Forecast, by Application 2019 & 2032
- Table 28: Australia Asia-Pacific Agricultural Sensors Industry Volume (Kiloton) Forecast, by Application 2019 & 2032
- Table 29: Rest of Asia-Pacific Asia-Pacific Agricultural Sensors Industry Revenue (Million) Forecast, by Application 2019 & 2032
- Table 30: Rest of Asia-Pacific Asia-Pacific Agricultural Sensors Industry Volume (Kiloton) Forecast, by Application 2019 & 2032
- Table 31: Asia-Pacific Agricultural Sensors Industry Revenue Million Forecast, by Production Analysis 2019 & 2032
- Table 32: Asia-Pacific Agricultural Sensors Industry Volume Kiloton Forecast, by Production Analysis 2019 & 2032
- Table 33: Asia-Pacific Agricultural Sensors Industry Revenue Million Forecast, by Consumption Analysis 2019 & 2032
- Table 34: Asia-Pacific Agricultural Sensors Industry Volume Kiloton Forecast, by Consumption Analysis 2019 & 2032
- Table 35: Asia-Pacific Agricultural Sensors Industry Revenue Million Forecast, by Import Market Analysis (Value & Volume) 2019 & 2032
- Table 36: Asia-Pacific Agricultural Sensors Industry Volume Kiloton Forecast, by Import Market Analysis (Value & Volume) 2019 & 2032
- Table 37: Asia-Pacific Agricultural Sensors Industry Revenue Million Forecast, by Export Market Analysis (Value & Volume) 2019 & 2032
- Table 38: Asia-Pacific Agricultural Sensors Industry Volume Kiloton Forecast, by Export Market Analysis (Value & Volume) 2019 & 2032
- Table 39: Asia-Pacific Agricultural Sensors Industry Revenue Million Forecast, by Price Trend Analysis 2019 & 2032
- Table 40: Asia-Pacific Agricultural Sensors Industry Volume Kiloton Forecast, by Price Trend Analysis 2019 & 2032
- Table 41: Asia-Pacific Agricultural Sensors Industry Revenue Million Forecast, by Country 2019 & 2032
- Table 42: Asia-Pacific Agricultural Sensors Industry Volume Kiloton Forecast, by Country 2019 & 2032
- Table 43: China Asia-Pacific Agricultural Sensors Industry Revenue (Million) Forecast, by Application 2019 & 2032
- Table 44: China Asia-Pacific Agricultural Sensors Industry Volume (Kiloton) Forecast, by Application 2019 & 2032
- Table 45: Japan Asia-Pacific Agricultural Sensors Industry Revenue (Million) Forecast, by Application 2019 & 2032
- Table 46: Japan Asia-Pacific Agricultural Sensors Industry Volume (Kiloton) Forecast, by Application 2019 & 2032
- Table 47: South Korea Asia-Pacific Agricultural Sensors Industry Revenue (Million) Forecast, by Application 2019 & 2032
- Table 48: South Korea Asia-Pacific Agricultural Sensors Industry Volume (Kiloton) Forecast, by Application 2019 & 2032
- Table 49: India Asia-Pacific Agricultural Sensors Industry Revenue (Million) Forecast, by Application 2019 & 2032
- Table 50: India Asia-Pacific Agricultural Sensors Industry Volume (Kiloton) Forecast, by Application 2019 & 2032
- Table 51: Australia Asia-Pacific Agricultural Sensors Industry Revenue (Million) Forecast, by Application 2019 & 2032
- Table 52: Australia Asia-Pacific Agricultural Sensors Industry Volume (Kiloton) Forecast, by Application 2019 & 2032
- Table 53: New Zealand Asia-Pacific Agricultural Sensors Industry Revenue (Million) Forecast, by Application 2019 & 2032
- Table 54: New Zealand Asia-Pacific Agricultural Sensors Industry Volume (Kiloton) Forecast, by Application 2019 & 2032
- Table 55: Indonesia Asia-Pacific Agricultural Sensors Industry Revenue (Million) Forecast, by Application 2019 & 2032
- Table 56: Indonesia Asia-Pacific Agricultural Sensors Industry Volume (Kiloton) Forecast, by Application 2019 & 2032
- Table 57: Malaysia Asia-Pacific Agricultural Sensors Industry Revenue (Million) Forecast, by Application 2019 & 2032
- Table 58: Malaysia Asia-Pacific Agricultural Sensors Industry Volume (Kiloton) Forecast, by Application 2019 & 2032
- Table 59: Singapore Asia-Pacific Agricultural Sensors Industry Revenue (Million) Forecast, by Application 2019 & 2032
- Table 60: Singapore Asia-Pacific Agricultural Sensors Industry Volume (Kiloton) Forecast, by Application 2019 & 2032
- Table 61: Thailand Asia-Pacific Agricultural Sensors Industry Revenue (Million) Forecast, by Application 2019 & 2032
- Table 62: Thailand Asia-Pacific Agricultural Sensors Industry Volume (Kiloton) Forecast, by Application 2019 & 2032
- Table 63: Vietnam Asia-Pacific Agricultural Sensors Industry Revenue (Million) Forecast, by Application 2019 & 2032
- Table 64: Vietnam Asia-Pacific Agricultural Sensors Industry Volume (Kiloton) Forecast, by Application 2019 & 2032
- Table 65: Philippines Asia-Pacific Agricultural Sensors Industry Revenue (Million) Forecast, by Application 2019 & 2032
- Table 66: Philippines Asia-Pacific Agricultural Sensors Industry Volume (Kiloton) Forecast, by Application 2019 & 2032
Frequently Asked Questions
1. What is the projected Compound Annual Growth Rate (CAGR) of the Asia-Pacific Agricultural Sensors Industry?
The projected CAGR is approximately 15.40%.
2. Which companies are prominent players in the Asia-Pacific Agricultural Sensors Industry?
Key companies in the market include Caipos Gmbh, Konica Minolta Inc, Ningbo Fujin garden irrigation equipment Co Ltd, Pycno, Vegetronix Inc, TekBox Digital Solutions Vietnam Co Lt, Libelium Comunicaciones Distribuidas Sl, Trimble Inc.
3. What are the main segments of the Asia-Pacific Agricultural Sensors Industry?
The market segments include Production Analysis, Consumption Analysis, Import Market Analysis (Value & Volume), Export Market Analysis (Value & Volume), Price Trend Analysis.
4. Can you provide details about the market size?
The market size is estimated to be USD 0.78 Million as of 2022.
5. What are some drivers contributing to market growth?
Increasing Legalization of Cannabis; Growing Focus on Health Benefits of Cannabis.
6. What are the notable trends driving market growth?
Increasing Farm Mechanization Rates.
7. Are there any restraints impacting market growth?
Lack of Data on Dosages and Results; Lack of Access to Financial Assistance.
8. Can you provide examples of recent developments in the market?
N/A
9. What pricing options are available for accessing the report?
Pricing options include single-user, multi-user, and enterprise licenses priced at USD 4750, USD 5250, and USD 8750 respectively.
10. Is the market size provided in terms of value or volume?
The market size is provided in terms of value, measured in Million and volume, measured in Kiloton.
11. Are there any specific market keywords associated with the report?
Yes, the market keyword associated with the report is "Asia-Pacific Agricultural Sensors Industry," which aids in identifying and referencing the specific market segment covered.
12. How do I determine which pricing option suits my needs best?
The pricing options vary based on user requirements and access needs. Individual users may opt for single-user licenses, while businesses requiring broader access may choose multi-user or enterprise licenses for cost-effective access to the report.
13. Are there any additional resources or data provided in the Asia-Pacific Agricultural Sensors Industry report?
While the report offers comprehensive insights, it's advisable to review the specific contents or supplementary materials provided to ascertain if additional resources or data are available.
14. How can I stay updated on further developments or reports in the Asia-Pacific Agricultural Sensors Industry?
To stay informed about further developments, trends, and reports in the Asia-Pacific Agricultural Sensors Industry, consider subscribing to industry newsletters, following relevant companies and organizations, or regularly checking reputable industry news sources and publications.
Methodology
Step 1 - Identification of Relevant Samples Size from Population Database


Step 2 - Approaches for Defining Global Market Size (Value, Volume* & Price*)

Note*: In applicable scenarios
Step 3 - Data Sources
Primary Research
- Web Analytics
- Survey Reports
- Research Institute
- Latest Research Reports
- Opinion Leaders
Secondary Research
- Annual Reports
- White Paper
- Latest Press Release
- Industry Association
- Paid Database
- Investor Presentations

Step 4 - Data Triangulation
Involves using different sources of information in order to increase the validity of a study
These sources are likely to be stakeholders in a program - participants, other researchers, program staff, other community members, and so on.
Then we put all data in single framework & apply various statistical tools to find out the dynamic on the market.
During the analysis stage, feedback from the stakeholder groups would be compared to determine areas of agreement as well as areas of divergence
