

Key Insights
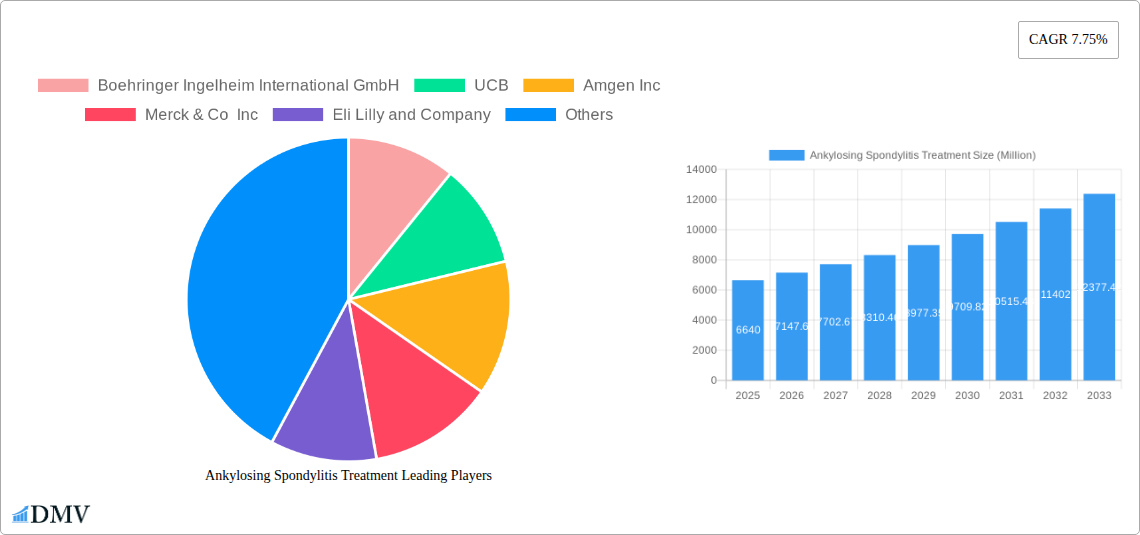
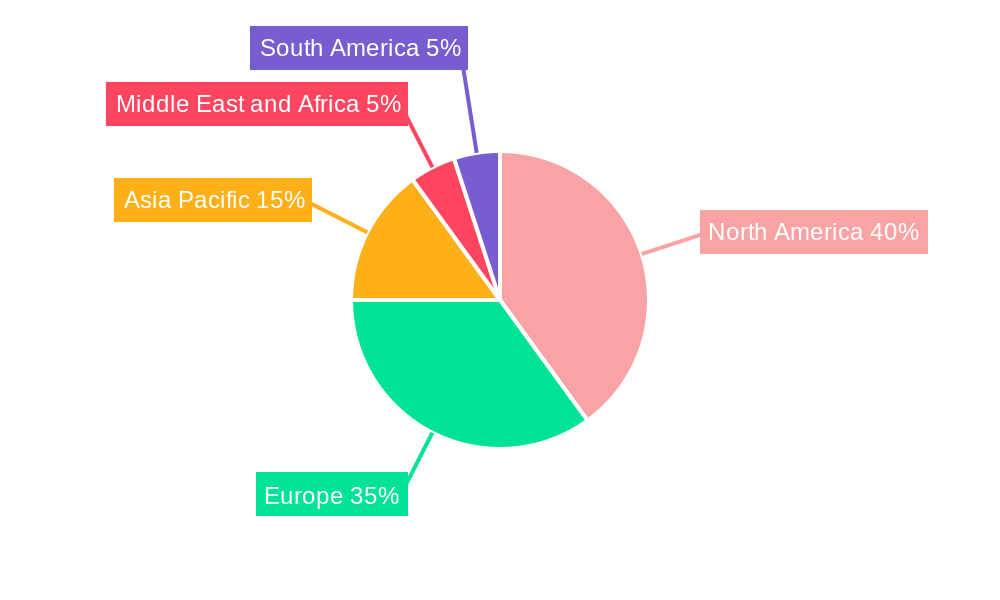
The Ankylosing Spondylitis (AS) treatment market, valued at $6.64 billion in 2025, exhibits robust growth potential, projected to expand at a Compound Annual Growth Rate (CAGR) of 7.75% from 2025 to 2033. This growth is fueled by several key factors. Rising prevalence of AS globally, particularly in aging populations, drives demand for effective treatments. Advances in biologics and targeted therapies, offering improved efficacy and reduced side effects compared to traditional nonsteroidal anti-inflammatory drugs (NSAIDs), significantly contribute to market expansion. Increased awareness and improved diagnosis rates, facilitated by enhanced healthcare infrastructure and patient education initiatives, also play a crucial role. The market is segmented by treatment type, with medication (including biologics and NSAIDs) dominating, followed by therapies like physiotherapy and surgery representing smaller, yet significant segments. Geographic variations exist, with North America and Europe currently holding larger market shares due to higher healthcare expenditure and established treatment infrastructure. However, the Asia-Pacific region shows significant growth potential driven by increasing awareness, rising disposable incomes, and expanding access to specialized healthcare. The market faces challenges including high treatment costs, potential for side effects associated with certain medications, and the need for ongoing treatment. Nevertheless, ongoing research and development efforts focusing on novel therapeutic approaches, as well as increasing patient advocacy, are expected to propel market expansion over the forecast period.
Further growth will be driven by the introduction of innovative therapies targeting specific disease mechanisms, personalized medicine approaches that tailor treatment to individual patient needs, and the development of biosimilars to reduce treatment costs. The competitive landscape is marked by the presence of major pharmaceutical companies, each contributing to the market's dynamism through ongoing research, new drug launches, and competitive pricing strategies. The focus on improving patient outcomes, coupled with sustained research and development investments, will ensure continuous evolution within the AS treatment market, presenting a wealth of opportunities for industry stakeholders in the coming years.
Ankylosing Spondylitis Treatment Market Report: 2019-2033
This comprehensive report provides an in-depth analysis of the Ankylosing Spondylitis (AS) treatment market, projecting a market value exceeding $XX Million by 2033. The study period covers 2019-2033, with 2025 as the base and estimated year. This report is essential for stakeholders including pharmaceutical companies, investors, researchers, and healthcare providers seeking a clear understanding of this evolving market landscape.
Ankylosing Spondylitis Treatment Market Composition & Trends
This section evaluates the competitive landscape, analyzing market concentration, innovation drivers, regulatory environments, substitute therapies, and M&A activities within the $XX Million AS treatment market. We examine the market share distribution among key players like Boehringer Ingelheim International GmbH, UCB, Amgen Inc, Merck & Co Inc, Eli Lilly and Company, Novartis AG (Sandoz), Celltrion Healthcare, AbbVie Inc, Reliance Life Sciences, Johnson & Johnson Services Inc, Pfizer Inc, and Gilead Sciences Inc.
- Market Concentration: The market exhibits a [high/medium/low - choose one based on your analysis] level of concentration, with the top 5 players holding an estimated XX% market share in 2025.
- Innovation Catalysts: Ongoing research into novel biologics and targeted therapies, along with biosimilar development, are driving innovation.
- Regulatory Landscape: Varying regulatory approvals across different regions influence market access and product lifecycles.
- Substitute Products: The availability of alternative treatments (e.g., physiotherapy) influences market dynamics.
- End-User Profiles: The report profiles key end-users, including hospitals, clinics, and specialized healthcare centers.
- M&A Activities: The report analyzes significant M&A deals in the AS treatment space, with total deal values exceeding $XX Million during the historical period (2019-2024).
Ankylosing Spondylitis Treatment Industry Evolution
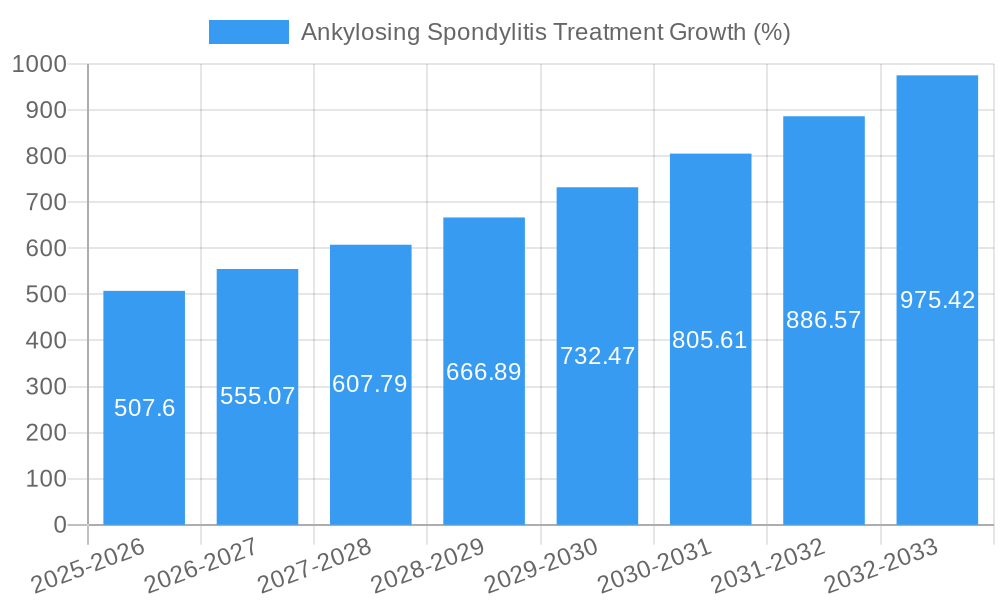
This section delves into the dynamic evolution of the AS treatment market, examining growth trajectories, technological advancements, and evolving patient needs. The market witnessed a CAGR of XX% during the historical period (2019-2024), driven by factors such as increasing prevalence of AS, improved diagnosis techniques, and the launch of innovative therapies. The forecast period (2025-2033) anticipates a CAGR of XX%, propelled by the growing adoption of biologics and the emergence of novel treatment approaches. The shift towards personalized medicine and the rising demand for effective and convenient treatment options are also influencing market growth. The increasing awareness about AS and improved access to healthcare, especially in developing economies, contributes significantly to the market's expansion. Technological advancements in drug delivery systems and diagnostic tools further enhance treatment efficacy and convenience, accelerating market growth.
Leading Regions, Countries, or Segments in Ankylosing Spondylitis Treatment
Dominant Region/Country: [Identify the leading region/country, e.g., North America] holds the largest market share, accounting for approximately XX% of the global market in 2025.
Key Drivers (North America):
- High healthcare expenditure and advanced healthcare infrastructure.
- Strong regulatory support and faster drug approvals.
- Higher prevalence of AS compared to other regions.
- Significant investments in research and development of new therapies.
Dominant Segment (By Treatment Type): [Identify the leading segment, e.g., Medication] accounts for approximately XX% of the overall market in 2025.
Key Drivers (Medication Segment):
- Wide availability of effective medications, including biologics and small molecules.
- Growing preference for convenient and non-invasive treatment options.
- Continuous advancements in medication efficacy and safety profiles.
The dominance of [leading region/country and segment] is attributed to a confluence of factors including high disease prevalence, robust healthcare infrastructure, favorable regulatory environments, and significant investments in research and development. Other regions are expected to witness considerable growth, driven by increasing awareness, improved access to healthcare, and expansion of pharmaceutical companies' reach.
Ankylosing Spondylitis Treatment Product Innovations
Recent years have witnessed significant advancements in AS treatment, marked by the introduction of novel biologics targeting specific inflammatory pathways and improved biosimilars offering cost-effective alternatives. These innovations have significantly enhanced treatment efficacy, reduced adverse effects, and expanded treatment options for patients. The development of personalized medicine approaches and novel drug delivery systems further contributes to improved patient outcomes and treatment adherence. The unique selling propositions (USPs) of these new therapies often include superior efficacy, reduced side effects, and convenient administration routes.
Propelling Factors for Ankylosing Spondylitis Treatment Growth
Several factors drive the growth of the AS treatment market. Firstly, the rising prevalence of AS globally is a primary growth driver. Secondly, advancements in diagnostic techniques enable earlier and more accurate diagnosis, leading to timely intervention and treatment. Thirdly, continuous research and development resulting in the launch of innovative and effective therapies with improved safety profiles fuels market expansion. Finally, increasing healthcare expenditure and improved access to healthcare, especially in developing economies, contribute significantly to market growth.
Obstacles in the Ankylosing Spondylitis Treatment Market
The AS treatment market faces challenges such as high drug prices, potentially limiting access for patients. Strict regulatory pathways for drug approvals and variations in reimbursement policies across different regions create hurdles for market entry and expansion. Furthermore, the emergence of biosimilars can lead to price competition, impacting profitability for innovator companies. Supply chain disruptions and the complexities of managing chronic diseases also contribute to market obstacles.
Future Opportunities in Ankylosing Spondylitis Treatment
Emerging opportunities include the development of personalized medicine approaches tailored to individual patient needs and genetic profiles, offering improved treatment efficacy and reduced side effects. Furthermore, exploring novel therapeutic targets and pathways opens avenues for more effective therapies. Expanding into untapped markets in developing economies presents significant growth potential. Finally, leveraging digital health technologies for improved patient management and remote monitoring offers promising opportunities.
Major Players in the Ankylosing Spondylitis Treatment Ecosystem
- Boehringer Ingelheim International GmbH
- UCB
- Amgen Inc
- Merck & Co Inc
- Eli Lilly and Company
- Novartis AG (Sandoz)
- Celltrion Healthcare
- AbbVie Inc
- Reliance Life Sciences
- Johnson & Johnson Services Inc
- Pfizer Inc
- Gilead Sciences Inc
Key Developments in Ankylosing Spondylitis Treatment Industry
- August 2023: Simcere Pharmaceutical and Lynk Pharmaceuticals report positive Phase II clinical trial data for LNK01001.
- November 2022: Australia approves AVT02, a Humira biosimilar, for AS treatment.
- July 2022: European Commission approves RINVOQ (upadacitinib) for active non-radiographic axial spondyloarthritis.
These developments highlight the ongoing innovation and expansion within the AS treatment landscape, impacting market competition and treatment options.
Strategic Ankylosing Spondylitis Treatment Market Forecast
The AS treatment market is poised for substantial growth driven by increasing prevalence, technological advancements, and the emergence of novel therapies. Future opportunities lie in personalized medicine, novel drug targets, and expanding access in underserved populations. The market's continued expansion will be shaped by ongoing research, regulatory approvals, and the competitive dynamics among leading pharmaceutical companies. The forecast predicts significant market expansion through 2033, driven by the factors outlined above.
Ankylosing Spondylitis Treatment Segmentation
-
1. Treatment Types
- 1.1. Medication
- 1.2. Therapy
- 1.3. Surgery
Ankylosing Spondylitis Treatment Segmentation By Geography
-
1. North America
- 1.1. United States
- 1.2. Canada
- 1.3. Mexico
-
2. Europe
- 2.1. Germany
- 2.2. United Kingdom
- 2.3. France
- 2.4. Italy
- 2.5. Spain
- 2.6. Rest of Europe
-
3. Asia Pacific
- 3.1. China
- 3.2. Japan
- 3.3. India
- 3.4. Australia
- 3.5. South Korea
- 3.6. Rest of Asia Pacific
-
4. Middle East and Africa
- 4.1. GCC
- 4.2. South Africa
- 4.3. Rest of Middle East and Africa
-
5. South America
- 5.1. Brazil
- 5.2. Argentina
- 5.3. Rest of South America
Ankylosing Spondylitis Treatment REPORT HIGHLIGHTS
| Aspects | Details |
|---|---|
| Study Period | 2019-2033 |
| Base Year | 2024 |
| Estimated Year | 2025 |
| Forecast Period | 2025-2033 |
| Historical Period | 2019-2024 |
| Growth Rate | CAGR of 7.75% from 2019-2033 |
| Segmentation |
|
Table of Contents
- 1. Introduction
- 1.1. Research Scope
- 1.2. Market Segmentation
- 1.3. Research Methodology
- 1.4. Definitions and Assumptions
- 2. Executive Summary
- 2.1. Introduction
- 3. Market Dynamics
- 3.1. Introduction
- 3.2. Market Drivers
- 3.2.1. Growing Burden of Target Diseases and Rising Reimbursements for the Treatment; Research and Development for Effective Treatment
- 3.3. Market Restrains
- 3.3.1. High Cost of Treatment
- 3.4. Market Trends
- 3.4.1. Nonsteroidal Anti-Inflammatory Drugs (NSAIDs) Segment is Expected to Hold a Significant Market Share Over the Forecast Period
- 4. Market Factor Analysis
- 4.1. Porters Five Forces
- 4.2. Supply/Value Chain
- 4.3. PESTEL analysis
- 4.4. Market Entropy
- 4.5. Patent/Trademark Analysis
- 5. Global Ankylosing Spondylitis Treatment Analysis, Insights and Forecast, 2019-2031
- 5.1. Market Analysis, Insights and Forecast - by Treatment Types
- 5.1.1. Medication
- 5.1.2. Therapy
- 5.1.3. Surgery
- 5.2. Market Analysis, Insights and Forecast - by Region
- 5.2.1. North America
- 5.2.2. Europe
- 5.2.3. Asia Pacific
- 5.2.4. Middle East and Africa
- 5.2.5. South America
- 5.1. Market Analysis, Insights and Forecast - by Treatment Types
- 6. North America Ankylosing Spondylitis Treatment Analysis, Insights and Forecast, 2019-2031
- 6.1. Market Analysis, Insights and Forecast - by Treatment Types
- 6.1.1. Medication
- 6.1.2. Therapy
- 6.1.3. Surgery
- 6.1. Market Analysis, Insights and Forecast - by Treatment Types
- 7. Europe Ankylosing Spondylitis Treatment Analysis, Insights and Forecast, 2019-2031
- 7.1. Market Analysis, Insights and Forecast - by Treatment Types
- 7.1.1. Medication
- 7.1.2. Therapy
- 7.1.3. Surgery
- 7.1. Market Analysis, Insights and Forecast - by Treatment Types
- 8. Asia Pacific Ankylosing Spondylitis Treatment Analysis, Insights and Forecast, 2019-2031
- 8.1. Market Analysis, Insights and Forecast - by Treatment Types
- 8.1.1. Medication
- 8.1.2. Therapy
- 8.1.3. Surgery
- 8.1. Market Analysis, Insights and Forecast - by Treatment Types
- 9. Middle East and Africa Ankylosing Spondylitis Treatment Analysis, Insights and Forecast, 2019-2031
- 9.1. Market Analysis, Insights and Forecast - by Treatment Types
- 9.1.1. Medication
- 9.1.2. Therapy
- 9.1.3. Surgery
- 9.1. Market Analysis, Insights and Forecast - by Treatment Types
- 10. South America Ankylosing Spondylitis Treatment Analysis, Insights and Forecast, 2019-2031
- 10.1. Market Analysis, Insights and Forecast - by Treatment Types
- 10.1.1. Medication
- 10.1.2. Therapy
- 10.1.3. Surgery
- 10.1. Market Analysis, Insights and Forecast - by Treatment Types
- 11. North America Ankylosing Spondylitis Treatment Analysis, Insights and Forecast, 2019-2031
- 11.1. Market Analysis, Insights and Forecast - By Country/Sub-region
- 11.1.1 United States
- 11.1.2 Canada
- 11.1.3 Mexico
- 12. Europe Ankylosing Spondylitis Treatment Analysis, Insights and Forecast, 2019-2031
- 12.1. Market Analysis, Insights and Forecast - By Country/Sub-region
- 12.1.1 Germany
- 12.1.2 United Kingdom
- 12.1.3 France
- 12.1.4 Italy
- 12.1.5 Spain
- 12.1.6 Rest of Europe
- 13. Asia Pacific Ankylosing Spondylitis Treatment Analysis, Insights and Forecast, 2019-2031
- 13.1. Market Analysis, Insights and Forecast - By Country/Sub-region
- 13.1.1 China
- 13.1.2 Japan
- 13.1.3 India
- 13.1.4 Australia
- 13.1.5 South Korea
- 13.1.6 Rest of Asia Pacific
- 14. Middle East and Africa Ankylosing Spondylitis Treatment Analysis, Insights and Forecast, 2019-2031
- 14.1. Market Analysis, Insights and Forecast - By Country/Sub-region
- 14.1.1 GCC
- 14.1.2 South Africa
- 14.1.3 Rest of Middle East and Africa
- 15. South America Ankylosing Spondylitis Treatment Analysis, Insights and Forecast, 2019-2031
- 15.1. Market Analysis, Insights and Forecast - By Country/Sub-region
- 15.1.1 Brazil
- 15.1.2 Argentina
- 15.1.3 Rest of South America
- 16. Competitive Analysis
- 16.1. Global Market Share Analysis 2024
- 16.2. Company Profiles
- 16.2.1 Boehringer Ingelheim International GmbH
- 16.2.1.1. Overview
- 16.2.1.2. Products
- 16.2.1.3. SWOT Analysis
- 16.2.1.4. Recent Developments
- 16.2.1.5. Financials (Based on Availability)
- 16.2.2 UCB
- 16.2.2.1. Overview
- 16.2.2.2. Products
- 16.2.2.3. SWOT Analysis
- 16.2.2.4. Recent Developments
- 16.2.2.5. Financials (Based on Availability)
- 16.2.3 Amgen Inc
- 16.2.3.1. Overview
- 16.2.3.2. Products
- 16.2.3.3. SWOT Analysis
- 16.2.3.4. Recent Developments
- 16.2.3.5. Financials (Based on Availability)
- 16.2.4 Merck & Co Inc
- 16.2.4.1. Overview
- 16.2.4.2. Products
- 16.2.4.3. SWOT Analysis
- 16.2.4.4. Recent Developments
- 16.2.4.5. Financials (Based on Availability)
- 16.2.5 Eli Lilly and Company
- 16.2.5.1. Overview
- 16.2.5.2. Products
- 16.2.5.3. SWOT Analysis
- 16.2.5.4. Recent Developments
- 16.2.5.5. Financials (Based on Availability)
- 16.2.6 Novartis AG (Sandoz)
- 16.2.6.1. Overview
- 16.2.6.2. Products
- 16.2.6.3. SWOT Analysis
- 16.2.6.4. Recent Developments
- 16.2.6.5. Financials (Based on Availability)
- 16.2.7 Celltrion Healthcare
- 16.2.7.1. Overview
- 16.2.7.2. Products
- 16.2.7.3. SWOT Analysis
- 16.2.7.4. Recent Developments
- 16.2.7.5. Financials (Based on Availability)
- 16.2.8 AbbVie Inc
- 16.2.8.1. Overview
- 16.2.8.2. Products
- 16.2.8.3. SWOT Analysis
- 16.2.8.4. Recent Developments
- 16.2.8.5. Financials (Based on Availability)
- 16.2.9 Reliance Life Sciences
- 16.2.9.1. Overview
- 16.2.9.2. Products
- 16.2.9.3. SWOT Analysis
- 16.2.9.4. Recent Developments
- 16.2.9.5. Financials (Based on Availability)
- 16.2.10 Johnson & Johnson Services Inc
- 16.2.10.1. Overview
- 16.2.10.2. Products
- 16.2.10.3. SWOT Analysis
- 16.2.10.4. Recent Developments
- 16.2.10.5. Financials (Based on Availability)
- 16.2.11 Pfizer Inc
- 16.2.11.1. Overview
- 16.2.11.2. Products
- 16.2.11.3. SWOT Analysis
- 16.2.11.4. Recent Developments
- 16.2.11.5. Financials (Based on Availability)
- 16.2.12 Gilead Sciences Inc
- 16.2.12.1. Overview
- 16.2.12.2. Products
- 16.2.12.3. SWOT Analysis
- 16.2.12.4. Recent Developments
- 16.2.12.5. Financials (Based on Availability)
- 16.2.1 Boehringer Ingelheim International GmbH
List of Figures
- Figure 1: Global Ankylosing Spondylitis Treatment Revenue Breakdown (Million, %) by Region 2024 & 2032
- Figure 2: Global Ankylosing Spondylitis Treatment Volume Breakdown (K Unit, %) by Region 2024 & 2032
- Figure 3: North America Ankylosing Spondylitis Treatment Revenue (Million), by Country 2024 & 2032
- Figure 4: North America Ankylosing Spondylitis Treatment Volume (K Unit), by Country 2024 & 2032
- Figure 5: North America Ankylosing Spondylitis Treatment Revenue Share (%), by Country 2024 & 2032
- Figure 6: North America Ankylosing Spondylitis Treatment Volume Share (%), by Country 2024 & 2032
- Figure 7: Europe Ankylosing Spondylitis Treatment Revenue (Million), by Country 2024 & 2032
- Figure 8: Europe Ankylosing Spondylitis Treatment Volume (K Unit), by Country 2024 & 2032
- Figure 9: Europe Ankylosing Spondylitis Treatment Revenue Share (%), by Country 2024 & 2032
- Figure 10: Europe Ankylosing Spondylitis Treatment Volume Share (%), by Country 2024 & 2032
- Figure 11: Asia Pacific Ankylosing Spondylitis Treatment Revenue (Million), by Country 2024 & 2032
- Figure 12: Asia Pacific Ankylosing Spondylitis Treatment Volume (K Unit), by Country 2024 & 2032
- Figure 13: Asia Pacific Ankylosing Spondylitis Treatment Revenue Share (%), by Country 2024 & 2032
- Figure 14: Asia Pacific Ankylosing Spondylitis Treatment Volume Share (%), by Country 2024 & 2032
- Figure 15: Middle East and Africa Ankylosing Spondylitis Treatment Revenue (Million), by Country 2024 & 2032
- Figure 16: Middle East and Africa Ankylosing Spondylitis Treatment Volume (K Unit), by Country 2024 & 2032
- Figure 17: Middle East and Africa Ankylosing Spondylitis Treatment Revenue Share (%), by Country 2024 & 2032
- Figure 18: Middle East and Africa Ankylosing Spondylitis Treatment Volume Share (%), by Country 2024 & 2032
- Figure 19: South America Ankylosing Spondylitis Treatment Revenue (Million), by Country 2024 & 2032
- Figure 20: South America Ankylosing Spondylitis Treatment Volume (K Unit), by Country 2024 & 2032
- Figure 21: South America Ankylosing Spondylitis Treatment Revenue Share (%), by Country 2024 & 2032
- Figure 22: South America Ankylosing Spondylitis Treatment Volume Share (%), by Country 2024 & 2032
- Figure 23: North America Ankylosing Spondylitis Treatment Revenue (Million), by Treatment Types 2024 & 2032
- Figure 24: North America Ankylosing Spondylitis Treatment Volume (K Unit), by Treatment Types 2024 & 2032
- Figure 25: North America Ankylosing Spondylitis Treatment Revenue Share (%), by Treatment Types 2024 & 2032
- Figure 26: North America Ankylosing Spondylitis Treatment Volume Share (%), by Treatment Types 2024 & 2032
- Figure 27: North America Ankylosing Spondylitis Treatment Revenue (Million), by Country 2024 & 2032
- Figure 28: North America Ankylosing Spondylitis Treatment Volume (K Unit), by Country 2024 & 2032
- Figure 29: North America Ankylosing Spondylitis Treatment Revenue Share (%), by Country 2024 & 2032
- Figure 30: North America Ankylosing Spondylitis Treatment Volume Share (%), by Country 2024 & 2032
- Figure 31: Europe Ankylosing Spondylitis Treatment Revenue (Million), by Treatment Types 2024 & 2032
- Figure 32: Europe Ankylosing Spondylitis Treatment Volume (K Unit), by Treatment Types 2024 & 2032
- Figure 33: Europe Ankylosing Spondylitis Treatment Revenue Share (%), by Treatment Types 2024 & 2032
- Figure 34: Europe Ankylosing Spondylitis Treatment Volume Share (%), by Treatment Types 2024 & 2032
- Figure 35: Europe Ankylosing Spondylitis Treatment Revenue (Million), by Country 2024 & 2032
- Figure 36: Europe Ankylosing Spondylitis Treatment Volume (K Unit), by Country 2024 & 2032
- Figure 37: Europe Ankylosing Spondylitis Treatment Revenue Share (%), by Country 2024 & 2032
- Figure 38: Europe Ankylosing Spondylitis Treatment Volume Share (%), by Country 2024 & 2032
- Figure 39: Asia Pacific Ankylosing Spondylitis Treatment Revenue (Million), by Treatment Types 2024 & 2032
- Figure 40: Asia Pacific Ankylosing Spondylitis Treatment Volume (K Unit), by Treatment Types 2024 & 2032
- Figure 41: Asia Pacific Ankylosing Spondylitis Treatment Revenue Share (%), by Treatment Types 2024 & 2032
- Figure 42: Asia Pacific Ankylosing Spondylitis Treatment Volume Share (%), by Treatment Types 2024 & 2032
- Figure 43: Asia Pacific Ankylosing Spondylitis Treatment Revenue (Million), by Country 2024 & 2032
- Figure 44: Asia Pacific Ankylosing Spondylitis Treatment Volume (K Unit), by Country 2024 & 2032
- Figure 45: Asia Pacific Ankylosing Spondylitis Treatment Revenue Share (%), by Country 2024 & 2032
- Figure 46: Asia Pacific Ankylosing Spondylitis Treatment Volume Share (%), by Country 2024 & 2032
- Figure 47: Middle East and Africa Ankylosing Spondylitis Treatment Revenue (Million), by Treatment Types 2024 & 2032
- Figure 48: Middle East and Africa Ankylosing Spondylitis Treatment Volume (K Unit), by Treatment Types 2024 & 2032
- Figure 49: Middle East and Africa Ankylosing Spondylitis Treatment Revenue Share (%), by Treatment Types 2024 & 2032
- Figure 50: Middle East and Africa Ankylosing Spondylitis Treatment Volume Share (%), by Treatment Types 2024 & 2032
- Figure 51: Middle East and Africa Ankylosing Spondylitis Treatment Revenue (Million), by Country 2024 & 2032
- Figure 52: Middle East and Africa Ankylosing Spondylitis Treatment Volume (K Unit), by Country 2024 & 2032
- Figure 53: Middle East and Africa Ankylosing Spondylitis Treatment Revenue Share (%), by Country 2024 & 2032
- Figure 54: Middle East and Africa Ankylosing Spondylitis Treatment Volume Share (%), by Country 2024 & 2032
- Figure 55: South America Ankylosing Spondylitis Treatment Revenue (Million), by Treatment Types 2024 & 2032
- Figure 56: South America Ankylosing Spondylitis Treatment Volume (K Unit), by Treatment Types 2024 & 2032
- Figure 57: South America Ankylosing Spondylitis Treatment Revenue Share (%), by Treatment Types 2024 & 2032
- Figure 58: South America Ankylosing Spondylitis Treatment Volume Share (%), by Treatment Types 2024 & 2032
- Figure 59: South America Ankylosing Spondylitis Treatment Revenue (Million), by Country 2024 & 2032
- Figure 60: South America Ankylosing Spondylitis Treatment Volume (K Unit), by Country 2024 & 2032
- Figure 61: South America Ankylosing Spondylitis Treatment Revenue Share (%), by Country 2024 & 2032
- Figure 62: South America Ankylosing Spondylitis Treatment Volume Share (%), by Country 2024 & 2032
List of Tables
- Table 1: Global Ankylosing Spondylitis Treatment Revenue Million Forecast, by Region 2019 & 2032
- Table 2: Global Ankylosing Spondylitis Treatment Volume K Unit Forecast, by Region 2019 & 2032
- Table 3: Global Ankylosing Spondylitis Treatment Revenue Million Forecast, by Treatment Types 2019 & 2032
- Table 4: Global Ankylosing Spondylitis Treatment Volume K Unit Forecast, by Treatment Types 2019 & 2032
- Table 5: Global Ankylosing Spondylitis Treatment Revenue Million Forecast, by Region 2019 & 2032
- Table 6: Global Ankylosing Spondylitis Treatment Volume K Unit Forecast, by Region 2019 & 2032
- Table 7: Global Ankylosing Spondylitis Treatment Revenue Million Forecast, by Country 2019 & 2032
- Table 8: Global Ankylosing Spondylitis Treatment Volume K Unit Forecast, by Country 2019 & 2032
- Table 9: United States Ankylosing Spondylitis Treatment Revenue (Million) Forecast, by Application 2019 & 2032
- Table 10: United States Ankylosing Spondylitis Treatment Volume (K Unit) Forecast, by Application 2019 & 2032
- Table 11: Canada Ankylosing Spondylitis Treatment Revenue (Million) Forecast, by Application 2019 & 2032
- Table 12: Canada Ankylosing Spondylitis Treatment Volume (K Unit) Forecast, by Application 2019 & 2032
- Table 13: Mexico Ankylosing Spondylitis Treatment Revenue (Million) Forecast, by Application 2019 & 2032
- Table 14: Mexico Ankylosing Spondylitis Treatment Volume (K Unit) Forecast, by Application 2019 & 2032
- Table 15: Global Ankylosing Spondylitis Treatment Revenue Million Forecast, by Country 2019 & 2032
- Table 16: Global Ankylosing Spondylitis Treatment Volume K Unit Forecast, by Country 2019 & 2032
- Table 17: Germany Ankylosing Spondylitis Treatment Revenue (Million) Forecast, by Application 2019 & 2032
- Table 18: Germany Ankylosing Spondylitis Treatment Volume (K Unit) Forecast, by Application 2019 & 2032
- Table 19: United Kingdom Ankylosing Spondylitis Treatment Revenue (Million) Forecast, by Application 2019 & 2032
- Table 20: United Kingdom Ankylosing Spondylitis Treatment Volume (K Unit) Forecast, by Application 2019 & 2032
- Table 21: France Ankylosing Spondylitis Treatment Revenue (Million) Forecast, by Application 2019 & 2032
- Table 22: France Ankylosing Spondylitis Treatment Volume (K Unit) Forecast, by Application 2019 & 2032
- Table 23: Italy Ankylosing Spondylitis Treatment Revenue (Million) Forecast, by Application 2019 & 2032
- Table 24: Italy Ankylosing Spondylitis Treatment Volume (K Unit) Forecast, by Application 2019 & 2032
- Table 25: Spain Ankylosing Spondylitis Treatment Revenue (Million) Forecast, by Application 2019 & 2032
- Table 26: Spain Ankylosing Spondylitis Treatment Volume (K Unit) Forecast, by Application 2019 & 2032
- Table 27: Rest of Europe Ankylosing Spondylitis Treatment Revenue (Million) Forecast, by Application 2019 & 2032
- Table 28: Rest of Europe Ankylosing Spondylitis Treatment Volume (K Unit) Forecast, by Application 2019 & 2032
- Table 29: Global Ankylosing Spondylitis Treatment Revenue Million Forecast, by Country 2019 & 2032
- Table 30: Global Ankylosing Spondylitis Treatment Volume K Unit Forecast, by Country 2019 & 2032
- Table 31: China Ankylosing Spondylitis Treatment Revenue (Million) Forecast, by Application 2019 & 2032
- Table 32: China Ankylosing Spondylitis Treatment Volume (K Unit) Forecast, by Application 2019 & 2032
- Table 33: Japan Ankylosing Spondylitis Treatment Revenue (Million) Forecast, by Application 2019 & 2032
- Table 34: Japan Ankylosing Spondylitis Treatment Volume (K Unit) Forecast, by Application 2019 & 2032
- Table 35: India Ankylosing Spondylitis Treatment Revenue (Million) Forecast, by Application 2019 & 2032
- Table 36: India Ankylosing Spondylitis Treatment Volume (K Unit) Forecast, by Application 2019 & 2032
- Table 37: Australia Ankylosing Spondylitis Treatment Revenue (Million) Forecast, by Application 2019 & 2032
- Table 38: Australia Ankylosing Spondylitis Treatment Volume (K Unit) Forecast, by Application 2019 & 2032
- Table 39: South Korea Ankylosing Spondylitis Treatment Revenue (Million) Forecast, by Application 2019 & 2032
- Table 40: South Korea Ankylosing Spondylitis Treatment Volume (K Unit) Forecast, by Application 2019 & 2032
- Table 41: Rest of Asia Pacific Ankylosing Spondylitis Treatment Revenue (Million) Forecast, by Application 2019 & 2032
- Table 42: Rest of Asia Pacific Ankylosing Spondylitis Treatment Volume (K Unit) Forecast, by Application 2019 & 2032
- Table 43: Global Ankylosing Spondylitis Treatment Revenue Million Forecast, by Country 2019 & 2032
- Table 44: Global Ankylosing Spondylitis Treatment Volume K Unit Forecast, by Country 2019 & 2032
- Table 45: GCC Ankylosing Spondylitis Treatment Revenue (Million) Forecast, by Application 2019 & 2032
- Table 46: GCC Ankylosing Spondylitis Treatment Volume (K Unit) Forecast, by Application 2019 & 2032
- Table 47: South Africa Ankylosing Spondylitis Treatment Revenue (Million) Forecast, by Application 2019 & 2032
- Table 48: South Africa Ankylosing Spondylitis Treatment Volume (K Unit) Forecast, by Application 2019 & 2032
- Table 49: Rest of Middle East and Africa Ankylosing Spondylitis Treatment Revenue (Million) Forecast, by Application 2019 & 2032
- Table 50: Rest of Middle East and Africa Ankylosing Spondylitis Treatment Volume (K Unit) Forecast, by Application 2019 & 2032
- Table 51: Global Ankylosing Spondylitis Treatment Revenue Million Forecast, by Country 2019 & 2032
- Table 52: Global Ankylosing Spondylitis Treatment Volume K Unit Forecast, by Country 2019 & 2032
- Table 53: Brazil Ankylosing Spondylitis Treatment Revenue (Million) Forecast, by Application 2019 & 2032
- Table 54: Brazil Ankylosing Spondylitis Treatment Volume (K Unit) Forecast, by Application 2019 & 2032
- Table 55: Argentina Ankylosing Spondylitis Treatment Revenue (Million) Forecast, by Application 2019 & 2032
- Table 56: Argentina Ankylosing Spondylitis Treatment Volume (K Unit) Forecast, by Application 2019 & 2032
- Table 57: Rest of South America Ankylosing Spondylitis Treatment Revenue (Million) Forecast, by Application 2019 & 2032
- Table 58: Rest of South America Ankylosing Spondylitis Treatment Volume (K Unit) Forecast, by Application 2019 & 2032
- Table 59: Global Ankylosing Spondylitis Treatment Revenue Million Forecast, by Treatment Types 2019 & 2032
- Table 60: Global Ankylosing Spondylitis Treatment Volume K Unit Forecast, by Treatment Types 2019 & 2032
- Table 61: Global Ankylosing Spondylitis Treatment Revenue Million Forecast, by Country 2019 & 2032
- Table 62: Global Ankylosing Spondylitis Treatment Volume K Unit Forecast, by Country 2019 & 2032
- Table 63: United States Ankylosing Spondylitis Treatment Revenue (Million) Forecast, by Application 2019 & 2032
- Table 64: United States Ankylosing Spondylitis Treatment Volume (K Unit) Forecast, by Application 2019 & 2032
- Table 65: Canada Ankylosing Spondylitis Treatment Revenue (Million) Forecast, by Application 2019 & 2032
- Table 66: Canada Ankylosing Spondylitis Treatment Volume (K Unit) Forecast, by Application 2019 & 2032
- Table 67: Mexico Ankylosing Spondylitis Treatment Revenue (Million) Forecast, by Application 2019 & 2032
- Table 68: Mexico Ankylosing Spondylitis Treatment Volume (K Unit) Forecast, by Application 2019 & 2032
- Table 69: Global Ankylosing Spondylitis Treatment Revenue Million Forecast, by Treatment Types 2019 & 2032
- Table 70: Global Ankylosing Spondylitis Treatment Volume K Unit Forecast, by Treatment Types 2019 & 2032
- Table 71: Global Ankylosing Spondylitis Treatment Revenue Million Forecast, by Country 2019 & 2032
- Table 72: Global Ankylosing Spondylitis Treatment Volume K Unit Forecast, by Country 2019 & 2032
- Table 73: Germany Ankylosing Spondylitis Treatment Revenue (Million) Forecast, by Application 2019 & 2032
- Table 74: Germany Ankylosing Spondylitis Treatment Volume (K Unit) Forecast, by Application 2019 & 2032
- Table 75: United Kingdom Ankylosing Spondylitis Treatment Revenue (Million) Forecast, by Application 2019 & 2032
- Table 76: United Kingdom Ankylosing Spondylitis Treatment Volume (K Unit) Forecast, by Application 2019 & 2032
- Table 77: France Ankylosing Spondylitis Treatment Revenue (Million) Forecast, by Application 2019 & 2032
- Table 78: France Ankylosing Spondylitis Treatment Volume (K Unit) Forecast, by Application 2019 & 2032
- Table 79: Italy Ankylosing Spondylitis Treatment Revenue (Million) Forecast, by Application 2019 & 2032
- Table 80: Italy Ankylosing Spondylitis Treatment Volume (K Unit) Forecast, by Application 2019 & 2032
- Table 81: Spain Ankylosing Spondylitis Treatment Revenue (Million) Forecast, by Application 2019 & 2032
- Table 82: Spain Ankylosing Spondylitis Treatment Volume (K Unit) Forecast, by Application 2019 & 2032
- Table 83: Rest of Europe Ankylosing Spondylitis Treatment Revenue (Million) Forecast, by Application 2019 & 2032
- Table 84: Rest of Europe Ankylosing Spondylitis Treatment Volume (K Unit) Forecast, by Application 2019 & 2032
- Table 85: Global Ankylosing Spondylitis Treatment Revenue Million Forecast, by Treatment Types 2019 & 2032
- Table 86: Global Ankylosing Spondylitis Treatment Volume K Unit Forecast, by Treatment Types 2019 & 2032
- Table 87: Global Ankylosing Spondylitis Treatment Revenue Million Forecast, by Country 2019 & 2032
- Table 88: Global Ankylosing Spondylitis Treatment Volume K Unit Forecast, by Country 2019 & 2032
- Table 89: China Ankylosing Spondylitis Treatment Revenue (Million) Forecast, by Application 2019 & 2032
- Table 90: China Ankylosing Spondylitis Treatment Volume (K Unit) Forecast, by Application 2019 & 2032
- Table 91: Japan Ankylosing Spondylitis Treatment Revenue (Million) Forecast, by Application 2019 & 2032
- Table 92: Japan Ankylosing Spondylitis Treatment Volume (K Unit) Forecast, by Application 2019 & 2032
- Table 93: India Ankylosing Spondylitis Treatment Revenue (Million) Forecast, by Application 2019 & 2032
- Table 94: India Ankylosing Spondylitis Treatment Volume (K Unit) Forecast, by Application 2019 & 2032
- Table 95: Australia Ankylosing Spondylitis Treatment Revenue (Million) Forecast, by Application 2019 & 2032
- Table 96: Australia Ankylosing Spondylitis Treatment Volume (K Unit) Forecast, by Application 2019 & 2032
- Table 97: South Korea Ankylosing Spondylitis Treatment Revenue (Million) Forecast, by Application 2019 & 2032
- Table 98: South Korea Ankylosing Spondylitis Treatment Volume (K Unit) Forecast, by Application 2019 & 2032
- Table 99: Rest of Asia Pacific Ankylosing Spondylitis Treatment Revenue (Million) Forecast, by Application 2019 & 2032
- Table 100: Rest of Asia Pacific Ankylosing Spondylitis Treatment Volume (K Unit) Forecast, by Application 2019 & 2032
- Table 101: Global Ankylosing Spondylitis Treatment Revenue Million Forecast, by Treatment Types 2019 & 2032
- Table 102: Global Ankylosing Spondylitis Treatment Volume K Unit Forecast, by Treatment Types 2019 & 2032
- Table 103: Global Ankylosing Spondylitis Treatment Revenue Million Forecast, by Country 2019 & 2032
- Table 104: Global Ankylosing Spondylitis Treatment Volume K Unit Forecast, by Country 2019 & 2032
- Table 105: GCC Ankylosing Spondylitis Treatment Revenue (Million) Forecast, by Application 2019 & 2032
- Table 106: GCC Ankylosing Spondylitis Treatment Volume (K Unit) Forecast, by Application 2019 & 2032
- Table 107: South Africa Ankylosing Spondylitis Treatment Revenue (Million) Forecast, by Application 2019 & 2032
- Table 108: South Africa Ankylosing Spondylitis Treatment Volume (K Unit) Forecast, by Application 2019 & 2032
- Table 109: Rest of Middle East and Africa Ankylosing Spondylitis Treatment Revenue (Million) Forecast, by Application 2019 & 2032
- Table 110: Rest of Middle East and Africa Ankylosing Spondylitis Treatment Volume (K Unit) Forecast, by Application 2019 & 2032
- Table 111: Global Ankylosing Spondylitis Treatment Revenue Million Forecast, by Treatment Types 2019 & 2032
- Table 112: Global Ankylosing Spondylitis Treatment Volume K Unit Forecast, by Treatment Types 2019 & 2032
- Table 113: Global Ankylosing Spondylitis Treatment Revenue Million Forecast, by Country 2019 & 2032
- Table 114: Global Ankylosing Spondylitis Treatment Volume K Unit Forecast, by Country 2019 & 2032
- Table 115: Brazil Ankylosing Spondylitis Treatment Revenue (Million) Forecast, by Application 2019 & 2032
- Table 116: Brazil Ankylosing Spondylitis Treatment Volume (K Unit) Forecast, by Application 2019 & 2032
- Table 117: Argentina Ankylosing Spondylitis Treatment Revenue (Million) Forecast, by Application 2019 & 2032
- Table 118: Argentina Ankylosing Spondylitis Treatment Volume (K Unit) Forecast, by Application 2019 & 2032
- Table 119: Rest of South America Ankylosing Spondylitis Treatment Revenue (Million) Forecast, by Application 2019 & 2032
- Table 120: Rest of South America Ankylosing Spondylitis Treatment Volume (K Unit) Forecast, by Application 2019 & 2032
Frequently Asked Questions
1. What is the projected Compound Annual Growth Rate (CAGR) of the Ankylosing Spondylitis Treatment?
The projected CAGR is approximately 7.75%.
2. Which companies are prominent players in the Ankylosing Spondylitis Treatment?
Key companies in the market include Boehringer Ingelheim International GmbH, UCB, Amgen Inc, Merck & Co Inc, Eli Lilly and Company, Novartis AG (Sandoz), Celltrion Healthcare, AbbVie Inc, Reliance Life Sciences, Johnson & Johnson Services Inc, Pfizer Inc, Gilead Sciences Inc.
3. What are the main segments of the Ankylosing Spondylitis Treatment?
The market segments include Treatment Types.
4. Can you provide details about the market size?
The market size is estimated to be USD 6.64 Million as of 2022.
5. What are some drivers contributing to market growth?
Growing Burden of Target Diseases and Rising Reimbursements for the Treatment; Research and Development for Effective Treatment.
6. What are the notable trends driving market growth?
Nonsteroidal Anti-Inflammatory Drugs (NSAIDs) Segment is Expected to Hold a Significant Market Share Over the Forecast Period.
7. Are there any restraints impacting market growth?
High Cost of Treatment.
8. Can you provide examples of recent developments in the market?
In August 2023, Simcere Pharmaceutical and Lynk Pharmaceuticals reported positive data from their Phase II clinical trial of LNK01001 for treating ankylosing spondylitis. Simcere and Lynk Pharmaceuticals jointly developed the LNK01001, and in March 2022, they signed a strategic agreement for the development and commercialization of LNK01001.
9. What pricing options are available for accessing the report?
Pricing options include single-user, multi-user, and enterprise licenses priced at USD 4750, USD 5250, and USD 8750 respectively.
10. Is the market size provided in terms of value or volume?
The market size is provided in terms of value, measured in Million and volume, measured in K Unit.
11. Are there any specific market keywords associated with the report?
Yes, the market keyword associated with the report is "Ankylosing Spondylitis Treatment," which aids in identifying and referencing the specific market segment covered.
12. How do I determine which pricing option suits my needs best?
The pricing options vary based on user requirements and access needs. Individual users may opt for single-user licenses, while businesses requiring broader access may choose multi-user or enterprise licenses for cost-effective access to the report.
13. Are there any additional resources or data provided in the Ankylosing Spondylitis Treatment report?
While the report offers comprehensive insights, it's advisable to review the specific contents or supplementary materials provided to ascertain if additional resources or data are available.
14. How can I stay updated on further developments or reports in the Ankylosing Spondylitis Treatment?
To stay informed about further developments, trends, and reports in the Ankylosing Spondylitis Treatment, consider subscribing to industry newsletters, following relevant companies and organizations, or regularly checking reputable industry news sources and publications.
Methodology
Step 1 - Identification of Relevant Samples Size from Population Database


Step 2 - Approaches for Defining Global Market Size (Value, Volume* & Price*)

Note*: In applicable scenarios
Step 3 - Data Sources
Primary Research
- Web Analytics
- Survey Reports
- Research Institute
- Latest Research Reports
- Opinion Leaders
Secondary Research
- Annual Reports
- White Paper
- Latest Press Release
- Industry Association
- Paid Database
- Investor Presentations

Step 4 - Data Triangulation
Involves using different sources of information in order to increase the validity of a study
These sources are likely to be stakeholders in a program - participants, other researchers, program staff, other community members, and so on.
Then we put all data in single framework & apply various statistical tools to find out the dynamic on the market.
During the analysis stage, feedback from the stakeholder groups would be compared to determine areas of agreement as well as areas of divergence
