

Key Insights
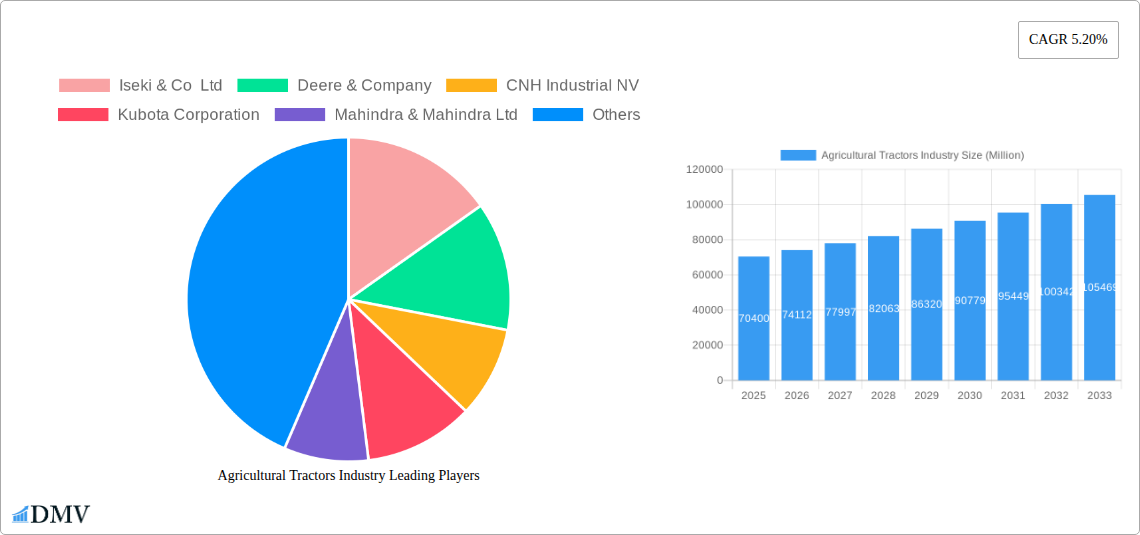
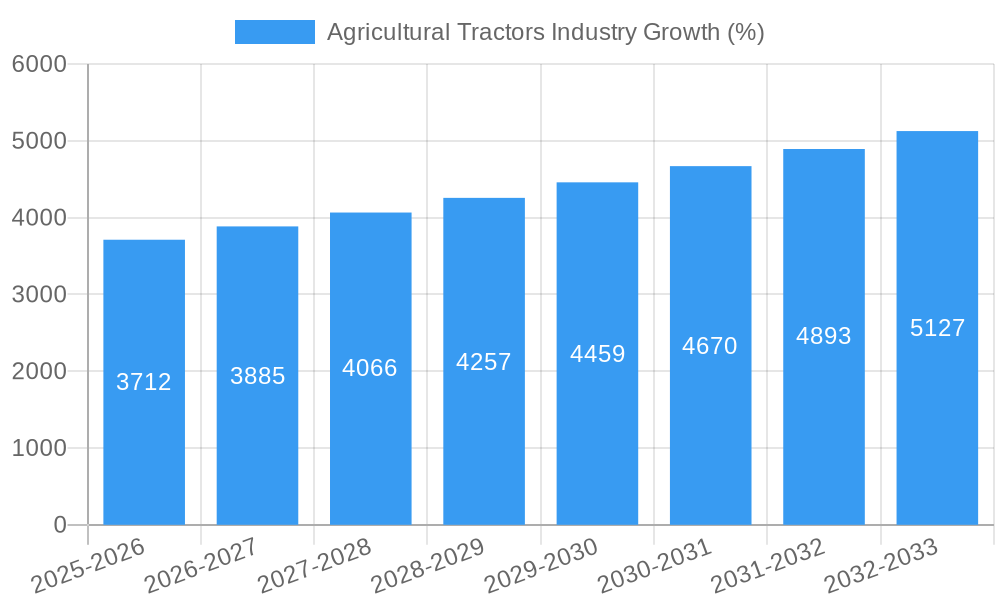
The global agricultural tractors market, valued at $70.40 billion in 2025, is projected to experience robust growth, driven by a Compound Annual Growth Rate (CAGR) of 5.20% from 2025 to 2033. This expansion is fueled by several key factors. Increasing global food demand necessitates higher agricultural output, leading to greater investment in advanced farming technologies, including tractors with enhanced horsepower and features. Precision farming techniques, enabled by GPS-guided tractors and automated systems, are boosting efficiency and yield, further stimulating market growth. Government initiatives promoting agricultural modernization and technological adoption in various regions also contribute significantly. The market is segmented by horsepower (ranging from less than 40 HP to over 350 HP), reflecting the diverse needs of various farming operations, from small-scale to large-scale commercial agriculture. Tractor types, such as orchard tractors and row-crop tractors, cater to specific farming applications. Key players like Deere & Company, Kubota Corporation, and Mahindra & Mahindra Ltd. are driving innovation and competition within the sector, continually improving tractor capabilities and expanding their global reach. Growth is expected to be particularly strong in developing economies experiencing agricultural expansion and modernization.
However, the market faces certain challenges. Fluctuations in commodity prices can impact farmer investment decisions, while rising input costs (fuel, parts, labor) can constrain overall market expansion. Environmental regulations regarding emissions and sustainability may also necessitate technological adjustments and higher production costs for manufacturers. Regional variations in growth will depend on factors such as agricultural infrastructure development, government support policies, and the adoption of mechanization in different farming communities. Nevertheless, the overall trend suggests continued growth in the agricultural tractor market, driven by the fundamental need for increased food production and the ongoing technological advancements within the sector. The market's diverse segmentation and competitive landscape indicate ample opportunities for both established players and new entrants.
Agricultural Tractors Industry Market Report: 2019-2033
This comprehensive report provides a detailed analysis of the global agricultural tractors industry, offering invaluable insights for stakeholders seeking to navigate this dynamic market. The study period covers 2019-2033, with a base year of 2025 and a forecast period of 2025-2033. The report’s robust methodology combines historical data (2019-2024) with advanced forecasting techniques to project future trends accurately. The global market is estimated at $xx Million in 2025.
Agricultural Tractors Industry Market Composition & Trends
This section delves into the intricate structure of the agricultural tractors market, examining key aspects influencing its evolution. We analyze market concentration, revealing the dominant players and their respective market share distribution. For example, Deere & Company and Mahindra & Mahindra Ltd consistently hold significant shares globally, while regional players like Tractors and Farm Equipment Ltd dominate specific markets. We explore the role of innovation, highlighting technological advancements driving efficiency and productivity gains, such as precision farming technologies and autonomous capabilities. The report also examines the regulatory landscape, including emission standards and safety regulations, which significantly impact product design and market access. Substitute products, such as animal power and smaller-scale machinery, and their influence on market demand are also scrutinized. We profile end-users, categorizing them by farm size, crop type, and geographic location to provide a granular understanding of the market's diversity. Finally, the report analyzes mergers and acquisitions (M&A) activities, assessing their impact on market consolidation and competition, including quantifiable data on deal values totaling $xx Million over the historical period.
- Market Concentration: High, with a few dominant players controlling a significant market share.
- Innovation Catalysts: Precision farming technologies, automation, and connectivity.
- Regulatory Landscape: Stringent emission standards and safety regulations.
- Substitute Products: Limited substitutes, but alternative farming practices pose some competition.
- End-User Profiles: Diverse, ranging from smallholder farmers to large-scale agricultural businesses.
- M&A Activities: Significant activity observed over the past years, leading to market consolidation with a total deal value of $xx Million.
Agricultural Tractors Industry Industry Evolution
The agricultural tractors industry has undergone a transformative journey, driven by technological advancements and evolving consumer preferences. The report traces the industry's growth trajectory, analyzing historical and projected growth rates. We've observed a steady, albeit fluctuating, growth pattern over the historical period, primarily influenced by factors such as global food demand, farm mechanization, and government policies. Technological advancements, specifically the integration of GPS, automation, and precision farming technologies, are profoundly impacting the industry, enhancing efficiency and productivity. The adoption rate of these technologies varies regionally, with developed markets showcasing higher adoption rates. Shifting consumer demands for fuel efficiency, lower emissions, and improved operator comfort are significantly influencing product design and development. We provide specific data points showcasing growth rates of xx% annually during the historical period and projecting a xx% CAGR for the forecast period, primarily driven by increased demand from developing economies and the growing adoption of advanced technologies.
Leading Regions, Countries, or Segments in Agricultural Tractors Industry
This section identifies the leading regions, countries, and segments within the agricultural tractors market. Analysis will cover both by horsepower and tractor type, highlighting the dominant players and key drivers in each category.
By Horsepower:
- Lesser than 40 HP: Strong growth in developing countries due to affordability and suitability for small farms. Key drivers include government support programs and increasing demand for small-scale farming solutions.
- 40 HP to 99 HP: A significant market segment, experiencing robust growth across various regions. Investment in agricultural modernization and increasing farm sizes drive this segment.
- 100 HP to 150 HP: High demand in developed and emerging economies due to their versatility. Investments in large-scale farming operations are key drivers.
- 151 HP to 200 HP, 201 HP to 270 HP, 271 HP to 350 HP, Greater than 350 HP: These higher horsepower segments exhibit growth mainly in developed nations and large-scale farms. Technological advancements and economies of scale are crucial drivers.
By Type:
- Orchard Tractors: Specialized tractors, showing steady growth driven by the increasing demand for fruits and horticultural products.
- Row-crop Tractors: A large market segment with substantial growth, fueled by the need for efficient planting and harvesting of row crops.
- Other Types: This segment includes specialized tractors for vineyards, rice paddies, and other niche applications; growth is dictated by specific regional and agricultural trends. The global market is dominated by [Insert dominant region/country], driven by [Explain dominance factors such as strong agricultural sector, government support, and favorable economic conditions].
Agricultural Tractors Industry Product Innovations
Recent years have witnessed significant product innovations, notably the integration of advanced technologies like precision farming, GPS guidance, and automation. Tractors now boast enhanced fuel efficiency, reduced emissions, and improved operator comfort features. Unique selling propositions encompass increased versatility, enhanced productivity, and reduced environmental impact. Technological advancements, such as the incorporation of telematics for remote monitoring and data analysis, have further improved the efficiency and performance of agricultural tractors. This has translated into significant productivity gains and improved operational efficiency for farmers.
Propelling Factors for Agricultural Tractors Industry Growth
Several key factors fuel the growth of the agricultural tractors industry. Technological advancements, particularly in precision farming and automation, boost efficiency and productivity. Economic factors like rising food demand and increased disposable incomes are strong growth drivers. Favorable government policies, including subsidies and support programs, incentivize the adoption of modern agricultural technologies. For example, the substantial investments made in agricultural infrastructure in several developing nations are driving the demand for modern agricultural machinery.
Obstacles in the Agricultural Tractors Industry Market
Despite significant growth potential, the industry faces challenges. Regulatory hurdles, like stringent emission norms, increase production costs. Supply chain disruptions, particularly in the face of global economic uncertainties and geopolitical conflicts, impact production and delivery. Intense competition from established players and new entrants exerts pressure on pricing and margins. These factors significantly influence market dynamics and create a complex operating environment for industry players.
Future Opportunities in Agricultural Tractors Industry
Emerging markets in developing economies present substantial opportunities for growth. The development and adoption of sustainable technologies, such as electric or hybrid tractors, offer significant potential. The increasing demand for data-driven insights in agriculture creates opportunities for innovative solutions leveraging technology. These trends offer promising avenues for future growth and innovation within the agricultural tractors industry.
Major Players in the Agricultural Tractors Industry Ecosystem
- Iseki & Co Ltd
- Deere & Company
- CNH Industrial NV
- Kubota Corporation
- Mahindra & Mahindra Ltd
- Claas KGaA mbH
- Tractors and Farm Equipment Ltd
- AGCO Corporation (Massey Ferguson Limited)
- Yanmar Holdings Co Lt
Key Developments in Agricultural Tractors Industry Industry
- November 2022: VST Tillers Tractors Ltd and ZETOR TRACTORS unveiled two new 45 HP and 50 HP tractors at CII Agro Tech India 2022, signifying collaborative efforts in product development and market expansion.
- July 2021: New Holland North America launched the T7 Heavy-duty Tractor with PLM Intelligence, showcasing technological advancements aimed at enhancing farmer productivity.
- June 2022: Solis Yanmar launched three new below 30 HP tractor models for the Turkish market, highlighting expansion into new geographic regions.
Strategic Agricultural Tractors Industry Market Forecast
The agricultural tractors industry is poised for continued growth, driven by technological innovation, increasing global food demand, and supportive government policies. Emerging markets offer significant untapped potential, while the adoption of sustainable and technologically advanced tractors will reshape the industry landscape. This positive outlook indicates substantial opportunities for industry players to capitalize on the growing demand for efficient and sustainable agricultural solutions. The market is projected to reach $xx Million by 2033.
Agricultural Tractors Industry Segmentation
- 1. Production Analysis
- 2. Consumption Analysis
- 3. Import Market Analysis (Value & Volume)
- 4. Export Market Analysis (Value & Volume)
- 5. Price Trend Analysis
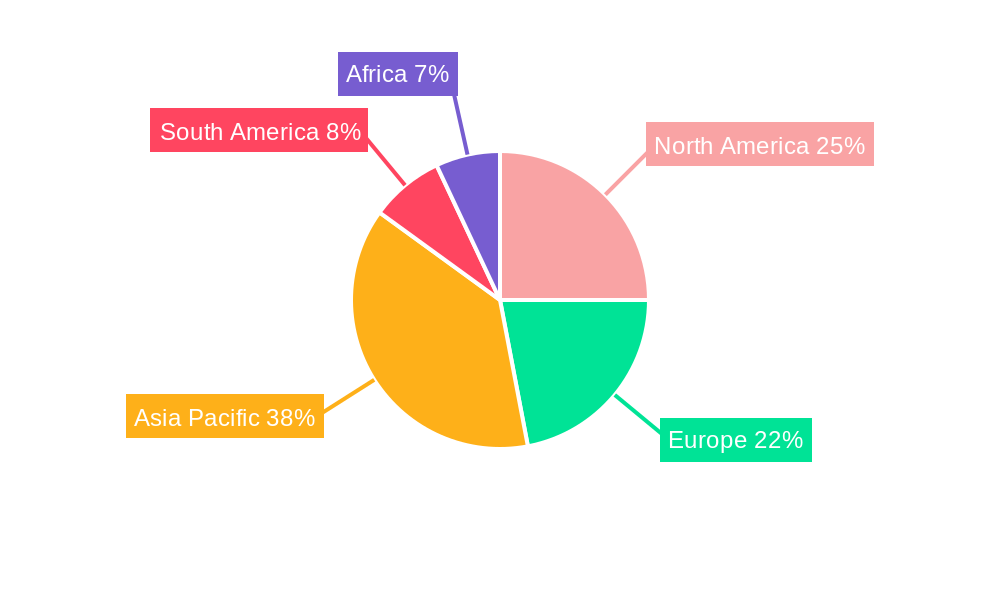
Agricultural Tractors Industry Segmentation By Geography
-
1. North America
- 1.1. United States
- 1.2. Canada
- 1.3. Mexico
-
2. South America
- 2.1. Brazil
- 2.2. Argentina
- 2.3. Rest of South America
-
3. Europe
- 3.1. United Kingdom
- 3.2. Germany
- 3.3. France
- 3.4. Italy
- 3.5. Spain
- 3.6. Russia
- 3.7. Benelux
- 3.8. Nordics
- 3.9. Rest of Europe
-
4. Middle East & Africa
- 4.1. Turkey
- 4.2. Israel
- 4.3. GCC
- 4.4. North Africa
- 4.5. South Africa
- 4.6. Rest of Middle East & Africa
-
5. Asia Pacific
- 5.1. China
- 5.2. India
- 5.3. Japan
- 5.4. South Korea
- 5.5. ASEAN
- 5.6. Oceania
- 5.7. Rest of Asia Pacific
Agricultural Tractors Industry REPORT HIGHLIGHTS
| Aspects | Details |
|---|---|
| Study Period | 2019-2033 |
| Base Year | 2024 |
| Estimated Year | 2025 |
| Forecast Period | 2025-2033 |
| Historical Period | 2019-2024 |
| Growth Rate | CAGR of 5.20% from 2019-2033 |
| Segmentation |
|
Table of Contents
- 1. Introduction
- 1.1. Research Scope
- 1.2. Market Segmentation
- 1.3. Research Methodology
- 1.4. Definitions and Assumptions
- 2. Executive Summary
- 2.1. Introduction
- 3. Market Dynamics
- 3.1. Introduction
- 3.2. Market Drivers
- 3.2.1. Shortage of Skilled Labor; Government Support to Enhance Farm Mechanization
- 3.3. Market Restrains
- 3.3.1. Heavy Initial Procurement Cost and High Expenditure on Maintenance
- 3.4. Market Trends
- 3.4.1. Increasing Farm Mechanization in Developing Markets
- 4. Market Factor Analysis
- 4.1. Porters Five Forces
- 4.2. Supply/Value Chain
- 4.3. PESTEL analysis
- 4.4. Market Entropy
- 4.5. Patent/Trademark Analysis
- 5. Global Agricultural Tractors Industry Analysis, Insights and Forecast, 2019-2031
- 5.1. Market Analysis, Insights and Forecast - by Production Analysis
- 5.2. Market Analysis, Insights and Forecast - by Consumption Analysis
- 5.3. Market Analysis, Insights and Forecast - by Import Market Analysis (Value & Volume)
- 5.4. Market Analysis, Insights and Forecast - by Export Market Analysis (Value & Volume)
- 5.5. Market Analysis, Insights and Forecast - by Price Trend Analysis
- 5.6. Market Analysis, Insights and Forecast - by Region
- 5.6.1. North America
- 5.6.2. South America
- 5.6.3. Europe
- 5.6.4. Middle East & Africa
- 5.6.5. Asia Pacific
- 5.1. Market Analysis, Insights and Forecast - by Production Analysis
- 6. North America Agricultural Tractors Industry Analysis, Insights and Forecast, 2019-2031
- 6.1. Market Analysis, Insights and Forecast - by Production Analysis
- 6.2. Market Analysis, Insights and Forecast - by Consumption Analysis
- 6.3. Market Analysis, Insights and Forecast - by Import Market Analysis (Value & Volume)
- 6.4. Market Analysis, Insights and Forecast - by Export Market Analysis (Value & Volume)
- 6.5. Market Analysis, Insights and Forecast - by Price Trend Analysis
- 6.1. Market Analysis, Insights and Forecast - by Production Analysis
- 7. South America Agricultural Tractors Industry Analysis, Insights and Forecast, 2019-2031
- 7.1. Market Analysis, Insights and Forecast - by Production Analysis
- 7.2. Market Analysis, Insights and Forecast - by Consumption Analysis
- 7.3. Market Analysis, Insights and Forecast - by Import Market Analysis (Value & Volume)
- 7.4. Market Analysis, Insights and Forecast - by Export Market Analysis (Value & Volume)
- 7.5. Market Analysis, Insights and Forecast - by Price Trend Analysis
- 7.1. Market Analysis, Insights and Forecast - by Production Analysis
- 8. Europe Agricultural Tractors Industry Analysis, Insights and Forecast, 2019-2031
- 8.1. Market Analysis, Insights and Forecast - by Production Analysis
- 8.2. Market Analysis, Insights and Forecast - by Consumption Analysis
- 8.3. Market Analysis, Insights and Forecast - by Import Market Analysis (Value & Volume)
- 8.4. Market Analysis, Insights and Forecast - by Export Market Analysis (Value & Volume)
- 8.5. Market Analysis, Insights and Forecast - by Price Trend Analysis
- 8.1. Market Analysis, Insights and Forecast - by Production Analysis
- 9. Middle East & Africa Agricultural Tractors Industry Analysis, Insights and Forecast, 2019-2031
- 9.1. Market Analysis, Insights and Forecast - by Production Analysis
- 9.2. Market Analysis, Insights and Forecast - by Consumption Analysis
- 9.3. Market Analysis, Insights and Forecast - by Import Market Analysis (Value & Volume)
- 9.4. Market Analysis, Insights and Forecast - by Export Market Analysis (Value & Volume)
- 9.5. Market Analysis, Insights and Forecast - by Price Trend Analysis
- 9.1. Market Analysis, Insights and Forecast - by Production Analysis
- 10. Asia Pacific Agricultural Tractors Industry Analysis, Insights and Forecast, 2019-2031
- 10.1. Market Analysis, Insights and Forecast - by Production Analysis
- 10.2. Market Analysis, Insights and Forecast - by Consumption Analysis
- 10.3. Market Analysis, Insights and Forecast - by Import Market Analysis (Value & Volume)
- 10.4. Market Analysis, Insights and Forecast - by Export Market Analysis (Value & Volume)
- 10.5. Market Analysis, Insights and Forecast - by Price Trend Analysis
- 10.1. Market Analysis, Insights and Forecast - by Production Analysis
- 11. North America Agricultural Tractors Industry Analysis, Insights and Forecast, 2019-2031
- 11.1. Market Analysis, Insights and Forecast - By Country/Sub-region
- 11.1.1 United States
- 11.1.2 Canada
- 11.1.3 Mexico
- 11.1.4 Rest of North America
- 12. Europe Agricultural Tractors Industry Analysis, Insights and Forecast, 2019-2031
- 12.1. Market Analysis, Insights and Forecast - By Country/Sub-region
- 12.1.1 Germany
- 12.1.2 United Kingdom
- 12.1.3 France
- 12.1.4 Spain
- 12.1.5 Italy
- 12.1.6 Russia
- 12.1.7 Poland
- 12.1.8 Rest of Europe
- 13. Asia Pacific Agricultural Tractors Industry Analysis, Insights and Forecast, 2019-2031
- 13.1. Market Analysis, Insights and Forecast - By Country/Sub-region
- 13.1.1 China
- 13.1.2 Japan
- 13.1.3 India
- 13.1.4 Australia
- 13.1.5 Rest of Asia Pacific
- 14. South America Agricultural Tractors Industry Analysis, Insights and Forecast, 2019-2031
- 14.1. Market Analysis, Insights and Forecast - By Country/Sub-region
- 14.1.1 Brazil
- 14.1.2 Argentina
- 14.1.3 Rest of South America
- 15. Africa Agricultural Tractors Industry Analysis, Insights and Forecast, 2019-2031
- 15.1. Market Analysis, Insights and Forecast - By Country/Sub-region
- 15.1.1 South Africa
- 15.1.2 Rest of Africa
- 16. Competitive Analysis
- 16.1. Global Market Share Analysis 2024
- 16.2. Company Profiles
- 16.2.1 Iseki & Co Ltd
- 16.2.1.1. Overview
- 16.2.1.2. Products
- 16.2.1.3. SWOT Analysis
- 16.2.1.4. Recent Developments
- 16.2.1.5. Financials (Based on Availability)
- 16.2.2 Deere & Company
- 16.2.2.1. Overview
- 16.2.2.2. Products
- 16.2.2.3. SWOT Analysis
- 16.2.2.4. Recent Developments
- 16.2.2.5. Financials (Based on Availability)
- 16.2.3 CNH Industrial NV
- 16.2.3.1. Overview
- 16.2.3.2. Products
- 16.2.3.3. SWOT Analysis
- 16.2.3.4. Recent Developments
- 16.2.3.5. Financials (Based on Availability)
- 16.2.4 Kubota Corporation
- 16.2.4.1. Overview
- 16.2.4.2. Products
- 16.2.4.3. SWOT Analysis
- 16.2.4.4. Recent Developments
- 16.2.4.5. Financials (Based on Availability)
- 16.2.5 Mahindra & Mahindra Ltd
- 16.2.5.1. Overview
- 16.2.5.2. Products
- 16.2.5.3. SWOT Analysis
- 16.2.5.4. Recent Developments
- 16.2.5.5. Financials (Based on Availability)
- 16.2.6 Claas KGaA mbH
- 16.2.6.1. Overview
- 16.2.6.2. Products
- 16.2.6.3. SWOT Analysis
- 16.2.6.4. Recent Developments
- 16.2.6.5. Financials (Based on Availability)
- 16.2.7 Tractors and Farm Equipment Ltd
- 16.2.7.1. Overview
- 16.2.7.2. Products
- 16.2.7.3. SWOT Analysis
- 16.2.7.4. Recent Developments
- 16.2.7.5. Financials (Based on Availability)
- 16.2.8 AGCO Corporation (Massey Ferguson Limited)
- 16.2.8.1. Overview
- 16.2.8.2. Products
- 16.2.8.3. SWOT Analysis
- 16.2.8.4. Recent Developments
- 16.2.8.5. Financials (Based on Availability)
- 16.2.9 Yanmar Holdings Co Lt
- 16.2.9.1. Overview
- 16.2.9.2. Products
- 16.2.9.3. SWOT Analysis
- 16.2.9.4. Recent Developments
- 16.2.9.5. Financials (Based on Availability)
- 16.2.1 Iseki & Co Ltd
List of Figures
- Figure 1: Global Agricultural Tractors Industry Revenue Breakdown (Million, %) by Region 2024 & 2032
- Figure 2: North America Agricultural Tractors Industry Revenue (Million), by Country 2024 & 2032
- Figure 3: North America Agricultural Tractors Industry Revenue Share (%), by Country 2024 & 2032
- Figure 4: Europe Agricultural Tractors Industry Revenue (Million), by Country 2024 & 2032
- Figure 5: Europe Agricultural Tractors Industry Revenue Share (%), by Country 2024 & 2032
- Figure 6: Asia Pacific Agricultural Tractors Industry Revenue (Million), by Country 2024 & 2032
- Figure 7: Asia Pacific Agricultural Tractors Industry Revenue Share (%), by Country 2024 & 2032
- Figure 8: South America Agricultural Tractors Industry Revenue (Million), by Country 2024 & 2032
- Figure 9: South America Agricultural Tractors Industry Revenue Share (%), by Country 2024 & 2032
- Figure 10: Africa Agricultural Tractors Industry Revenue (Million), by Country 2024 & 2032
- Figure 11: Africa Agricultural Tractors Industry Revenue Share (%), by Country 2024 & 2032
- Figure 12: North America Agricultural Tractors Industry Revenue (Million), by Production Analysis 2024 & 2032
- Figure 13: North America Agricultural Tractors Industry Revenue Share (%), by Production Analysis 2024 & 2032
- Figure 14: North America Agricultural Tractors Industry Revenue (Million), by Consumption Analysis 2024 & 2032
- Figure 15: North America Agricultural Tractors Industry Revenue Share (%), by Consumption Analysis 2024 & 2032
- Figure 16: North America Agricultural Tractors Industry Revenue (Million), by Import Market Analysis (Value & Volume) 2024 & 2032
- Figure 17: North America Agricultural Tractors Industry Revenue Share (%), by Import Market Analysis (Value & Volume) 2024 & 2032
- Figure 18: North America Agricultural Tractors Industry Revenue (Million), by Export Market Analysis (Value & Volume) 2024 & 2032
- Figure 19: North America Agricultural Tractors Industry Revenue Share (%), by Export Market Analysis (Value & Volume) 2024 & 2032
- Figure 20: North America Agricultural Tractors Industry Revenue (Million), by Price Trend Analysis 2024 & 2032
- Figure 21: North America Agricultural Tractors Industry Revenue Share (%), by Price Trend Analysis 2024 & 2032
- Figure 22: North America Agricultural Tractors Industry Revenue (Million), by Country 2024 & 2032
- Figure 23: North America Agricultural Tractors Industry Revenue Share (%), by Country 2024 & 2032
- Figure 24: South America Agricultural Tractors Industry Revenue (Million), by Production Analysis 2024 & 2032
- Figure 25: South America Agricultural Tractors Industry Revenue Share (%), by Production Analysis 2024 & 2032
- Figure 26: South America Agricultural Tractors Industry Revenue (Million), by Consumption Analysis 2024 & 2032
- Figure 27: South America Agricultural Tractors Industry Revenue Share (%), by Consumption Analysis 2024 & 2032
- Figure 28: South America Agricultural Tractors Industry Revenue (Million), by Import Market Analysis (Value & Volume) 2024 & 2032
- Figure 29: South America Agricultural Tractors Industry Revenue Share (%), by Import Market Analysis (Value & Volume) 2024 & 2032
- Figure 30: South America Agricultural Tractors Industry Revenue (Million), by Export Market Analysis (Value & Volume) 2024 & 2032
- Figure 31: South America Agricultural Tractors Industry Revenue Share (%), by Export Market Analysis (Value & Volume) 2024 & 2032
- Figure 32: South America Agricultural Tractors Industry Revenue (Million), by Price Trend Analysis 2024 & 2032
- Figure 33: South America Agricultural Tractors Industry Revenue Share (%), by Price Trend Analysis 2024 & 2032
- Figure 34: South America Agricultural Tractors Industry Revenue (Million), by Country 2024 & 2032
- Figure 35: South America Agricultural Tractors Industry Revenue Share (%), by Country 2024 & 2032
- Figure 36: Europe Agricultural Tractors Industry Revenue (Million), by Production Analysis 2024 & 2032
- Figure 37: Europe Agricultural Tractors Industry Revenue Share (%), by Production Analysis 2024 & 2032
- Figure 38: Europe Agricultural Tractors Industry Revenue (Million), by Consumption Analysis 2024 & 2032
- Figure 39: Europe Agricultural Tractors Industry Revenue Share (%), by Consumption Analysis 2024 & 2032
- Figure 40: Europe Agricultural Tractors Industry Revenue (Million), by Import Market Analysis (Value & Volume) 2024 & 2032
- Figure 41: Europe Agricultural Tractors Industry Revenue Share (%), by Import Market Analysis (Value & Volume) 2024 & 2032
- Figure 42: Europe Agricultural Tractors Industry Revenue (Million), by Export Market Analysis (Value & Volume) 2024 & 2032
- Figure 43: Europe Agricultural Tractors Industry Revenue Share (%), by Export Market Analysis (Value & Volume) 2024 & 2032
- Figure 44: Europe Agricultural Tractors Industry Revenue (Million), by Price Trend Analysis 2024 & 2032
- Figure 45: Europe Agricultural Tractors Industry Revenue Share (%), by Price Trend Analysis 2024 & 2032
- Figure 46: Europe Agricultural Tractors Industry Revenue (Million), by Country 2024 & 2032
- Figure 47: Europe Agricultural Tractors Industry Revenue Share (%), by Country 2024 & 2032
- Figure 48: Middle East & Africa Agricultural Tractors Industry Revenue (Million), by Production Analysis 2024 & 2032
- Figure 49: Middle East & Africa Agricultural Tractors Industry Revenue Share (%), by Production Analysis 2024 & 2032
- Figure 50: Middle East & Africa Agricultural Tractors Industry Revenue (Million), by Consumption Analysis 2024 & 2032
- Figure 51: Middle East & Africa Agricultural Tractors Industry Revenue Share (%), by Consumption Analysis 2024 & 2032
- Figure 52: Middle East & Africa Agricultural Tractors Industry Revenue (Million), by Import Market Analysis (Value & Volume) 2024 & 2032
- Figure 53: Middle East & Africa Agricultural Tractors Industry Revenue Share (%), by Import Market Analysis (Value & Volume) 2024 & 2032
- Figure 54: Middle East & Africa Agricultural Tractors Industry Revenue (Million), by Export Market Analysis (Value & Volume) 2024 & 2032
- Figure 55: Middle East & Africa Agricultural Tractors Industry Revenue Share (%), by Export Market Analysis (Value & Volume) 2024 & 2032
- Figure 56: Middle East & Africa Agricultural Tractors Industry Revenue (Million), by Price Trend Analysis 2024 & 2032
- Figure 57: Middle East & Africa Agricultural Tractors Industry Revenue Share (%), by Price Trend Analysis 2024 & 2032
- Figure 58: Middle East & Africa Agricultural Tractors Industry Revenue (Million), by Country 2024 & 2032
- Figure 59: Middle East & Africa Agricultural Tractors Industry Revenue Share (%), by Country 2024 & 2032
- Figure 60: Asia Pacific Agricultural Tractors Industry Revenue (Million), by Production Analysis 2024 & 2032
- Figure 61: Asia Pacific Agricultural Tractors Industry Revenue Share (%), by Production Analysis 2024 & 2032
- Figure 62: Asia Pacific Agricultural Tractors Industry Revenue (Million), by Consumption Analysis 2024 & 2032
- Figure 63: Asia Pacific Agricultural Tractors Industry Revenue Share (%), by Consumption Analysis 2024 & 2032
- Figure 64: Asia Pacific Agricultural Tractors Industry Revenue (Million), by Import Market Analysis (Value & Volume) 2024 & 2032
- Figure 65: Asia Pacific Agricultural Tractors Industry Revenue Share (%), by Import Market Analysis (Value & Volume) 2024 & 2032
- Figure 66: Asia Pacific Agricultural Tractors Industry Revenue (Million), by Export Market Analysis (Value & Volume) 2024 & 2032
- Figure 67: Asia Pacific Agricultural Tractors Industry Revenue Share (%), by Export Market Analysis (Value & Volume) 2024 & 2032
- Figure 68: Asia Pacific Agricultural Tractors Industry Revenue (Million), by Price Trend Analysis 2024 & 2032
- Figure 69: Asia Pacific Agricultural Tractors Industry Revenue Share (%), by Price Trend Analysis 2024 & 2032
- Figure 70: Asia Pacific Agricultural Tractors Industry Revenue (Million), by Country 2024 & 2032
- Figure 71: Asia Pacific Agricultural Tractors Industry Revenue Share (%), by Country 2024 & 2032
List of Tables
- Table 1: Global Agricultural Tractors Industry Revenue Million Forecast, by Region 2019 & 2032
- Table 2: Global Agricultural Tractors Industry Revenue Million Forecast, by Production Analysis 2019 & 2032
- Table 3: Global Agricultural Tractors Industry Revenue Million Forecast, by Consumption Analysis 2019 & 2032
- Table 4: Global Agricultural Tractors Industry Revenue Million Forecast, by Import Market Analysis (Value & Volume) 2019 & 2032
- Table 5: Global Agricultural Tractors Industry Revenue Million Forecast, by Export Market Analysis (Value & Volume) 2019 & 2032
- Table 6: Global Agricultural Tractors Industry Revenue Million Forecast, by Price Trend Analysis 2019 & 2032
- Table 7: Global Agricultural Tractors Industry Revenue Million Forecast, by Region 2019 & 2032
- Table 8: Global Agricultural Tractors Industry Revenue Million Forecast, by Country 2019 & 2032
- Table 9: United States Agricultural Tractors Industry Revenue (Million) Forecast, by Application 2019 & 2032
- Table 10: Canada Agricultural Tractors Industry Revenue (Million) Forecast, by Application 2019 & 2032
- Table 11: Mexico Agricultural Tractors Industry Revenue (Million) Forecast, by Application 2019 & 2032
- Table 12: Rest of North America Agricultural Tractors Industry Revenue (Million) Forecast, by Application 2019 & 2032
- Table 13: Global Agricultural Tractors Industry Revenue Million Forecast, by Country 2019 & 2032
- Table 14: Germany Agricultural Tractors Industry Revenue (Million) Forecast, by Application 2019 & 2032
- Table 15: United Kingdom Agricultural Tractors Industry Revenue (Million) Forecast, by Application 2019 & 2032
- Table 16: France Agricultural Tractors Industry Revenue (Million) Forecast, by Application 2019 & 2032
- Table 17: Spain Agricultural Tractors Industry Revenue (Million) Forecast, by Application 2019 & 2032
- Table 18: Italy Agricultural Tractors Industry Revenue (Million) Forecast, by Application 2019 & 2032
- Table 19: Russia Agricultural Tractors Industry Revenue (Million) Forecast, by Application 2019 & 2032
- Table 20: Poland Agricultural Tractors Industry Revenue (Million) Forecast, by Application 2019 & 2032
- Table 21: Rest of Europe Agricultural Tractors Industry Revenue (Million) Forecast, by Application 2019 & 2032
- Table 22: Global Agricultural Tractors Industry Revenue Million Forecast, by Country 2019 & 2032
- Table 23: China Agricultural Tractors Industry Revenue (Million) Forecast, by Application 2019 & 2032
- Table 24: Japan Agricultural Tractors Industry Revenue (Million) Forecast, by Application 2019 & 2032
- Table 25: India Agricultural Tractors Industry Revenue (Million) Forecast, by Application 2019 & 2032
- Table 26: Australia Agricultural Tractors Industry Revenue (Million) Forecast, by Application 2019 & 2032
- Table 27: Rest of Asia Pacific Agricultural Tractors Industry Revenue (Million) Forecast, by Application 2019 & 2032
- Table 28: Global Agricultural Tractors Industry Revenue Million Forecast, by Country 2019 & 2032
- Table 29: Brazil Agricultural Tractors Industry Revenue (Million) Forecast, by Application 2019 & 2032
- Table 30: Argentina Agricultural Tractors Industry Revenue (Million) Forecast, by Application 2019 & 2032
- Table 31: Rest of South America Agricultural Tractors Industry Revenue (Million) Forecast, by Application 2019 & 2032
- Table 32: Global Agricultural Tractors Industry Revenue Million Forecast, by Country 2019 & 2032
- Table 33: South Africa Agricultural Tractors Industry Revenue (Million) Forecast, by Application 2019 & 2032
- Table 34: Rest of Africa Agricultural Tractors Industry Revenue (Million) Forecast, by Application 2019 & 2032
- Table 35: Global Agricultural Tractors Industry Revenue Million Forecast, by Production Analysis 2019 & 2032
- Table 36: Global Agricultural Tractors Industry Revenue Million Forecast, by Consumption Analysis 2019 & 2032
- Table 37: Global Agricultural Tractors Industry Revenue Million Forecast, by Import Market Analysis (Value & Volume) 2019 & 2032
- Table 38: Global Agricultural Tractors Industry Revenue Million Forecast, by Export Market Analysis (Value & Volume) 2019 & 2032
- Table 39: Global Agricultural Tractors Industry Revenue Million Forecast, by Price Trend Analysis 2019 & 2032
- Table 40: Global Agricultural Tractors Industry Revenue Million Forecast, by Country 2019 & 2032
- Table 41: United States Agricultural Tractors Industry Revenue (Million) Forecast, by Application 2019 & 2032
- Table 42: Canada Agricultural Tractors Industry Revenue (Million) Forecast, by Application 2019 & 2032
- Table 43: Mexico Agricultural Tractors Industry Revenue (Million) Forecast, by Application 2019 & 2032
- Table 44: Global Agricultural Tractors Industry Revenue Million Forecast, by Production Analysis 2019 & 2032
- Table 45: Global Agricultural Tractors Industry Revenue Million Forecast, by Consumption Analysis 2019 & 2032
- Table 46: Global Agricultural Tractors Industry Revenue Million Forecast, by Import Market Analysis (Value & Volume) 2019 & 2032
- Table 47: Global Agricultural Tractors Industry Revenue Million Forecast, by Export Market Analysis (Value & Volume) 2019 & 2032
- Table 48: Global Agricultural Tractors Industry Revenue Million Forecast, by Price Trend Analysis 2019 & 2032
- Table 49: Global Agricultural Tractors Industry Revenue Million Forecast, by Country 2019 & 2032
- Table 50: Brazil Agricultural Tractors Industry Revenue (Million) Forecast, by Application 2019 & 2032
- Table 51: Argentina Agricultural Tractors Industry Revenue (Million) Forecast, by Application 2019 & 2032
- Table 52: Rest of South America Agricultural Tractors Industry Revenue (Million) Forecast, by Application 2019 & 2032
- Table 53: Global Agricultural Tractors Industry Revenue Million Forecast, by Production Analysis 2019 & 2032
- Table 54: Global Agricultural Tractors Industry Revenue Million Forecast, by Consumption Analysis 2019 & 2032
- Table 55: Global Agricultural Tractors Industry Revenue Million Forecast, by Import Market Analysis (Value & Volume) 2019 & 2032
- Table 56: Global Agricultural Tractors Industry Revenue Million Forecast, by Export Market Analysis (Value & Volume) 2019 & 2032
- Table 57: Global Agricultural Tractors Industry Revenue Million Forecast, by Price Trend Analysis 2019 & 2032
- Table 58: Global Agricultural Tractors Industry Revenue Million Forecast, by Country 2019 & 2032
- Table 59: United Kingdom Agricultural Tractors Industry Revenue (Million) Forecast, by Application 2019 & 2032
- Table 60: Germany Agricultural Tractors Industry Revenue (Million) Forecast, by Application 2019 & 2032
- Table 61: France Agricultural Tractors Industry Revenue (Million) Forecast, by Application 2019 & 2032
- Table 62: Italy Agricultural Tractors Industry Revenue (Million) Forecast, by Application 2019 & 2032
- Table 63: Spain Agricultural Tractors Industry Revenue (Million) Forecast, by Application 2019 & 2032
- Table 64: Russia Agricultural Tractors Industry Revenue (Million) Forecast, by Application 2019 & 2032
- Table 65: Benelux Agricultural Tractors Industry Revenue (Million) Forecast, by Application 2019 & 2032
- Table 66: Nordics Agricultural Tractors Industry Revenue (Million) Forecast, by Application 2019 & 2032
- Table 67: Rest of Europe Agricultural Tractors Industry Revenue (Million) Forecast, by Application 2019 & 2032
- Table 68: Global Agricultural Tractors Industry Revenue Million Forecast, by Production Analysis 2019 & 2032
- Table 69: Global Agricultural Tractors Industry Revenue Million Forecast, by Consumption Analysis 2019 & 2032
- Table 70: Global Agricultural Tractors Industry Revenue Million Forecast, by Import Market Analysis (Value & Volume) 2019 & 2032
- Table 71: Global Agricultural Tractors Industry Revenue Million Forecast, by Export Market Analysis (Value & Volume) 2019 & 2032
- Table 72: Global Agricultural Tractors Industry Revenue Million Forecast, by Price Trend Analysis 2019 & 2032
- Table 73: Global Agricultural Tractors Industry Revenue Million Forecast, by Country 2019 & 2032
- Table 74: Turkey Agricultural Tractors Industry Revenue (Million) Forecast, by Application 2019 & 2032
- Table 75: Israel Agricultural Tractors Industry Revenue (Million) Forecast, by Application 2019 & 2032
- Table 76: GCC Agricultural Tractors Industry Revenue (Million) Forecast, by Application 2019 & 2032
- Table 77: North Africa Agricultural Tractors Industry Revenue (Million) Forecast, by Application 2019 & 2032
- Table 78: South Africa Agricultural Tractors Industry Revenue (Million) Forecast, by Application 2019 & 2032
- Table 79: Rest of Middle East & Africa Agricultural Tractors Industry Revenue (Million) Forecast, by Application 2019 & 2032
- Table 80: Global Agricultural Tractors Industry Revenue Million Forecast, by Production Analysis 2019 & 2032
- Table 81: Global Agricultural Tractors Industry Revenue Million Forecast, by Consumption Analysis 2019 & 2032
- Table 82: Global Agricultural Tractors Industry Revenue Million Forecast, by Import Market Analysis (Value & Volume) 2019 & 2032
- Table 83: Global Agricultural Tractors Industry Revenue Million Forecast, by Export Market Analysis (Value & Volume) 2019 & 2032
- Table 84: Global Agricultural Tractors Industry Revenue Million Forecast, by Price Trend Analysis 2019 & 2032
- Table 85: Global Agricultural Tractors Industry Revenue Million Forecast, by Country 2019 & 2032
- Table 86: China Agricultural Tractors Industry Revenue (Million) Forecast, by Application 2019 & 2032
- Table 87: India Agricultural Tractors Industry Revenue (Million) Forecast, by Application 2019 & 2032
- Table 88: Japan Agricultural Tractors Industry Revenue (Million) Forecast, by Application 2019 & 2032
- Table 89: South Korea Agricultural Tractors Industry Revenue (Million) Forecast, by Application 2019 & 2032
- Table 90: ASEAN Agricultural Tractors Industry Revenue (Million) Forecast, by Application 2019 & 2032
- Table 91: Oceania Agricultural Tractors Industry Revenue (Million) Forecast, by Application 2019 & 2032
- Table 92: Rest of Asia Pacific Agricultural Tractors Industry Revenue (Million) Forecast, by Application 2019 & 2032
Frequently Asked Questions
1. What is the projected Compound Annual Growth Rate (CAGR) of the Agricultural Tractors Industry?
The projected CAGR is approximately 5.20%.
2. Which companies are prominent players in the Agricultural Tractors Industry?
Key companies in the market include Iseki & Co Ltd, Deere & Company, CNH Industrial NV, Kubota Corporation, Mahindra & Mahindra Ltd, Claas KGaA mbH, Tractors and Farm Equipment Ltd, AGCO Corporation (Massey Ferguson Limited), Yanmar Holdings Co Lt.
3. What are the main segments of the Agricultural Tractors Industry?
The market segments include Production Analysis, Consumption Analysis, Import Market Analysis (Value & Volume), Export Market Analysis (Value & Volume), Price Trend Analysis.
4. Can you provide details about the market size?
The market size is estimated to be USD 70.40 Million as of 2022.
5. What are some drivers contributing to market growth?
Shortage of Skilled Labor; Government Support to Enhance Farm Mechanization.
6. What are the notable trends driving market growth?
Increasing Farm Mechanization in Developing Markets.
7. Are there any restraints impacting market growth?
Heavy Initial Procurement Cost and High Expenditure on Maintenance.
8. Can you provide examples of recent developments in the market?
November 2022: VST Tillers Tractors Ltd and ZETOR TRACTORS unveiled two best-in-class tractors at the CII Agro Tech India 2022 exhibition. These 45 HP and 50 HP category tractors are jointly developed by VST & ZETOR at their India & Czech Republic plants.
9. What pricing options are available for accessing the report?
Pricing options include single-user, multi-user, and enterprise licenses priced at USD 4750, USD 5250, and USD 8750 respectively.
10. Is the market size provided in terms of value or volume?
The market size is provided in terms of value, measured in Million.
11. Are there any specific market keywords associated with the report?
Yes, the market keyword associated with the report is "Agricultural Tractors Industry," which aids in identifying and referencing the specific market segment covered.
12. How do I determine which pricing option suits my needs best?
The pricing options vary based on user requirements and access needs. Individual users may opt for single-user licenses, while businesses requiring broader access may choose multi-user or enterprise licenses for cost-effective access to the report.
13. Are there any additional resources or data provided in the Agricultural Tractors Industry report?
While the report offers comprehensive insights, it's advisable to review the specific contents or supplementary materials provided to ascertain if additional resources or data are available.
14. How can I stay updated on further developments or reports in the Agricultural Tractors Industry?
To stay informed about further developments, trends, and reports in the Agricultural Tractors Industry, consider subscribing to industry newsletters, following relevant companies and organizations, or regularly checking reputable industry news sources and publications.
Methodology
Step 1 - Identification of Relevant Samples Size from Population Database


Step 2 - Approaches for Defining Global Market Size (Value, Volume* & Price*)

Note*: In applicable scenarios
Step 3 - Data Sources
Primary Research
- Web Analytics
- Survey Reports
- Research Institute
- Latest Research Reports
- Opinion Leaders
Secondary Research
- Annual Reports
- White Paper
- Latest Press Release
- Industry Association
- Paid Database
- Investor Presentations

Step 4 - Data Triangulation
Involves using different sources of information in order to increase the validity of a study
These sources are likely to be stakeholders in a program - participants, other researchers, program staff, other community members, and so on.
Then we put all data in single framework & apply various statistical tools to find out the dynamic on the market.
During the analysis stage, feedback from the stakeholder groups would be compared to determine areas of agreement as well as areas of divergence
