

Key Insights
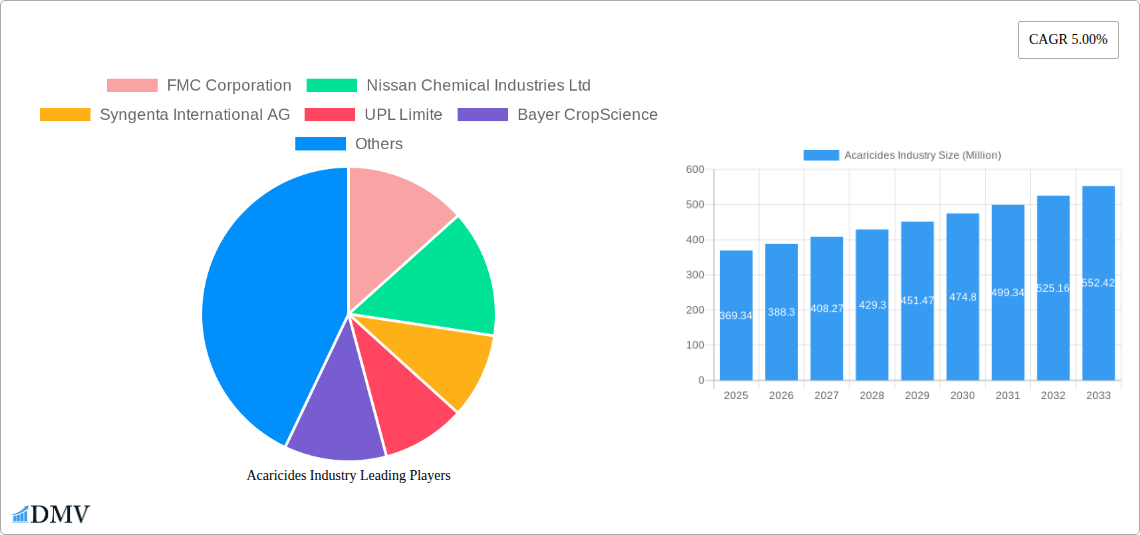
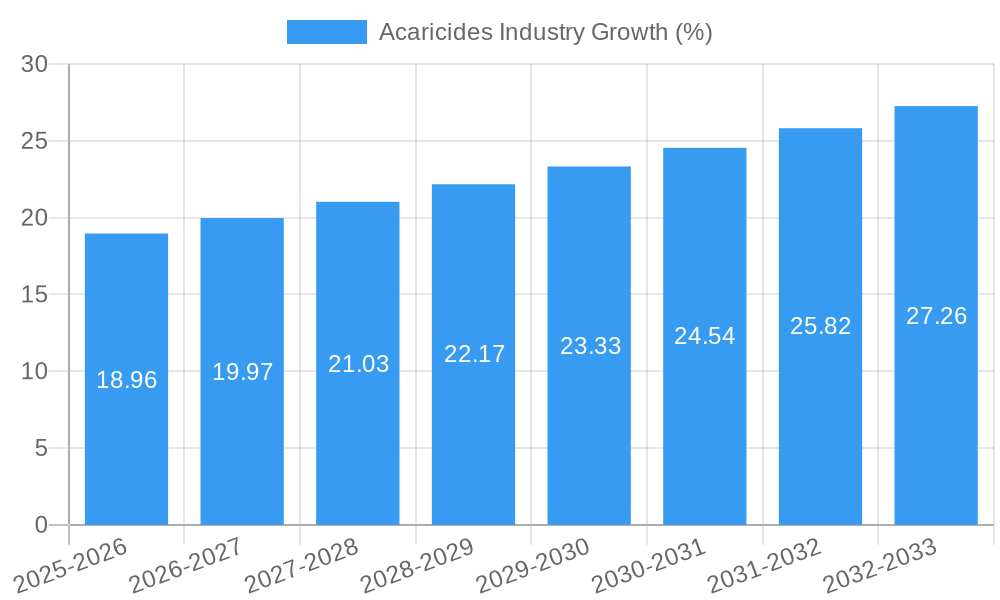
The global acaricide market, valued at $369.34 million in 2025, is projected to experience robust growth, driven by a compound annual growth rate (CAGR) of 5.00% from 2025 to 2033. This expansion is fueled by several key factors. The increasing prevalence of acaricide-resistant mite species necessitates the development and adoption of novel acaricide formulations, stimulating market growth. Furthermore, the expanding agricultural sector, particularly in developing economies experiencing agricultural intensification, creates a strong demand for effective acaricide solutions to protect crops and livestock. The growing awareness of vector-borne diseases transmitted by mites also contributes to increased acaricide usage in public health initiatives. Market segmentation reveals a diverse landscape, with organophosphates, carbamates, pyrethroids, and other chemical types dominating the market based on their effectiveness and cost-efficiency. Application-wise, spray application currently holds the largest market share due to its convenience and broad coverage, but hand dressing and dipping methods remain crucial for specific applications. Major players like FMC Corporation, Syngenta, and Bayer are driving innovation through the development of safer and more effective acaricide products, shaping the competitive landscape. However, stringent regulatory frameworks regarding pesticide usage and growing concerns about environmental impact represent significant restraints to market growth, prompting the development of bio-acaricides and integrated pest management strategies.
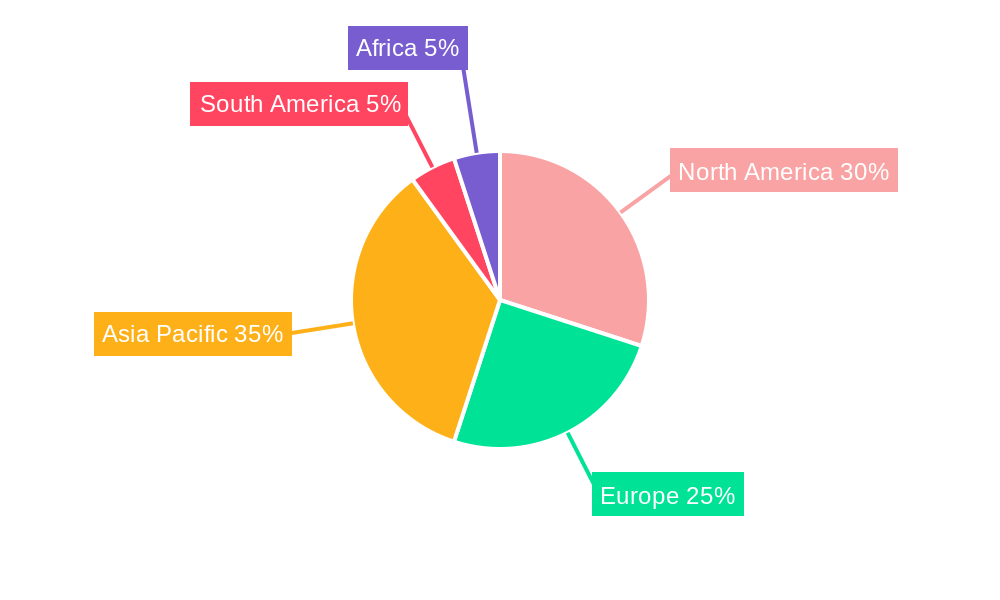
The regional distribution of the acaricide market reflects global agricultural patterns and disease prevalence. North America and Europe are expected to maintain significant market shares due to established agricultural practices and high levels of awareness regarding pest management. However, the Asia-Pacific region is projected to witness the most significant growth, driven by rapid agricultural expansion and increasing demand for food security. South America and Africa represent markets with considerable growth potential, although regulatory landscapes and infrastructure limitations might influence the pace of adoption. The forecast period (2025-2033) presents opportunities for acaricide manufacturers to innovate in product formulation, delivery systems, and sustainable solutions, catering to the diverse needs of various regions and agricultural sectors. The market is expected to witness consolidation among existing players and the emergence of new entrants focusing on eco-friendly and highly effective acaricide products.
Acaricides Industry Market Report: 2019-2033 Forecast
This comprehensive report provides a detailed analysis of the global Acaricides industry, offering invaluable insights for stakeholders seeking to navigate this dynamic market. From market size and segmentation to key players and future trends, this report delivers a 360-degree view, empowering informed decision-making. The study period covers 2019-2033, with a base year of 2025 and a forecast period of 2025-2033. The report leverages extensive data analysis to provide precise forecasts and identifies crucial opportunities and challenges in the Acaricides market, worth an estimated xx Million in 2025.
Acaricides Industry Market Composition & Trends
This section delves into the competitive landscape of the Acaricides industry, analyzing market concentration, innovation drivers, regulatory hurdles, substitute products, end-user profiles, and M&A activities. The market is moderately concentrated, with key players such as FMC Corporation, Nissan Chemical Industries Ltd, Syngenta International AG, UPL Limited, Bayer CropScience, Corteva Agriscience, and BASF SE holding significant market share. The total market value in 2025 is estimated at xx Million.
- Market Share Distribution: FMC Corporation holds an estimated xx% market share, followed by Syngenta International AG at xx%, and other players sharing the remaining percentage.
- M&A Activity: The period 2019-2024 witnessed significant M&A activity, with a total deal value exceeding xx Million. Consolidation is expected to continue, driving further industry restructuring.
- Innovation Catalysts: Growing demand for high-efficacy, environmentally friendly acaricides is pushing innovation in areas such as targeted delivery systems and biopesticides.
- Regulatory Landscape: Stringent regulations concerning pesticide use and environmental protection are influencing product development and market access.
- Substitute Products: The availability of alternative pest control methods, such as biological control and integrated pest management (IPM), presents a competitive challenge.
- End-User Profiles: The primary end-users are agricultural farms, followed by horticultural businesses and other specialized applications.
Acaricides Industry Evolution
This section provides a thorough analysis of the Acaricides market's historical growth trajectory (2019-2024), technological advancements, and evolving consumer preferences. The market experienced a Compound Annual Growth Rate (CAGR) of xx% during the historical period, primarily driven by increasing crop production and the rising incidence of mite infestations. Technological advancements, such as the development of novel chemical formulations and targeted delivery systems, are further accelerating market growth. Consumer demand is shifting towards safer, more environmentally sustainable acaricides.
Leading Regions, Countries, or Segments in Acaricides Industry
This section identifies the leading regions, countries, and segments within the Acaricides market. While precise market share breakdowns for each segment aren't available for this description, we anticipate significant regional variations.
Dominant Regions/Countries: (Analysis based on projected market share, with more precise data within the full report) Asia-Pacific and North America are predicted to be the dominant regions due to factors such as extensive agricultural practices and a growing demand for high-yield crops. Within these regions, specific countries like China and the United States are expected to represent substantial market segments.
Dominant Chemical Types: Pyrethroids and Organophosphates are projected to be the leading chemical types due to their widespread efficacy and established market presence.
Dominant Applications: Spray application is anticipated to be the dominant application method due to its ease of use and widespread applicability across various crops and settings.
- Key Drivers for Dominance:
- High Crop Yields: Demand for increased agricultural output fuels acaricides usage.
- Favorable Regulatory Environments: Supportive regulations in certain regions accelerate market penetration.
- Investment in Agricultural Technology: Investments in precision agriculture increase demand for effective pest management solutions, including acaricides.
- Growing Awareness of Pest Management: Increasing awareness among farmers about effective pest control drives adoption.
Acaricides Industry Product Innovations
Recent innovations include the development of novel formulations that enhance efficacy and reduce environmental impact. These include microencapsulated formulations that provide extended residual control and targeted delivery systems that minimize off-target effects. The development of biopesticides and other environmentally friendly acaricides is gaining momentum, driven by increasing consumer preference for sustainable pest control solutions. Many products emphasize extended residual efficacy and reduced application frequency, improving overall cost-effectiveness for users.
Propelling Factors for Acaricides Industry Growth
Several factors contribute to the growth of the Acaricides market. Increased global food demand drives the need for efficient pest management, fueling the adoption of acaricides. Technological advancements leading to more effective and sustainable products also contribute. Finally, favorable government regulations in some regions actively support the use of specific acaricides to protect crop yields.
Obstacles in the Acaricides Industry Market
Stringent environmental regulations and growing concerns about pesticide residues pose significant challenges. Supply chain disruptions can lead to price volatility and shortages. Intense competition among established players and the emergence of biopesticide alternatives create a challenging market environment. These factors could cumulatively impact market growth by xx Million within the forecast period.
Future Opportunities in Acaricides Industry
Emerging markets, particularly in developing economies, offer significant growth potential. Advances in nanotechnology and biotechnology are creating innovative acaricides with enhanced efficacy and reduced environmental impact. The development of integrated pest management strategies, combining acaricides with other pest control methods, presents promising opportunities.
Major Players in the Acaricides Industry Ecosystem
- FMC Corporation
- Nissan Chemical Industries Ltd
- Syngenta International AG
- UPL Limited
- Bayer CropScience
- Corteva Agriscience
- BASF SE
Key Developments in Acaricides Industry Industry
- 2022 Q3: FMC Corporation launched a new line of environmentally friendly acaricides.
- 2023 Q1: Syngenta International AG announced a strategic partnership to expand its acaricides portfolio.
- 2024 Q2: A significant merger occurred within the industry, consolidating market share. (Specific details within the full report).
Strategic Acaricides Industry Market Forecast
The Acaricides market is poised for sustained growth, driven by factors such as increasing global food demand, technological advancements, and favorable regulatory support in certain key regions. Opportunities lie in the development of novel formulations, biopesticides, and integrated pest management strategies. The market is projected to reach xx Million by 2033, representing significant growth potential for stakeholders.
Acaricides Industry Segmentation
- 1. Production Analysis
- 2. Consumption Analysis
- 3. Import Market Analysis (Value & Volume)
- 4. Export Market Analysis (Value & Volume)
- 5. Price Trend Analysis
Acaricides Industry Segmentation By Geography
-
1. North America
- 1.1. United States
- 1.2. Canada
- 1.3. Mexico
-
2. South America
- 2.1. Brazil
- 2.2. Argentina
- 2.3. Rest of South America
-
3. Europe
- 3.1. United Kingdom
- 3.2. Germany
- 3.3. France
- 3.4. Italy
- 3.5. Spain
- 3.6. Russia
- 3.7. Benelux
- 3.8. Nordics
- 3.9. Rest of Europe
-
4. Middle East & Africa
- 4.1. Turkey
- 4.2. Israel
- 4.3. GCC
- 4.4. North Africa
- 4.5. South Africa
- 4.6. Rest of Middle East & Africa
-
5. Asia Pacific
- 5.1. China
- 5.2. India
- 5.3. Japan
- 5.4. South Korea
- 5.5. ASEAN
- 5.6. Oceania
- 5.7. Rest of Asia Pacific
Acaricides Industry REPORT HIGHLIGHTS
| Aspects | Details |
|---|---|
| Study Period | 2019-2033 |
| Base Year | 2024 |
| Estimated Year | 2025 |
| Forecast Period | 2025-2033 |
| Historical Period | 2019-2024 |
| Growth Rate | CAGR of 5.00% from 2019-2033 |
| Segmentation |
|
Table of Contents
- 1. Introduction
- 1.1. Research Scope
- 1.2. Market Segmentation
- 1.3. Research Methodology
- 1.4. Definitions and Assumptions
- 2. Executive Summary
- 2.1. Introduction
- 3. Market Dynamics
- 3.1. Introduction
- 3.2. Market Drivers
- 3.2.1. Shortage of Skilled Labor; Government Support to Enhance Farm Mechanization
- 3.3. Market Restrains
- 3.3.1. Heavy Initial Procurement Cost and High Expenditure on Maintenance
- 3.4. Market Trends
- 3.4.1. Increasing Demand for Natural Products
- 4. Market Factor Analysis
- 4.1. Porters Five Forces
- 4.2. Supply/Value Chain
- 4.3. PESTEL analysis
- 4.4. Market Entropy
- 4.5. Patent/Trademark Analysis
- 5. Global Acaricides Industry Analysis, Insights and Forecast, 2019-2031
- 5.1. Market Analysis, Insights and Forecast - by Production Analysis
- 5.2. Market Analysis, Insights and Forecast - by Consumption Analysis
- 5.3. Market Analysis, Insights and Forecast - by Import Market Analysis (Value & Volume)
- 5.4. Market Analysis, Insights and Forecast - by Export Market Analysis (Value & Volume)
- 5.5. Market Analysis, Insights and Forecast - by Price Trend Analysis
- 5.6. Market Analysis, Insights and Forecast - by Region
- 5.6.1. North America
- 5.6.2. South America
- 5.6.3. Europe
- 5.6.4. Middle East & Africa
- 5.6.5. Asia Pacific
- 5.1. Market Analysis, Insights and Forecast - by Production Analysis
- 6. North America Acaricides Industry Analysis, Insights and Forecast, 2019-2031
- 6.1. Market Analysis, Insights and Forecast - by Production Analysis
- 6.2. Market Analysis, Insights and Forecast - by Consumption Analysis
- 6.3. Market Analysis, Insights and Forecast - by Import Market Analysis (Value & Volume)
- 6.4. Market Analysis, Insights and Forecast - by Export Market Analysis (Value & Volume)
- 6.5. Market Analysis, Insights and Forecast - by Price Trend Analysis
- 6.1. Market Analysis, Insights and Forecast - by Production Analysis
- 7. South America Acaricides Industry Analysis, Insights and Forecast, 2019-2031
- 7.1. Market Analysis, Insights and Forecast - by Production Analysis
- 7.2. Market Analysis, Insights and Forecast - by Consumption Analysis
- 7.3. Market Analysis, Insights and Forecast - by Import Market Analysis (Value & Volume)
- 7.4. Market Analysis, Insights and Forecast - by Export Market Analysis (Value & Volume)
- 7.5. Market Analysis, Insights and Forecast - by Price Trend Analysis
- 7.1. Market Analysis, Insights and Forecast - by Production Analysis
- 8. Europe Acaricides Industry Analysis, Insights and Forecast, 2019-2031
- 8.1. Market Analysis, Insights and Forecast - by Production Analysis
- 8.2. Market Analysis, Insights and Forecast - by Consumption Analysis
- 8.3. Market Analysis, Insights and Forecast - by Import Market Analysis (Value & Volume)
- 8.4. Market Analysis, Insights and Forecast - by Export Market Analysis (Value & Volume)
- 8.5. Market Analysis, Insights and Forecast - by Price Trend Analysis
- 8.1. Market Analysis, Insights and Forecast - by Production Analysis
- 9. Middle East & Africa Acaricides Industry Analysis, Insights and Forecast, 2019-2031
- 9.1. Market Analysis, Insights and Forecast - by Production Analysis
- 9.2. Market Analysis, Insights and Forecast - by Consumption Analysis
- 9.3. Market Analysis, Insights and Forecast - by Import Market Analysis (Value & Volume)
- 9.4. Market Analysis, Insights and Forecast - by Export Market Analysis (Value & Volume)
- 9.5. Market Analysis, Insights and Forecast - by Price Trend Analysis
- 9.1. Market Analysis, Insights and Forecast - by Production Analysis
- 10. Asia Pacific Acaricides Industry Analysis, Insights and Forecast, 2019-2031
- 10.1. Market Analysis, Insights and Forecast - by Production Analysis
- 10.2. Market Analysis, Insights and Forecast - by Consumption Analysis
- 10.3. Market Analysis, Insights and Forecast - by Import Market Analysis (Value & Volume)
- 10.4. Market Analysis, Insights and Forecast - by Export Market Analysis (Value & Volume)
- 10.5. Market Analysis, Insights and Forecast - by Price Trend Analysis
- 10.1. Market Analysis, Insights and Forecast - by Production Analysis
- 11. North America Acaricides Industry Analysis, Insights and Forecast, 2019-2031
- 11.1. Market Analysis, Insights and Forecast - By Country/Sub-region
- 11.1.1 United States
- 11.1.2 Canada
- 11.1.3 Mexico
- 11.1.4 Rest of North America
- 12. Europe Acaricides Industry Analysis, Insights and Forecast, 2019-2031
- 12.1. Market Analysis, Insights and Forecast - By Country/Sub-region
- 12.1.1 Germany
- 12.1.2 United Kingdom
- 12.1.3 Spain
- 12.1.4 France
- 12.1.5 Italy
- 12.1.6 Russia
- 12.1.7 Rest of Europe
- 13. Asia Pacific Acaricides Industry Analysis, Insights and Forecast, 2019-2031
- 13.1. Market Analysis, Insights and Forecast - By Country/Sub-region
- 13.1.1 China
- 13.1.2 India
- 13.1.3 Japan
- 13.1.4 Australia
- 13.1.5 Rest of Asia Pacific
- 14. South America Acaricides Industry Analysis, Insights and Forecast, 2019-2031
- 14.1. Market Analysis, Insights and Forecast - By Country/Sub-region
- 14.1.1 Brazil
- 14.1.2 Argentina
- 14.1.3 Rest of South America
- 15. Africa Acaricides Industry Analysis, Insights and Forecast, 2019-2031
- 15.1. Market Analysis, Insights and Forecast - By Country/Sub-region
- 15.1.1 South Africa
- 15.1.2 Rest of Africa
- 16. Competitive Analysis
- 16.1. Global Market Share Analysis 2024
- 16.2. Company Profiles
- 16.2.1 FMC Corporation
- 16.2.1.1. Overview
- 16.2.1.2. Products
- 16.2.1.3. SWOT Analysis
- 16.2.1.4. Recent Developments
- 16.2.1.5. Financials (Based on Availability)
- 16.2.2 Nissan Chemical Industries Ltd
- 16.2.2.1. Overview
- 16.2.2.2. Products
- 16.2.2.3. SWOT Analysis
- 16.2.2.4. Recent Developments
- 16.2.2.5. Financials (Based on Availability)
- 16.2.3 Syngenta International AG
- 16.2.3.1. Overview
- 16.2.3.2. Products
- 16.2.3.3. SWOT Analysis
- 16.2.3.4. Recent Developments
- 16.2.3.5. Financials (Based on Availability)
- 16.2.4 UPL Limite
- 16.2.4.1. Overview
- 16.2.4.2. Products
- 16.2.4.3. SWOT Analysis
- 16.2.4.4. Recent Developments
- 16.2.4.5. Financials (Based on Availability)
- 16.2.5 Bayer CropScience
- 16.2.5.1. Overview
- 16.2.5.2. Products
- 16.2.5.3. SWOT Analysis
- 16.2.5.4. Recent Developments
- 16.2.5.5. Financials (Based on Availability)
- 16.2.6 Corteva Agriscience
- 16.2.6.1. Overview
- 16.2.6.2. Products
- 16.2.6.3. SWOT Analysis
- 16.2.6.4. Recent Developments
- 16.2.6.5. Financials (Based on Availability)
- 16.2.7 BASF SE
- 16.2.7.1. Overview
- 16.2.7.2. Products
- 16.2.7.3. SWOT Analysis
- 16.2.7.4. Recent Developments
- 16.2.7.5. Financials (Based on Availability)
- 16.2.1 FMC Corporation
List of Figures
- Figure 1: Global Acaricides Industry Revenue Breakdown (Million, %) by Region 2024 & 2032
- Figure 2: North America Acaricides Industry Revenue (Million), by Country 2024 & 2032
- Figure 3: North America Acaricides Industry Revenue Share (%), by Country 2024 & 2032
- Figure 4: Europe Acaricides Industry Revenue (Million), by Country 2024 & 2032
- Figure 5: Europe Acaricides Industry Revenue Share (%), by Country 2024 & 2032
- Figure 6: Asia Pacific Acaricides Industry Revenue (Million), by Country 2024 & 2032
- Figure 7: Asia Pacific Acaricides Industry Revenue Share (%), by Country 2024 & 2032
- Figure 8: South America Acaricides Industry Revenue (Million), by Country 2024 & 2032
- Figure 9: South America Acaricides Industry Revenue Share (%), by Country 2024 & 2032
- Figure 10: Africa Acaricides Industry Revenue (Million), by Country 2024 & 2032
- Figure 11: Africa Acaricides Industry Revenue Share (%), by Country 2024 & 2032
- Figure 12: North America Acaricides Industry Revenue (Million), by Production Analysis 2024 & 2032
- Figure 13: North America Acaricides Industry Revenue Share (%), by Production Analysis 2024 & 2032
- Figure 14: North America Acaricides Industry Revenue (Million), by Consumption Analysis 2024 & 2032
- Figure 15: North America Acaricides Industry Revenue Share (%), by Consumption Analysis 2024 & 2032
- Figure 16: North America Acaricides Industry Revenue (Million), by Import Market Analysis (Value & Volume) 2024 & 2032
- Figure 17: North America Acaricides Industry Revenue Share (%), by Import Market Analysis (Value & Volume) 2024 & 2032
- Figure 18: North America Acaricides Industry Revenue (Million), by Export Market Analysis (Value & Volume) 2024 & 2032
- Figure 19: North America Acaricides Industry Revenue Share (%), by Export Market Analysis (Value & Volume) 2024 & 2032
- Figure 20: North America Acaricides Industry Revenue (Million), by Price Trend Analysis 2024 & 2032
- Figure 21: North America Acaricides Industry Revenue Share (%), by Price Trend Analysis 2024 & 2032
- Figure 22: North America Acaricides Industry Revenue (Million), by Country 2024 & 2032
- Figure 23: North America Acaricides Industry Revenue Share (%), by Country 2024 & 2032
- Figure 24: South America Acaricides Industry Revenue (Million), by Production Analysis 2024 & 2032
- Figure 25: South America Acaricides Industry Revenue Share (%), by Production Analysis 2024 & 2032
- Figure 26: South America Acaricides Industry Revenue (Million), by Consumption Analysis 2024 & 2032
- Figure 27: South America Acaricides Industry Revenue Share (%), by Consumption Analysis 2024 & 2032
- Figure 28: South America Acaricides Industry Revenue (Million), by Import Market Analysis (Value & Volume) 2024 & 2032
- Figure 29: South America Acaricides Industry Revenue Share (%), by Import Market Analysis (Value & Volume) 2024 & 2032
- Figure 30: South America Acaricides Industry Revenue (Million), by Export Market Analysis (Value & Volume) 2024 & 2032
- Figure 31: South America Acaricides Industry Revenue Share (%), by Export Market Analysis (Value & Volume) 2024 & 2032
- Figure 32: South America Acaricides Industry Revenue (Million), by Price Trend Analysis 2024 & 2032
- Figure 33: South America Acaricides Industry Revenue Share (%), by Price Trend Analysis 2024 & 2032
- Figure 34: South America Acaricides Industry Revenue (Million), by Country 2024 & 2032
- Figure 35: South America Acaricides Industry Revenue Share (%), by Country 2024 & 2032
- Figure 36: Europe Acaricides Industry Revenue (Million), by Production Analysis 2024 & 2032
- Figure 37: Europe Acaricides Industry Revenue Share (%), by Production Analysis 2024 & 2032
- Figure 38: Europe Acaricides Industry Revenue (Million), by Consumption Analysis 2024 & 2032
- Figure 39: Europe Acaricides Industry Revenue Share (%), by Consumption Analysis 2024 & 2032
- Figure 40: Europe Acaricides Industry Revenue (Million), by Import Market Analysis (Value & Volume) 2024 & 2032
- Figure 41: Europe Acaricides Industry Revenue Share (%), by Import Market Analysis (Value & Volume) 2024 & 2032
- Figure 42: Europe Acaricides Industry Revenue (Million), by Export Market Analysis (Value & Volume) 2024 & 2032
- Figure 43: Europe Acaricides Industry Revenue Share (%), by Export Market Analysis (Value & Volume) 2024 & 2032
- Figure 44: Europe Acaricides Industry Revenue (Million), by Price Trend Analysis 2024 & 2032
- Figure 45: Europe Acaricides Industry Revenue Share (%), by Price Trend Analysis 2024 & 2032
- Figure 46: Europe Acaricides Industry Revenue (Million), by Country 2024 & 2032
- Figure 47: Europe Acaricides Industry Revenue Share (%), by Country 2024 & 2032
- Figure 48: Middle East & Africa Acaricides Industry Revenue (Million), by Production Analysis 2024 & 2032
- Figure 49: Middle East & Africa Acaricides Industry Revenue Share (%), by Production Analysis 2024 & 2032
- Figure 50: Middle East & Africa Acaricides Industry Revenue (Million), by Consumption Analysis 2024 & 2032
- Figure 51: Middle East & Africa Acaricides Industry Revenue Share (%), by Consumption Analysis 2024 & 2032
- Figure 52: Middle East & Africa Acaricides Industry Revenue (Million), by Import Market Analysis (Value & Volume) 2024 & 2032
- Figure 53: Middle East & Africa Acaricides Industry Revenue Share (%), by Import Market Analysis (Value & Volume) 2024 & 2032
- Figure 54: Middle East & Africa Acaricides Industry Revenue (Million), by Export Market Analysis (Value & Volume) 2024 & 2032
- Figure 55: Middle East & Africa Acaricides Industry Revenue Share (%), by Export Market Analysis (Value & Volume) 2024 & 2032
- Figure 56: Middle East & Africa Acaricides Industry Revenue (Million), by Price Trend Analysis 2024 & 2032
- Figure 57: Middle East & Africa Acaricides Industry Revenue Share (%), by Price Trend Analysis 2024 & 2032
- Figure 58: Middle East & Africa Acaricides Industry Revenue (Million), by Country 2024 & 2032
- Figure 59: Middle East & Africa Acaricides Industry Revenue Share (%), by Country 2024 & 2032
- Figure 60: Asia Pacific Acaricides Industry Revenue (Million), by Production Analysis 2024 & 2032
- Figure 61: Asia Pacific Acaricides Industry Revenue Share (%), by Production Analysis 2024 & 2032
- Figure 62: Asia Pacific Acaricides Industry Revenue (Million), by Consumption Analysis 2024 & 2032
- Figure 63: Asia Pacific Acaricides Industry Revenue Share (%), by Consumption Analysis 2024 & 2032
- Figure 64: Asia Pacific Acaricides Industry Revenue (Million), by Import Market Analysis (Value & Volume) 2024 & 2032
- Figure 65: Asia Pacific Acaricides Industry Revenue Share (%), by Import Market Analysis (Value & Volume) 2024 & 2032
- Figure 66: Asia Pacific Acaricides Industry Revenue (Million), by Export Market Analysis (Value & Volume) 2024 & 2032
- Figure 67: Asia Pacific Acaricides Industry Revenue Share (%), by Export Market Analysis (Value & Volume) 2024 & 2032
- Figure 68: Asia Pacific Acaricides Industry Revenue (Million), by Price Trend Analysis 2024 & 2032
- Figure 69: Asia Pacific Acaricides Industry Revenue Share (%), by Price Trend Analysis 2024 & 2032
- Figure 70: Asia Pacific Acaricides Industry Revenue (Million), by Country 2024 & 2032
- Figure 71: Asia Pacific Acaricides Industry Revenue Share (%), by Country 2024 & 2032
List of Tables
- Table 1: Global Acaricides Industry Revenue Million Forecast, by Region 2019 & 2032
- Table 2: Global Acaricides Industry Revenue Million Forecast, by Production Analysis 2019 & 2032
- Table 3: Global Acaricides Industry Revenue Million Forecast, by Consumption Analysis 2019 & 2032
- Table 4: Global Acaricides Industry Revenue Million Forecast, by Import Market Analysis (Value & Volume) 2019 & 2032
- Table 5: Global Acaricides Industry Revenue Million Forecast, by Export Market Analysis (Value & Volume) 2019 & 2032
- Table 6: Global Acaricides Industry Revenue Million Forecast, by Price Trend Analysis 2019 & 2032
- Table 7: Global Acaricides Industry Revenue Million Forecast, by Region 2019 & 2032
- Table 8: Global Acaricides Industry Revenue Million Forecast, by Country 2019 & 2032
- Table 9: United States Acaricides Industry Revenue (Million) Forecast, by Application 2019 & 2032
- Table 10: Canada Acaricides Industry Revenue (Million) Forecast, by Application 2019 & 2032
- Table 11: Mexico Acaricides Industry Revenue (Million) Forecast, by Application 2019 & 2032
- Table 12: Rest of North America Acaricides Industry Revenue (Million) Forecast, by Application 2019 & 2032
- Table 13: Global Acaricides Industry Revenue Million Forecast, by Country 2019 & 2032
- Table 14: Germany Acaricides Industry Revenue (Million) Forecast, by Application 2019 & 2032
- Table 15: United Kingdom Acaricides Industry Revenue (Million) Forecast, by Application 2019 & 2032
- Table 16: Spain Acaricides Industry Revenue (Million) Forecast, by Application 2019 & 2032
- Table 17: France Acaricides Industry Revenue (Million) Forecast, by Application 2019 & 2032
- Table 18: Italy Acaricides Industry Revenue (Million) Forecast, by Application 2019 & 2032
- Table 19: Russia Acaricides Industry Revenue (Million) Forecast, by Application 2019 & 2032
- Table 20: Rest of Europe Acaricides Industry Revenue (Million) Forecast, by Application 2019 & 2032
- Table 21: Global Acaricides Industry Revenue Million Forecast, by Country 2019 & 2032
- Table 22: China Acaricides Industry Revenue (Million) Forecast, by Application 2019 & 2032
- Table 23: India Acaricides Industry Revenue (Million) Forecast, by Application 2019 & 2032
- Table 24: Japan Acaricides Industry Revenue (Million) Forecast, by Application 2019 & 2032
- Table 25: Australia Acaricides Industry Revenue (Million) Forecast, by Application 2019 & 2032
- Table 26: Rest of Asia Pacific Acaricides Industry Revenue (Million) Forecast, by Application 2019 & 2032
- Table 27: Global Acaricides Industry Revenue Million Forecast, by Country 2019 & 2032
- Table 28: Brazil Acaricides Industry Revenue (Million) Forecast, by Application 2019 & 2032
- Table 29: Argentina Acaricides Industry Revenue (Million) Forecast, by Application 2019 & 2032
- Table 30: Rest of South America Acaricides Industry Revenue (Million) Forecast, by Application 2019 & 2032
- Table 31: Global Acaricides Industry Revenue Million Forecast, by Country 2019 & 2032
- Table 32: South Africa Acaricides Industry Revenue (Million) Forecast, by Application 2019 & 2032
- Table 33: Rest of Africa Acaricides Industry Revenue (Million) Forecast, by Application 2019 & 2032
- Table 34: Global Acaricides Industry Revenue Million Forecast, by Production Analysis 2019 & 2032
- Table 35: Global Acaricides Industry Revenue Million Forecast, by Consumption Analysis 2019 & 2032
- Table 36: Global Acaricides Industry Revenue Million Forecast, by Import Market Analysis (Value & Volume) 2019 & 2032
- Table 37: Global Acaricides Industry Revenue Million Forecast, by Export Market Analysis (Value & Volume) 2019 & 2032
- Table 38: Global Acaricides Industry Revenue Million Forecast, by Price Trend Analysis 2019 & 2032
- Table 39: Global Acaricides Industry Revenue Million Forecast, by Country 2019 & 2032
- Table 40: United States Acaricides Industry Revenue (Million) Forecast, by Application 2019 & 2032
- Table 41: Canada Acaricides Industry Revenue (Million) Forecast, by Application 2019 & 2032
- Table 42: Mexico Acaricides Industry Revenue (Million) Forecast, by Application 2019 & 2032
- Table 43: Global Acaricides Industry Revenue Million Forecast, by Production Analysis 2019 & 2032
- Table 44: Global Acaricides Industry Revenue Million Forecast, by Consumption Analysis 2019 & 2032
- Table 45: Global Acaricides Industry Revenue Million Forecast, by Import Market Analysis (Value & Volume) 2019 & 2032
- Table 46: Global Acaricides Industry Revenue Million Forecast, by Export Market Analysis (Value & Volume) 2019 & 2032
- Table 47: Global Acaricides Industry Revenue Million Forecast, by Price Trend Analysis 2019 & 2032
- Table 48: Global Acaricides Industry Revenue Million Forecast, by Country 2019 & 2032
- Table 49: Brazil Acaricides Industry Revenue (Million) Forecast, by Application 2019 & 2032
- Table 50: Argentina Acaricides Industry Revenue (Million) Forecast, by Application 2019 & 2032
- Table 51: Rest of South America Acaricides Industry Revenue (Million) Forecast, by Application 2019 & 2032
- Table 52: Global Acaricides Industry Revenue Million Forecast, by Production Analysis 2019 & 2032
- Table 53: Global Acaricides Industry Revenue Million Forecast, by Consumption Analysis 2019 & 2032
- Table 54: Global Acaricides Industry Revenue Million Forecast, by Import Market Analysis (Value & Volume) 2019 & 2032
- Table 55: Global Acaricides Industry Revenue Million Forecast, by Export Market Analysis (Value & Volume) 2019 & 2032
- Table 56: Global Acaricides Industry Revenue Million Forecast, by Price Trend Analysis 2019 & 2032
- Table 57: Global Acaricides Industry Revenue Million Forecast, by Country 2019 & 2032
- Table 58: United Kingdom Acaricides Industry Revenue (Million) Forecast, by Application 2019 & 2032
- Table 59: Germany Acaricides Industry Revenue (Million) Forecast, by Application 2019 & 2032
- Table 60: France Acaricides Industry Revenue (Million) Forecast, by Application 2019 & 2032
- Table 61: Italy Acaricides Industry Revenue (Million) Forecast, by Application 2019 & 2032
- Table 62: Spain Acaricides Industry Revenue (Million) Forecast, by Application 2019 & 2032
- Table 63: Russia Acaricides Industry Revenue (Million) Forecast, by Application 2019 & 2032
- Table 64: Benelux Acaricides Industry Revenue (Million) Forecast, by Application 2019 & 2032
- Table 65: Nordics Acaricides Industry Revenue (Million) Forecast, by Application 2019 & 2032
- Table 66: Rest of Europe Acaricides Industry Revenue (Million) Forecast, by Application 2019 & 2032
- Table 67: Global Acaricides Industry Revenue Million Forecast, by Production Analysis 2019 & 2032
- Table 68: Global Acaricides Industry Revenue Million Forecast, by Consumption Analysis 2019 & 2032
- Table 69: Global Acaricides Industry Revenue Million Forecast, by Import Market Analysis (Value & Volume) 2019 & 2032
- Table 70: Global Acaricides Industry Revenue Million Forecast, by Export Market Analysis (Value & Volume) 2019 & 2032
- Table 71: Global Acaricides Industry Revenue Million Forecast, by Price Trend Analysis 2019 & 2032
- Table 72: Global Acaricides Industry Revenue Million Forecast, by Country 2019 & 2032
- Table 73: Turkey Acaricides Industry Revenue (Million) Forecast, by Application 2019 & 2032
- Table 74: Israel Acaricides Industry Revenue (Million) Forecast, by Application 2019 & 2032
- Table 75: GCC Acaricides Industry Revenue (Million) Forecast, by Application 2019 & 2032
- Table 76: North Africa Acaricides Industry Revenue (Million) Forecast, by Application 2019 & 2032
- Table 77: South Africa Acaricides Industry Revenue (Million) Forecast, by Application 2019 & 2032
- Table 78: Rest of Middle East & Africa Acaricides Industry Revenue (Million) Forecast, by Application 2019 & 2032
- Table 79: Global Acaricides Industry Revenue Million Forecast, by Production Analysis 2019 & 2032
- Table 80: Global Acaricides Industry Revenue Million Forecast, by Consumption Analysis 2019 & 2032
- Table 81: Global Acaricides Industry Revenue Million Forecast, by Import Market Analysis (Value & Volume) 2019 & 2032
- Table 82: Global Acaricides Industry Revenue Million Forecast, by Export Market Analysis (Value & Volume) 2019 & 2032
- Table 83: Global Acaricides Industry Revenue Million Forecast, by Price Trend Analysis 2019 & 2032
- Table 84: Global Acaricides Industry Revenue Million Forecast, by Country 2019 & 2032
- Table 85: China Acaricides Industry Revenue (Million) Forecast, by Application 2019 & 2032
- Table 86: India Acaricides Industry Revenue (Million) Forecast, by Application 2019 & 2032
- Table 87: Japan Acaricides Industry Revenue (Million) Forecast, by Application 2019 & 2032
- Table 88: South Korea Acaricides Industry Revenue (Million) Forecast, by Application 2019 & 2032
- Table 89: ASEAN Acaricides Industry Revenue (Million) Forecast, by Application 2019 & 2032
- Table 90: Oceania Acaricides Industry Revenue (Million) Forecast, by Application 2019 & 2032
- Table 91: Rest of Asia Pacific Acaricides Industry Revenue (Million) Forecast, by Application 2019 & 2032
Frequently Asked Questions
1. What is the projected Compound Annual Growth Rate (CAGR) of the Acaricides Industry?
The projected CAGR is approximately 5.00%.
2. Which companies are prominent players in the Acaricides Industry?
Key companies in the market include FMC Corporation, Nissan Chemical Industries Ltd, Syngenta International AG, UPL Limite, Bayer CropScience, Corteva Agriscience, BASF SE.
3. What are the main segments of the Acaricides Industry?
The market segments include Production Analysis, Consumption Analysis, Import Market Analysis (Value & Volume), Export Market Analysis (Value & Volume), Price Trend Analysis.
4. Can you provide details about the market size?
The market size is estimated to be USD 369.34 Million as of 2022.
5. What are some drivers contributing to market growth?
Shortage of Skilled Labor; Government Support to Enhance Farm Mechanization.
6. What are the notable trends driving market growth?
Increasing Demand for Natural Products.
7. Are there any restraints impacting market growth?
Heavy Initial Procurement Cost and High Expenditure on Maintenance.
8. Can you provide examples of recent developments in the market?
N/A
9. What pricing options are available for accessing the report?
Pricing options include single-user, multi-user, and enterprise licenses priced at USD 4750, USD 5250, and USD 8750 respectively.
10. Is the market size provided in terms of value or volume?
The market size is provided in terms of value, measured in Million.
11. Are there any specific market keywords associated with the report?
Yes, the market keyword associated with the report is "Acaricides Industry," which aids in identifying and referencing the specific market segment covered.
12. How do I determine which pricing option suits my needs best?
The pricing options vary based on user requirements and access needs. Individual users may opt for single-user licenses, while businesses requiring broader access may choose multi-user or enterprise licenses for cost-effective access to the report.
13. Are there any additional resources or data provided in the Acaricides Industry report?
While the report offers comprehensive insights, it's advisable to review the specific contents or supplementary materials provided to ascertain if additional resources or data are available.
14. How can I stay updated on further developments or reports in the Acaricides Industry?
To stay informed about further developments, trends, and reports in the Acaricides Industry, consider subscribing to industry newsletters, following relevant companies and organizations, or regularly checking reputable industry news sources and publications.
Methodology
Step 1 - Identification of Relevant Samples Size from Population Database


Step 2 - Approaches for Defining Global Market Size (Value, Volume* & Price*)

Note*: In applicable scenarios
Step 3 - Data Sources
Primary Research
- Web Analytics
- Survey Reports
- Research Institute
- Latest Research Reports
- Opinion Leaders
Secondary Research
- Annual Reports
- White Paper
- Latest Press Release
- Industry Association
- Paid Database
- Investor Presentations

Step 4 - Data Triangulation
Involves using different sources of information in order to increase the validity of a study
These sources are likely to be stakeholders in a program - participants, other researchers, program staff, other community members, and so on.
Then we put all data in single framework & apply various statistical tools to find out the dynamic on the market.
During the analysis stage, feedback from the stakeholder groups would be compared to determine areas of agreement as well as areas of divergence
