

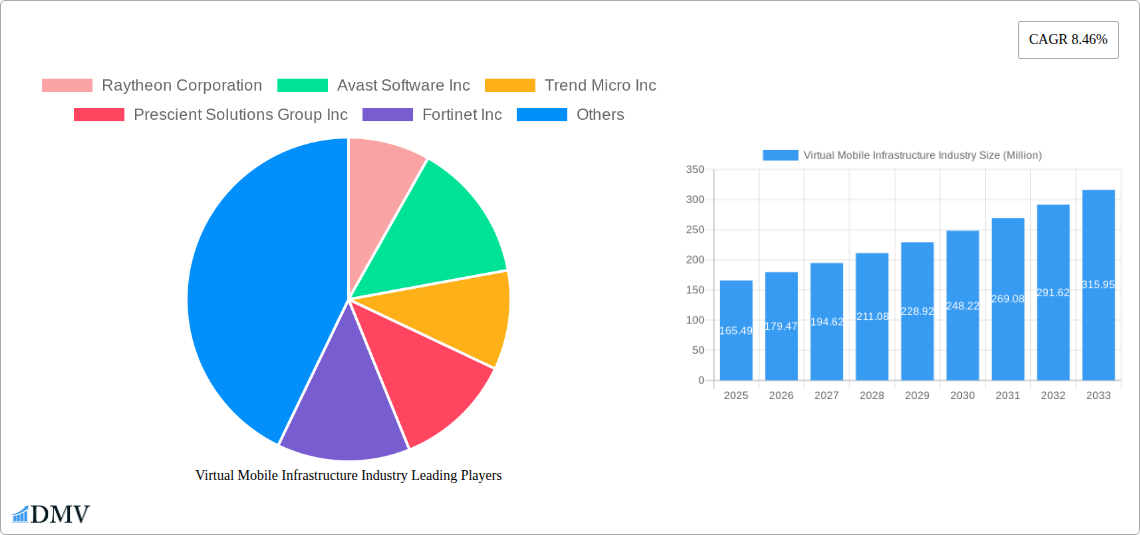
Key Insights
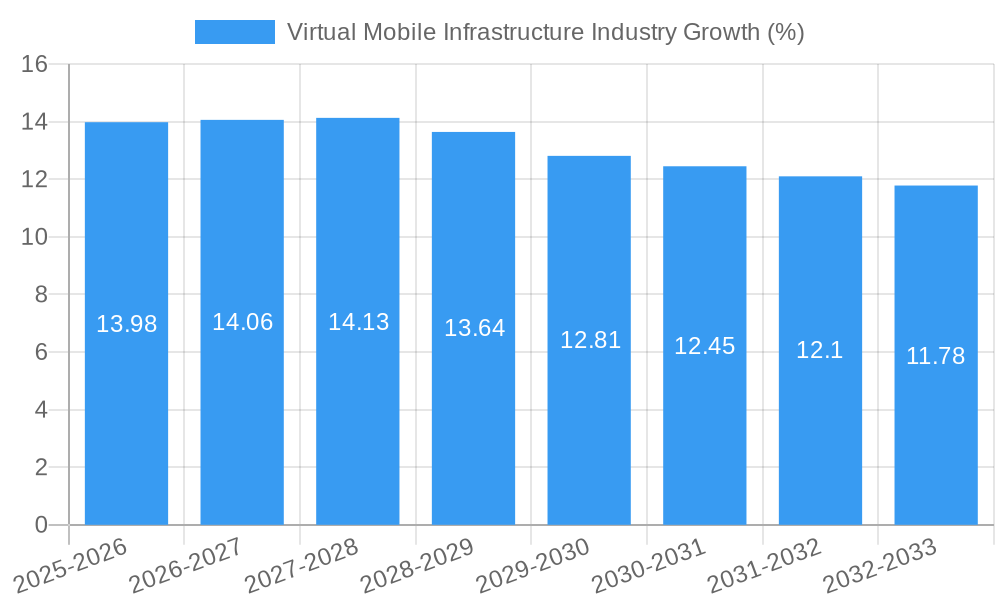
The Virtual Mobile Infrastructure (VMI) market is experiencing robust growth, projected to reach $165.49 million in 2025 and exhibiting a Compound Annual Growth Rate (CAGR) of 8.46% from 2025 to 2033. This expansion is fueled by several key drivers. The increasing adoption of cloud-based solutions across various sectors, including BFSI, healthcare, and government, is a significant catalyst. Organizations are migrating to cloud-based VMIs to enhance scalability, flexibility, and cost-efficiency in managing their mobile infrastructure. Furthermore, the rising demand for secure and reliable mobile access for remote workers and the growing need for advanced mobile security features are further bolstering market growth. The competitive landscape is characterized by a mix of established players like Raytheon Corporation and Trend Micro Inc., alongside emerging innovative companies. The market is segmented by deployment mode (on-premise and cloud) and end-user vertical, with the BFSI and healthcare sectors exhibiting substantial growth potential due to their stringent security requirements and increasing reliance on mobile technologies. The on-premise segment is likely to gradually decrease in market share over the forecast period, as businesses increasingly adopt the agility and scalability benefits of cloud-based VMI solutions.
The geographical distribution of the VMI market is likely to be skewed towards North America and Europe in the initial years, given the higher adoption rate of advanced technologies in these regions. However, the Asia-Pacific region is poised for significant growth in the coming years, driven by increasing digitalization and the expansion of mobile infrastructure. The market's future growth will depend on factors such as technological advancements in mobile security, the integration of 5G technology, and the continued adoption of cloud-computing infrastructure. Government regulations and data privacy concerns might present some challenges, but overall, the long-term outlook for the VMI market remains positive, fueled by the increasing demand for robust and secure mobile infrastructure across diverse industries.
Virtual Mobile Infrastructure (VMI) Industry Market Report: 2019-2033
This comprehensive report provides an in-depth analysis of the Virtual Mobile Infrastructure (VMI) industry, offering invaluable insights for stakeholders seeking to navigate this rapidly evolving market. The report covers the period from 2019 to 2033, with a focus on the 2025-2033 forecast period. The global VMI market is projected to reach $XX Million by 2033, exhibiting a robust Compound Annual Growth Rate (CAGR) of XX%. This report details market segmentation, leading players, key trends, and future growth opportunities, equipping readers with the knowledge necessary for informed decision-making.
Virtual Mobile Infrastructure Industry Market Composition & Trends
The global Virtual Mobile Infrastructure market, valued at $XX Million in 2025, is characterized by a moderately concentrated landscape with key players vying for market share. Innovation in areas such as 5G integration, edge computing, and enhanced security features are driving significant growth. Stringent regulatory frameworks governing data privacy and security influence market dynamics, while the emergence of alternative communication technologies presents a degree of substitutability. The end-user base is diverse, spanning BFSI, healthcare, government & defense, telecommunications & IT, manufacturing, and other verticals. The market has witnessed several significant mergers and acquisitions (M&A) in recent years, with deal values totaling $XX Million in 2024.
- Market Share Distribution (2024): Top 5 players hold approximately XX% of the market share.
- M&A Activity (2019-2024): A total of XX M&A deals were recorded, with an average deal value of $XX Million.
- Innovation Catalysts: 5G deployment, AI-powered security solutions, and cloud-based VMI deployments.
- Regulatory Landscape: GDPR, CCPA, and other data privacy regulations are key considerations.
Virtual Mobile Infrastructure Industry Industry Evolution
The VMI industry has undergone a transformative evolution, driven by technological advancements and evolving consumer demands. The historical period (2019-2024) witnessed a CAGR of XX%, demonstrating strong growth momentum. This growth is attributed to the increasing adoption of cloud-based VMI solutions, fueled by the need for greater scalability, flexibility, and cost-effectiveness. Furthermore, the rising demand for seamless connectivity across various devices and the increasing penetration of smartphones and IoT devices have further propelled market expansion. Technological advancements, including the development of advanced virtualization technologies and the integration of AI and machine learning, have also played a crucial role in shaping the industry's trajectory. The shift towards digital transformation across diverse sectors, particularly in BFSI and telecommunications, has been a key growth catalyst.
Leading Regions, Countries, or Segments in Virtual Mobile Infrastructure Industry
The North American region currently holds the dominant position in the VMI market, accounting for approximately XX% of the global market share in 2025. This dominance is primarily driven by substantial investments in 5G infrastructure, strong technological innovation, and the presence of major market players. The Telecommunications and IT end-user vertical displays the highest growth rate, fueled by increasing digital transformation initiatives and the demand for robust, scalable communication solutions.
- Key Drivers for North American Dominance:
- High levels of investment in 5G infrastructure.
- Strong presence of established VMI vendors.
- Advanced technological expertise and innovation.
- Favorable regulatory environment.
- Key Drivers for Telecommunications & IT Segment Growth:
- Increasing demand for cloud-based VMI solutions.
- High adoption rates of 5G and IoT technologies.
- Growing need for enhanced network security and reliability.
Virtual Mobile Infrastructure Industry Product Innovations
Recent product innovations in the VMI space focus on enhanced security features, improved scalability, and seamless integration with existing IT infrastructure. This includes the development of AI-powered security solutions to combat cyber threats, cloud-native VMI platforms offering superior flexibility and cost efficiency, and the integration of advanced analytics for improved network management and performance optimization. Unique selling propositions include improved performance metrics like reduced latency and increased bandwidth, as well as ease of deployment and management.
Propelling Factors for Virtual Mobile Infrastructure Industry Growth
Several factors are driving the growth of the VMI industry. Technological advancements, such as the development of 5G and edge computing, are enabling faster speeds and lower latency, thus making VMI more attractive for users. Economically, the cost-effectiveness of VMI compared to traditional infrastructure is a significant driver. Favorable regulatory policies promoting digital transformation and infrastructure investment further accelerate market growth. The increasing adoption of cloud computing is another key factor contributing to the rising demand for VMI solutions.
Obstacles in the Virtual Mobile Infrastructure Industry Market
The VMI market faces challenges, including regulatory hurdles around data privacy and security compliance. Supply chain disruptions and increasing competition also create uncertainty. The complexity of implementation and integration of VMI solutions can present difficulties for some organizations. The high initial investment cost associated with VMI deployment can limit adoption by smaller enterprises.
Future Opportunities in Virtual Mobile Infrastructure Industry
Future opportunities lie in expanding into emerging markets, particularly in developing economies experiencing rapid digitalization. The integration of advanced technologies, such as AI and machine learning, into VMI solutions holds significant potential. Meeting the increasing demand for secure and reliable connectivity across various devices, particularly IoT devices, presents promising growth avenues. The development of innovative VMI solutions tailored to specific industry needs further enhances market prospects.
Major Players in the Virtual Mobile Infrastructure Industry Ecosystem
- Raytheon Corporation
- Avast Software Inc
- Trend Micro Inc
- Prescient Solutions Group Inc
- Fortinet Inc
- Intelligent Waves LLC
- Genymobile SAS
- Nubo Software Limited
- Pulse Secure LLC
- Sierraware LLC
Key Developments in Virtual Mobile Infrastructure Industry Industry
- January 2023: Indigo AG and MTEL strengthened their cooperation, enhancing cybersecurity for MTEL users.
- December 2022: Grover partnered with Gigs to launch Grover Connect, an MVNO for tech rental consumers.
Strategic Virtual Mobile Infrastructure Industry Market Forecast
The VMI market is poised for continued strong growth, driven by technological advancements and increasing demand for secure and flexible communication solutions. The expanding adoption of cloud-based VMI and 5G technology is expected to create significant opportunities. The market’s potential is vast, particularly in emerging economies and with the continued growth of the Internet of Things. The forecast period (2025-2033) anticipates a sustained high CAGR, indicating robust market expansion and significant revenue generation.
Virtual Mobile Infrastructure Industry Segmentation
-
1. Deployment Mode
- 1.1. On-Premise
- 1.2. Cloud
-
2. End-user Vertical
- 2.1. BFSi
- 2.2. Healthcare
- 2.3. Government and Defense
- 2.4. Telecommunications and IT
- 2.5. Manufacturing
- 2.6. Other End-User Verticals
Virtual Mobile Infrastructure Industry Segmentation By Geography
- 1. North America
- 2. Europe
- 3. Asia Pacific
- 4. Latin America
- 5. Middle East
Virtual Mobile Infrastructure Industry REPORT HIGHLIGHTS
| Aspects | Details |
|---|---|
| Study Period | 2019-2033 |
| Base Year | 2024 |
| Estimated Year | 2025 |
| Forecast Period | 2025-2033 |
| Historical Period | 2019-2024 |
| Growth Rate | CAGR of 8.46% from 2019-2033 |
| Segmentation |
|
Table of Contents
- 1. Introduction
- 1.1. Research Scope
- 1.2. Market Segmentation
- 1.3. Research Methodology
- 1.4. Definitions and Assumptions
- 2. Executive Summary
- 2.1. Introduction
- 3. Market Dynamics
- 3.1. Introduction
- 3.2. Market Drivers
- 3.2.1. Increase in Smartphone Penetration; Need to Increase the Productivity of Employees; Reduced Hardware and Operating Cost Using VMI
- 3.3. Market Restrains
- 3.3.1. Android Application Compatibility and Technical Issues
- 3.4. Market Trends
- 3.4.1. Cloud Segment is Expected to Grow Significantly
- 4. Market Factor Analysis
- 4.1. Porters Five Forces
- 4.2. Supply/Value Chain
- 4.3. PESTEL analysis
- 4.4. Market Entropy
- 4.5. Patent/Trademark Analysis
- 5. Global Virtual Mobile Infrastructure Industry Analysis, Insights and Forecast, 2019-2031
- 5.1. Market Analysis, Insights and Forecast - by Deployment Mode
- 5.1.1. On-Premise
- 5.1.2. Cloud
- 5.2. Market Analysis, Insights and Forecast - by End-user Vertical
- 5.2.1. BFSi
- 5.2.2. Healthcare
- 5.2.3. Government and Defense
- 5.2.4. Telecommunications and IT
- 5.2.5. Manufacturing
- 5.2.6. Other End-User Verticals
- 5.3. Market Analysis, Insights and Forecast - by Region
- 5.3.1. North America
- 5.3.2. Europe
- 5.3.3. Asia Pacific
- 5.3.4. Latin America
- 5.3.5. Middle East
- 5.1. Market Analysis, Insights and Forecast - by Deployment Mode
- 6. North America Virtual Mobile Infrastructure Industry Analysis, Insights and Forecast, 2019-2031
- 6.1. Market Analysis, Insights and Forecast - by Deployment Mode
- 6.1.1. On-Premise
- 6.1.2. Cloud
- 6.2. Market Analysis, Insights and Forecast - by End-user Vertical
- 6.2.1. BFSi
- 6.2.2. Healthcare
- 6.2.3. Government and Defense
- 6.2.4. Telecommunications and IT
- 6.2.5. Manufacturing
- 6.2.6. Other End-User Verticals
- 6.1. Market Analysis, Insights and Forecast - by Deployment Mode
- 7. Europe Virtual Mobile Infrastructure Industry Analysis, Insights and Forecast, 2019-2031
- 7.1. Market Analysis, Insights and Forecast - by Deployment Mode
- 7.1.1. On-Premise
- 7.1.2. Cloud
- 7.2. Market Analysis, Insights and Forecast - by End-user Vertical
- 7.2.1. BFSi
- 7.2.2. Healthcare
- 7.2.3. Government and Defense
- 7.2.4. Telecommunications and IT
- 7.2.5. Manufacturing
- 7.2.6. Other End-User Verticals
- 7.1. Market Analysis, Insights and Forecast - by Deployment Mode
- 8. Asia Pacific Virtual Mobile Infrastructure Industry Analysis, Insights and Forecast, 2019-2031
- 8.1. Market Analysis, Insights and Forecast - by Deployment Mode
- 8.1.1. On-Premise
- 8.1.2. Cloud
- 8.2. Market Analysis, Insights and Forecast - by End-user Vertical
- 8.2.1. BFSi
- 8.2.2. Healthcare
- 8.2.3. Government and Defense
- 8.2.4. Telecommunications and IT
- 8.2.5. Manufacturing
- 8.2.6. Other End-User Verticals
- 8.1. Market Analysis, Insights and Forecast - by Deployment Mode
- 9. Latin America Virtual Mobile Infrastructure Industry Analysis, Insights and Forecast, 2019-2031
- 9.1. Market Analysis, Insights and Forecast - by Deployment Mode
- 9.1.1. On-Premise
- 9.1.2. Cloud
- 9.2. Market Analysis, Insights and Forecast - by End-user Vertical
- 9.2.1. BFSi
- 9.2.2. Healthcare
- 9.2.3. Government and Defense
- 9.2.4. Telecommunications and IT
- 9.2.5. Manufacturing
- 9.2.6. Other End-User Verticals
- 9.1. Market Analysis, Insights and Forecast - by Deployment Mode
- 10. Middle East Virtual Mobile Infrastructure Industry Analysis, Insights and Forecast, 2019-2031
- 10.1. Market Analysis, Insights and Forecast - by Deployment Mode
- 10.1.1. On-Premise
- 10.1.2. Cloud
- 10.2. Market Analysis, Insights and Forecast - by End-user Vertical
- 10.2.1. BFSi
- 10.2.2. Healthcare
- 10.2.3. Government and Defense
- 10.2.4. Telecommunications and IT
- 10.2.5. Manufacturing
- 10.2.6. Other End-User Verticals
- 10.1. Market Analysis, Insights and Forecast - by Deployment Mode
- 11. North America Virtual Mobile Infrastructure Industry Analysis, Insights and Forecast, 2019-2031
- 11.1. Market Analysis, Insights and Forecast - By Country/Sub-region
- 11.1.1.
- 12. Europe Virtual Mobile Infrastructure Industry Analysis, Insights and Forecast, 2019-2031
- 12.1. Market Analysis, Insights and Forecast - By Country/Sub-region
- 12.1.1.
- 13. Asia Pacific Virtual Mobile Infrastructure Industry Analysis, Insights and Forecast, 2019-2031
- 13.1. Market Analysis, Insights and Forecast - By Country/Sub-region
- 13.1.1.
- 14. Latin America Virtual Mobile Infrastructure Industry Analysis, Insights and Forecast, 2019-2031
- 14.1. Market Analysis, Insights and Forecast - By Country/Sub-region
- 14.1.1.
- 15. Middle East Virtual Mobile Infrastructure Industry Analysis, Insights and Forecast, 2019-2031
- 15.1. Market Analysis, Insights and Forecast - By Country/Sub-region
- 15.1.1.
- 16. Competitive Analysis
- 16.1. Global Market Share Analysis 2024
- 16.2. Company Profiles
- 16.2.1 Raytheon Corporation
- 16.2.1.1. Overview
- 16.2.1.2. Products
- 16.2.1.3. SWOT Analysis
- 16.2.1.4. Recent Developments
- 16.2.1.5. Financials (Based on Availability)
- 16.2.2 Avast Software Inc
- 16.2.2.1. Overview
- 16.2.2.2. Products
- 16.2.2.3. SWOT Analysis
- 16.2.2.4. Recent Developments
- 16.2.2.5. Financials (Based on Availability)
- 16.2.3 Trend Micro Inc
- 16.2.3.1. Overview
- 16.2.3.2. Products
- 16.2.3.3. SWOT Analysis
- 16.2.3.4. Recent Developments
- 16.2.3.5. Financials (Based on Availability)
- 16.2.4 Prescient Solutions Group Inc
- 16.2.4.1. Overview
- 16.2.4.2. Products
- 16.2.4.3. SWOT Analysis
- 16.2.4.4. Recent Developments
- 16.2.4.5. Financials (Based on Availability)
- 16.2.5 Fortinet Inc
- 16.2.5.1. Overview
- 16.2.5.2. Products
- 16.2.5.3. SWOT Analysis
- 16.2.5.4. Recent Developments
- 16.2.5.5. Financials (Based on Availability)
- 16.2.6 Intelligent Waves LLC
- 16.2.6.1. Overview
- 16.2.6.2. Products
- 16.2.6.3. SWOT Analysis
- 16.2.6.4. Recent Developments
- 16.2.6.5. Financials (Based on Availability)
- 16.2.7 Genymobile SAS*List Not Exhaustive
- 16.2.7.1. Overview
- 16.2.7.2. Products
- 16.2.7.3. SWOT Analysis
- 16.2.7.4. Recent Developments
- 16.2.7.5. Financials (Based on Availability)
- 16.2.8 Nubo Software Limited
- 16.2.8.1. Overview
- 16.2.8.2. Products
- 16.2.8.3. SWOT Analysis
- 16.2.8.4. Recent Developments
- 16.2.8.5. Financials (Based on Availability)
- 16.2.9 Pulse Secure LLC
- 16.2.9.1. Overview
- 16.2.9.2. Products
- 16.2.9.3. SWOT Analysis
- 16.2.9.4. Recent Developments
- 16.2.9.5. Financials (Based on Availability)
- 16.2.10 Sierraware LLC
- 16.2.10.1. Overview
- 16.2.10.2. Products
- 16.2.10.3. SWOT Analysis
- 16.2.10.4. Recent Developments
- 16.2.10.5. Financials (Based on Availability)
- 16.2.1 Raytheon Corporation
List of Figures
- Figure 1: Global Virtual Mobile Infrastructure Industry Revenue Breakdown (Million, %) by Region 2024 & 2032
- Figure 2: North America Virtual Mobile Infrastructure Industry Revenue (Million), by Country 2024 & 2032
- Figure 3: North America Virtual Mobile Infrastructure Industry Revenue Share (%), by Country 2024 & 2032
- Figure 4: Europe Virtual Mobile Infrastructure Industry Revenue (Million), by Country 2024 & 2032
- Figure 5: Europe Virtual Mobile Infrastructure Industry Revenue Share (%), by Country 2024 & 2032
- Figure 6: Asia Pacific Virtual Mobile Infrastructure Industry Revenue (Million), by Country 2024 & 2032
- Figure 7: Asia Pacific Virtual Mobile Infrastructure Industry Revenue Share (%), by Country 2024 & 2032
- Figure 8: Latin America Virtual Mobile Infrastructure Industry Revenue (Million), by Country 2024 & 2032
- Figure 9: Latin America Virtual Mobile Infrastructure Industry Revenue Share (%), by Country 2024 & 2032
- Figure 10: Middle East Virtual Mobile Infrastructure Industry Revenue (Million), by Country 2024 & 2032
- Figure 11: Middle East Virtual Mobile Infrastructure Industry Revenue Share (%), by Country 2024 & 2032
- Figure 12: North America Virtual Mobile Infrastructure Industry Revenue (Million), by Deployment Mode 2024 & 2032
- Figure 13: North America Virtual Mobile Infrastructure Industry Revenue Share (%), by Deployment Mode 2024 & 2032
- Figure 14: North America Virtual Mobile Infrastructure Industry Revenue (Million), by End-user Vertical 2024 & 2032
- Figure 15: North America Virtual Mobile Infrastructure Industry Revenue Share (%), by End-user Vertical 2024 & 2032
- Figure 16: North America Virtual Mobile Infrastructure Industry Revenue (Million), by Country 2024 & 2032
- Figure 17: North America Virtual Mobile Infrastructure Industry Revenue Share (%), by Country 2024 & 2032
- Figure 18: Europe Virtual Mobile Infrastructure Industry Revenue (Million), by Deployment Mode 2024 & 2032
- Figure 19: Europe Virtual Mobile Infrastructure Industry Revenue Share (%), by Deployment Mode 2024 & 2032
- Figure 20: Europe Virtual Mobile Infrastructure Industry Revenue (Million), by End-user Vertical 2024 & 2032
- Figure 21: Europe Virtual Mobile Infrastructure Industry Revenue Share (%), by End-user Vertical 2024 & 2032
- Figure 22: Europe Virtual Mobile Infrastructure Industry Revenue (Million), by Country 2024 & 2032
- Figure 23: Europe Virtual Mobile Infrastructure Industry Revenue Share (%), by Country 2024 & 2032
- Figure 24: Asia Pacific Virtual Mobile Infrastructure Industry Revenue (Million), by Deployment Mode 2024 & 2032
- Figure 25: Asia Pacific Virtual Mobile Infrastructure Industry Revenue Share (%), by Deployment Mode 2024 & 2032
- Figure 26: Asia Pacific Virtual Mobile Infrastructure Industry Revenue (Million), by End-user Vertical 2024 & 2032
- Figure 27: Asia Pacific Virtual Mobile Infrastructure Industry Revenue Share (%), by End-user Vertical 2024 & 2032
- Figure 28: Asia Pacific Virtual Mobile Infrastructure Industry Revenue (Million), by Country 2024 & 2032
- Figure 29: Asia Pacific Virtual Mobile Infrastructure Industry Revenue Share (%), by Country 2024 & 2032
- Figure 30: Latin America Virtual Mobile Infrastructure Industry Revenue (Million), by Deployment Mode 2024 & 2032
- Figure 31: Latin America Virtual Mobile Infrastructure Industry Revenue Share (%), by Deployment Mode 2024 & 2032
- Figure 32: Latin America Virtual Mobile Infrastructure Industry Revenue (Million), by End-user Vertical 2024 & 2032
- Figure 33: Latin America Virtual Mobile Infrastructure Industry Revenue Share (%), by End-user Vertical 2024 & 2032
- Figure 34: Latin America Virtual Mobile Infrastructure Industry Revenue (Million), by Country 2024 & 2032
- Figure 35: Latin America Virtual Mobile Infrastructure Industry Revenue Share (%), by Country 2024 & 2032
- Figure 36: Middle East Virtual Mobile Infrastructure Industry Revenue (Million), by Deployment Mode 2024 & 2032
- Figure 37: Middle East Virtual Mobile Infrastructure Industry Revenue Share (%), by Deployment Mode 2024 & 2032
- Figure 38: Middle East Virtual Mobile Infrastructure Industry Revenue (Million), by End-user Vertical 2024 & 2032
- Figure 39: Middle East Virtual Mobile Infrastructure Industry Revenue Share (%), by End-user Vertical 2024 & 2032
- Figure 40: Middle East Virtual Mobile Infrastructure Industry Revenue (Million), by Country 2024 & 2032
- Figure 41: Middle East Virtual Mobile Infrastructure Industry Revenue Share (%), by Country 2024 & 2032
List of Tables
- Table 1: Global Virtual Mobile Infrastructure Industry Revenue Million Forecast, by Region 2019 & 2032
- Table 2: Global Virtual Mobile Infrastructure Industry Revenue Million Forecast, by Deployment Mode 2019 & 2032
- Table 3: Global Virtual Mobile Infrastructure Industry Revenue Million Forecast, by End-user Vertical 2019 & 2032
- Table 4: Global Virtual Mobile Infrastructure Industry Revenue Million Forecast, by Region 2019 & 2032
- Table 5: Global Virtual Mobile Infrastructure Industry Revenue Million Forecast, by Country 2019 & 2032
- Table 6: Virtual Mobile Infrastructure Industry Revenue (Million) Forecast, by Application 2019 & 2032
- Table 7: Global Virtual Mobile Infrastructure Industry Revenue Million Forecast, by Country 2019 & 2032
- Table 8: Virtual Mobile Infrastructure Industry Revenue (Million) Forecast, by Application 2019 & 2032
- Table 9: Global Virtual Mobile Infrastructure Industry Revenue Million Forecast, by Country 2019 & 2032
- Table 10: Virtual Mobile Infrastructure Industry Revenue (Million) Forecast, by Application 2019 & 2032
- Table 11: Global Virtual Mobile Infrastructure Industry Revenue Million Forecast, by Country 2019 & 2032
- Table 12: Virtual Mobile Infrastructure Industry Revenue (Million) Forecast, by Application 2019 & 2032
- Table 13: Global Virtual Mobile Infrastructure Industry Revenue Million Forecast, by Country 2019 & 2032
- Table 14: Virtual Mobile Infrastructure Industry Revenue (Million) Forecast, by Application 2019 & 2032
- Table 15: Global Virtual Mobile Infrastructure Industry Revenue Million Forecast, by Deployment Mode 2019 & 2032
- Table 16: Global Virtual Mobile Infrastructure Industry Revenue Million Forecast, by End-user Vertical 2019 & 2032
- Table 17: Global Virtual Mobile Infrastructure Industry Revenue Million Forecast, by Country 2019 & 2032
- Table 18: Global Virtual Mobile Infrastructure Industry Revenue Million Forecast, by Deployment Mode 2019 & 2032
- Table 19: Global Virtual Mobile Infrastructure Industry Revenue Million Forecast, by End-user Vertical 2019 & 2032
- Table 20: Global Virtual Mobile Infrastructure Industry Revenue Million Forecast, by Country 2019 & 2032
- Table 21: Global Virtual Mobile Infrastructure Industry Revenue Million Forecast, by Deployment Mode 2019 & 2032
- Table 22: Global Virtual Mobile Infrastructure Industry Revenue Million Forecast, by End-user Vertical 2019 & 2032
- Table 23: Global Virtual Mobile Infrastructure Industry Revenue Million Forecast, by Country 2019 & 2032
- Table 24: Global Virtual Mobile Infrastructure Industry Revenue Million Forecast, by Deployment Mode 2019 & 2032
- Table 25: Global Virtual Mobile Infrastructure Industry Revenue Million Forecast, by End-user Vertical 2019 & 2032
- Table 26: Global Virtual Mobile Infrastructure Industry Revenue Million Forecast, by Country 2019 & 2032
- Table 27: Global Virtual Mobile Infrastructure Industry Revenue Million Forecast, by Deployment Mode 2019 & 2032
- Table 28: Global Virtual Mobile Infrastructure Industry Revenue Million Forecast, by End-user Vertical 2019 & 2032
- Table 29: Global Virtual Mobile Infrastructure Industry Revenue Million Forecast, by Country 2019 & 2032
Frequently Asked Questions
1. What is the projected Compound Annual Growth Rate (CAGR) of the Virtual Mobile Infrastructure Industry?
The projected CAGR is approximately 8.46%.
2. Which companies are prominent players in the Virtual Mobile Infrastructure Industry?
Key companies in the market include Raytheon Corporation, Avast Software Inc, Trend Micro Inc, Prescient Solutions Group Inc, Fortinet Inc, Intelligent Waves LLC, Genymobile SAS*List Not Exhaustive, Nubo Software Limited, Pulse Secure LLC, Sierraware LLC.
3. What are the main segments of the Virtual Mobile Infrastructure Industry?
The market segments include Deployment Mode, End-user Vertical.
4. Can you provide details about the market size?
The market size is estimated to be USD 165.49 Million as of 2022.
5. What are some drivers contributing to market growth?
Increase in Smartphone Penetration; Need to Increase the Productivity of Employees; Reduced Hardware and Operating Cost Using VMI.
6. What are the notable trends driving market growth?
Cloud Segment is Expected to Grow Significantly.
7. Are there any restraints impacting market growth?
Android Application Compatibility and Technical Issues.
8. Can you provide examples of recent developments in the market?
January 2023: Indigo AG, a European and global provider of intelligent cybersecurity solutions and BSS/OSS platform services for the telecoms industry, and MTEL, a globally active MVNO and member of the Telekom Srbija Group, are strengthening their current cooperation. MTEL already employs cyan AG's subsidiary i-new's MVNO platform in the DACH region. The collaboration has now been extended to Blue Group's network-integrated cybersecurity solutions, allowing MTEL users to access the Internet in a safe and unburdened manner in the future.
9. What pricing options are available for accessing the report?
Pricing options include single-user, multi-user, and enterprise licenses priced at USD 4750, USD 5250, and USD 8750 respectively.
10. Is the market size provided in terms of value or volume?
The market size is provided in terms of value, measured in Million.
11. Are there any specific market keywords associated with the report?
Yes, the market keyword associated with the report is "Virtual Mobile Infrastructure Industry," which aids in identifying and referencing the specific market segment covered.
12. How do I determine which pricing option suits my needs best?
The pricing options vary based on user requirements and access needs. Individual users may opt for single-user licenses, while businesses requiring broader access may choose multi-user or enterprise licenses for cost-effective access to the report.
13. Are there any additional resources or data provided in the Virtual Mobile Infrastructure Industry report?
While the report offers comprehensive insights, it's advisable to review the specific contents or supplementary materials provided to ascertain if additional resources or data are available.
14. How can I stay updated on further developments or reports in the Virtual Mobile Infrastructure Industry?
To stay informed about further developments, trends, and reports in the Virtual Mobile Infrastructure Industry, consider subscribing to industry newsletters, following relevant companies and organizations, or regularly checking reputable industry news sources and publications.
Methodology
Step 1 - Identification of Relevant Samples Size from Population Database


Step 2 - Approaches for Defining Global Market Size (Value, Volume* & Price*)

Note*: In applicable scenarios
Step 3 - Data Sources
Primary Research
- Web Analytics
- Survey Reports
- Research Institute
- Latest Research Reports
- Opinion Leaders
Secondary Research
- Annual Reports
- White Paper
- Latest Press Release
- Industry Association
- Paid Database
- Investor Presentations

Step 4 - Data Triangulation
Involves using different sources of information in order to increase the validity of a study
These sources are likely to be stakeholders in a program - participants, other researchers, program staff, other community members, and so on.
Then we put all data in single framework & apply various statistical tools to find out the dynamic on the market.
During the analysis stage, feedback from the stakeholder groups would be compared to determine areas of agreement as well as areas of divergence
