

Key Insights
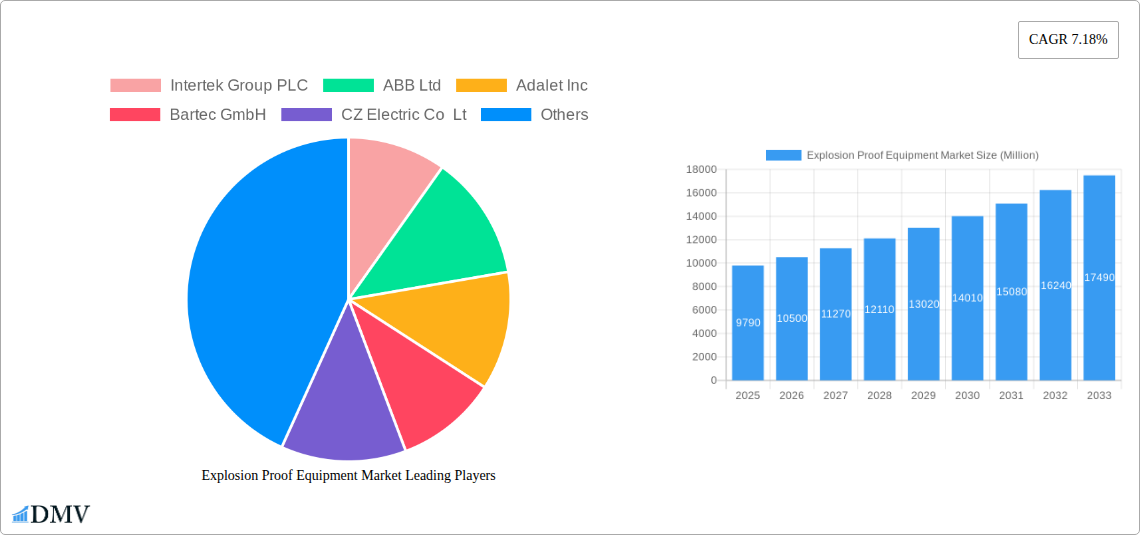
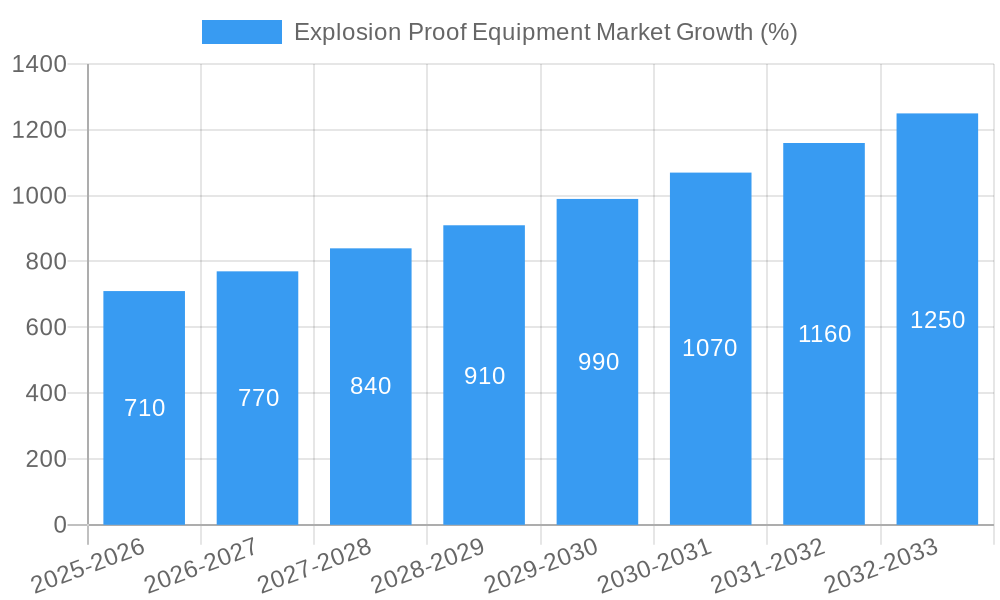
The explosion-proof equipment market, valued at $9.79 billion in 2025, is projected to experience robust growth, driven by increasing safety regulations across hazardous industries and rising demand for automation in sectors like oil and gas, chemicals, and pharmaceuticals. A compound annual growth rate (CAGR) of 7.18% is anticipated from 2025 to 2033, indicating a significant expansion of the market. Key drivers include the stringent safety standards enforced globally to mitigate risks associated with flammable and explosive materials, coupled with the growing adoption of advanced technologies like intrinsically safe instrumentation and improved explosion-proof enclosures. The market segmentation reveals a diverse landscape, with pharmaceutical, chemical, and petrochemical industries leading end-user adoption, followed by energy and power sectors. Within systems, power supply systems and motor protection dominate, while explosion-proof and explosion-prevention methods hold significant market share in protection techniques. Geographically, North America and Europe currently hold larger market shares, but the Asia-Pacific region, particularly China and India, is expected to witness substantial growth due to industrialization and infrastructure development, presenting significant opportunities for market players.
The competitive landscape is characterized by a mix of established multinational corporations and specialized regional players. Companies like ABB, Eaton, and Pepperl+Fuchs are major contributors, offering a comprehensive range of explosion-proof equipment and services. However, smaller, specialized firms cater to niche segments, often with innovative solutions and specialized expertise. The market's future growth will depend on several factors, including technological advancements in explosion protection, the increasing adoption of Industry 4.0 technologies, and evolving safety regulations. Furthermore, the development of sustainable and energy-efficient explosion-proof solutions will play a crucial role in shaping the market's trajectory in the coming years. Continuous investment in research and development across the industry is expected to drive innovation and enhance the safety and reliability of explosion-proof equipment.
Explosion Proof Equipment Market: A Comprehensive Report (2019-2033)
This insightful report provides a detailed analysis of the Explosion Proof Equipment market, offering a comprehensive overview of its current state, future trajectory, and key players. Covering the period from 2019 to 2033, with a focus on 2025, this report is an essential resource for stakeholders seeking to understand and capitalize on opportunities within this critical sector. The global market size is projected to reach xx Million by 2033.
Explosion Proof Equipment Market Composition & Trends
The Explosion Proof Equipment market is characterized by a moderately concentrated landscape, with key players holding significant market share. Market share distribution varies across segments, with xx% attributed to the top 5 players in 2024. Innovation is driven by stringent safety regulations and the increasing demand for automation in hazardous environments. The regulatory landscape is dynamic, with evolving standards influencing product development and adoption. Substitute products are limited due to the specialized nature of explosion-proof equipment, although advancements in alternative technologies occasionally pose a competitive threat. M&A activity has been moderate, with deal values averaging xx Million in recent years. End-user profiles are diverse, spanning multiple industries with varying safety requirements.
- Market Concentration: Moderately concentrated, with top 5 players holding xx% market share (2024).
- Innovation Catalysts: Stringent safety regulations, automation demands in hazardous industries.
- Regulatory Landscape: Dynamic, with evolving international and regional standards.
- Substitute Products: Limited, but alternative technologies present a developing competitive threat.
- M&A Activity: Moderate, with average deal values of xx Million (2019-2024).
- End-User Profiles: Diverse, encompassing pharmaceutical, chemical, energy, mining, food processing, oil & gas, and other sectors.
Explosion Proof Equipment Market Industry Evolution
The Explosion Proof Equipment market has witnessed consistent growth over the historical period (2019-2024), driven by increasing industrialization and a rising focus on workplace safety. The average annual growth rate (AAGR) during this period was approximately xx%. Technological advancements, particularly in wireless connectivity and automation, have significantly impacted market dynamics. The demand for explosion-proof equipment is also shifting towards more sophisticated, integrated systems, reflecting the trend towards Industry 4.0. Consumer demands are increasingly focused on improved safety features, enhanced reliability, and reduced maintenance requirements. The forecast period (2025-2033) projects continued growth, with an estimated AAGR of xx%, fueled by expanding industrial activities and stricter safety regulations globally. Adoption of advanced technologies like IoT sensors and collaborative robots (cobots) will further propel market expansion. The market is expected to reach xx Million by 2033.
Leading Regions, Countries, or Segments in Explosion Proof Equipment Market
The Oil and Gas sector is currently the dominant end-user segment, driven by the inherent risks associated with oil and gas extraction and processing. The Chemical and Petrochemical sector also holds a substantial share. Geographically, North America and Europe currently lead the market, due to robust industrial bases and stringent safety regulations. However, the Asia-Pacific region is projected to witness significant growth, driven by rapid industrialization and infrastructure development.
- Key Drivers (By Segment):
- Oil & Gas: High inherent risk, stringent safety regulations.
- Chemical & Petrochemical: Similar risk profile, large-scale operations.
- Energy & Power: Critical infrastructure protection.
- Mining: Hazardous environments, safety concerns.
- Key Drivers (By Region):
- North America: Mature industrial base, strong safety standards.
- Europe: Similar to North America.
- Asia-Pacific: Rapid industrialization, infrastructure development.
The explosion-proof method of protection dominates the market, followed by explosion prevention and segregation methods. Zone 1 and Zone 2 classifications account for a significant portion of market demand.
Explosion Proof Equipment Market Product Innovations
Recent product innovations focus on enhancing safety, reliability, and connectivity. The integration of wireless sensor networks for real-time monitoring and remote diagnostics is becoming increasingly prevalent. Advancements in materials science are also leading to the development of lighter, more durable, and cost-effective explosion-proof equipment. Collaborative robots (cobots) engineered for explosion-proof environments are emerging as a significant innovation, streamlining automation in hazardous settings. These innovations offer enhanced safety and reduced downtime, increasing their appeal to end-users.
Propelling Factors for Explosion Proof Equipment Market Growth
Technological advancements, such as improved sensor technology and wireless communication, are driving market growth by enabling better monitoring and control in hazardous environments. Economic factors, including rising industrial production and infrastructure development, also play a crucial role. Stringent safety regulations and increasing awareness of workplace safety are further accelerating market expansion. For example, the implementation of stricter safety standards in the oil and gas sector has significantly boosted demand for explosion-proof equipment.
Obstacles in the Explosion Proof Equipment Market
Regulatory complexities and variations across regions can hinder market expansion. Supply chain disruptions, particularly the availability of specialized components, can impact production and lead times. Intense competition among established players and the emergence of new entrants also pose challenges. These factors can lead to price fluctuations and increased pressure on profit margins, affecting overall market growth. For instance, the impact of supply chain disruptions during 2022 resulted in a xx% increase in manufacturing costs.
Future Opportunities in Explosion Proof Equipment Market
Emerging markets in developing economies, particularly in Asia-Pacific, present significant growth opportunities. The increasing adoption of Industry 4.0 technologies, particularly IoT and AI, will create demand for more sophisticated and integrated explosion-proof systems. Advancements in materials science and miniaturization will lead to the development of smaller, lighter, and more efficient equipment, opening up new application areas. The development of intrinsically safe devices and systems represents a further avenue for growth.
Major Players in the Explosion Proof Equipment Market Ecosystem
- Intertek Group PLC
- ABB Ltd
- Adalet Inc
- Bartec GmbH
- CZ Electric Co Lt
- RAE Systems (Honeywell)
- MAM Explosion-proof Technology (Shanghai) Co Ltd
- Marechal Electric Group
- Eaton Corporation PLC
- Extronics Limited
- R STAHL AG
- G M International SRL
- Cordex Instruments Ltd
- Pepperl+Fuchs GmbH
- Alloy Industry Co Ltd
Key Developments in Explosion Proof Equipment Market Industry
- April 2024: ScanReach partners with BARTEC to introduce an explosion-proof node for sensor data integration in EX zones, targeting the maritime sector.
- May 2024: FANUC America launches the world's first collaborative explosion-proof paint robot, the CRX-10iA/L Paint Cobot.
Strategic Explosion Proof Equipment Market Forecast
The Explosion Proof Equipment market is poised for sustained growth, driven by technological advancements, increasing safety regulations, and expansion into new markets. The rising adoption of automation and Industry 4.0 technologies will further propel market expansion. The focus on enhanced safety features and improved connectivity will shape future product development and drive market growth throughout the forecast period. The market's potential remains significant, particularly in sectors like oil and gas, and chemical processing.
Explosion Proof Equipment Market Segmentation
-
1. Method of Protection
- 1.1. Explosion Proof
- 1.2. Explosion Prevention
- 1.3. Explosion Segregation
-
2. Zone
- 2.1. Zone 0
- 2.2. Zone 20
- 2.3. Zone 1
- 2.4. Zone 21
- 2.5. Zone 22
-
3. End-user
- 3.1. Pharmaceutical
- 3.2. Chemical and Petrochemical
- 3.3. Energy and Power
- 3.4. Mining
- 3.5. Food Processing
- 3.6. Oil and Gas
- 3.7. Other End Users
-
4. System
- 4.1. Power Supply System
- 4.2. Material Handling
- 4.3. Motor
- 4.4. Automation System
- 4.5. Surveillance System
- 4.6. Other Systems
Explosion Proof Equipment Market Segmentation By Geography
-
1. North America
- 1.1. United States
- 1.2. Canada
-
2. Europe
- 2.1. United Kingdom
- 2.2. Germany
- 2.3. France
- 2.4. Rest of Europe
-
3. Asia Pacific
- 3.1. China
- 3.2. Japan
- 3.3. India
- 3.4. Rest of Asia Pacific
- 4. Rest of the World

Explosion Proof Equipment Market REPORT HIGHLIGHTS
| Aspects | Details |
|---|---|
| Study Period | 2019-2033 |
| Base Year | 2024 |
| Estimated Year | 2025 |
| Forecast Period | 2025-2033 |
| Historical Period | 2019-2024 |
| Growth Rate | CAGR of 7.18% from 2019-2033 |
| Segmentation |
|
Table of Contents
- 1. Introduction
- 1.1. Research Scope
- 1.2. Market Segmentation
- 1.3. Research Methodology
- 1.4. Definitions and Assumptions
- 2. Executive Summary
- 2.1. Introduction
- 3. Market Dynamics
- 3.1. Introduction
- 3.2. Market Drivers
- 3.2.1. Stricter Regulations for Handling Hazardous Areas and Substances; Increasing Energy Requirements Drives the Demand for Exploration of New Mines and Oil and Gas Resources
- 3.3. Market Restrains
- 3.3.1. Slow Economic Activity Directly Affects the Market; Safety Regulations Vary Across Different Geographies
- 3.4. Market Trends
- 3.4.1. The Mining Industry is Expected to Hold a Significant Share in the Market
- 4. Market Factor Analysis
- 4.1. Porters Five Forces
- 4.2. Supply/Value Chain
- 4.3. PESTEL analysis
- 4.4. Market Entropy
- 4.5. Patent/Trademark Analysis
- 5. Global Explosion Proof Equipment Market Analysis, Insights and Forecast, 2019-2031
- 5.1. Market Analysis, Insights and Forecast - by Method of Protection
- 5.1.1. Explosion Proof
- 5.1.2. Explosion Prevention
- 5.1.3. Explosion Segregation
- 5.2. Market Analysis, Insights and Forecast - by Zone
- 5.2.1. Zone 0
- 5.2.2. Zone 20
- 5.2.3. Zone 1
- 5.2.4. Zone 21
- 5.2.5. Zone 22
- 5.3. Market Analysis, Insights and Forecast - by End-user
- 5.3.1. Pharmaceutical
- 5.3.2. Chemical and Petrochemical
- 5.3.3. Energy and Power
- 5.3.4. Mining
- 5.3.5. Food Processing
- 5.3.6. Oil and Gas
- 5.3.7. Other End Users
- 5.4. Market Analysis, Insights and Forecast - by System
- 5.4.1. Power Supply System
- 5.4.2. Material Handling
- 5.4.3. Motor
- 5.4.4. Automation System
- 5.4.5. Surveillance System
- 5.4.6. Other Systems
- 5.5. Market Analysis, Insights and Forecast - by Region
- 5.5.1. North America
- 5.5.2. Europe
- 5.5.3. Asia Pacific
- 5.5.4. Rest of the World
- 5.1. Market Analysis, Insights and Forecast - by Method of Protection
- 6. North America Explosion Proof Equipment Market Analysis, Insights and Forecast, 2019-2031
- 6.1. Market Analysis, Insights and Forecast - by Method of Protection
- 6.1.1. Explosion Proof
- 6.1.2. Explosion Prevention
- 6.1.3. Explosion Segregation
- 6.2. Market Analysis, Insights and Forecast - by Zone
- 6.2.1. Zone 0
- 6.2.2. Zone 20
- 6.2.3. Zone 1
- 6.2.4. Zone 21
- 6.2.5. Zone 22
- 6.3. Market Analysis, Insights and Forecast - by End-user
- 6.3.1. Pharmaceutical
- 6.3.2. Chemical and Petrochemical
- 6.3.3. Energy and Power
- 6.3.4. Mining
- 6.3.5. Food Processing
- 6.3.6. Oil and Gas
- 6.3.7. Other End Users
- 6.4. Market Analysis, Insights and Forecast - by System
- 6.4.1. Power Supply System
- 6.4.2. Material Handling
- 6.4.3. Motor
- 6.4.4. Automation System
- 6.4.5. Surveillance System
- 6.4.6. Other Systems
- 6.1. Market Analysis, Insights and Forecast - by Method of Protection
- 7. Europe Explosion Proof Equipment Market Analysis, Insights and Forecast, 2019-2031
- 7.1. Market Analysis, Insights and Forecast - by Method of Protection
- 7.1.1. Explosion Proof
- 7.1.2. Explosion Prevention
- 7.1.3. Explosion Segregation
- 7.2. Market Analysis, Insights and Forecast - by Zone
- 7.2.1. Zone 0
- 7.2.2. Zone 20
- 7.2.3. Zone 1
- 7.2.4. Zone 21
- 7.2.5. Zone 22
- 7.3. Market Analysis, Insights and Forecast - by End-user
- 7.3.1. Pharmaceutical
- 7.3.2. Chemical and Petrochemical
- 7.3.3. Energy and Power
- 7.3.4. Mining
- 7.3.5. Food Processing
- 7.3.6. Oil and Gas
- 7.3.7. Other End Users
- 7.4. Market Analysis, Insights and Forecast - by System
- 7.4.1. Power Supply System
- 7.4.2. Material Handling
- 7.4.3. Motor
- 7.4.4. Automation System
- 7.4.5. Surveillance System
- 7.4.6. Other Systems
- 7.1. Market Analysis, Insights and Forecast - by Method of Protection
- 8. Asia Pacific Explosion Proof Equipment Market Analysis, Insights and Forecast, 2019-2031
- 8.1. Market Analysis, Insights and Forecast - by Method of Protection
- 8.1.1. Explosion Proof
- 8.1.2. Explosion Prevention
- 8.1.3. Explosion Segregation
- 8.2. Market Analysis, Insights and Forecast - by Zone
- 8.2.1. Zone 0
- 8.2.2. Zone 20
- 8.2.3. Zone 1
- 8.2.4. Zone 21
- 8.2.5. Zone 22
- 8.3. Market Analysis, Insights and Forecast - by End-user
- 8.3.1. Pharmaceutical
- 8.3.2. Chemical and Petrochemical
- 8.3.3. Energy and Power
- 8.3.4. Mining
- 8.3.5. Food Processing
- 8.3.6. Oil and Gas
- 8.3.7. Other End Users
- 8.4. Market Analysis, Insights and Forecast - by System
- 8.4.1. Power Supply System
- 8.4.2. Material Handling
- 8.4.3. Motor
- 8.4.4. Automation System
- 8.4.5. Surveillance System
- 8.4.6. Other Systems
- 8.1. Market Analysis, Insights and Forecast - by Method of Protection
- 9. Rest of the World Explosion Proof Equipment Market Analysis, Insights and Forecast, 2019-2031
- 9.1. Market Analysis, Insights and Forecast - by Method of Protection
- 9.1.1. Explosion Proof
- 9.1.2. Explosion Prevention
- 9.1.3. Explosion Segregation
- 9.2. Market Analysis, Insights and Forecast - by Zone
- 9.2.1. Zone 0
- 9.2.2. Zone 20
- 9.2.3. Zone 1
- 9.2.4. Zone 21
- 9.2.5. Zone 22
- 9.3. Market Analysis, Insights and Forecast - by End-user
- 9.3.1. Pharmaceutical
- 9.3.2. Chemical and Petrochemical
- 9.3.3. Energy and Power
- 9.3.4. Mining
- 9.3.5. Food Processing
- 9.3.6. Oil and Gas
- 9.3.7. Other End Users
- 9.4. Market Analysis, Insights and Forecast - by System
- 9.4.1. Power Supply System
- 9.4.2. Material Handling
- 9.4.3. Motor
- 9.4.4. Automation System
- 9.4.5. Surveillance System
- 9.4.6. Other Systems
- 9.1. Market Analysis, Insights and Forecast - by Method of Protection
- 10. North America Explosion Proof Equipment Market Analysis, Insights and Forecast, 2019-2031
- 10.1. Market Analysis, Insights and Forecast - By Country/Sub-region
- 10.1.1 United States
- 10.1.2 Canada
- 11. Europe Explosion Proof Equipment Market Analysis, Insights and Forecast, 2019-2031
- 11.1. Market Analysis, Insights and Forecast - By Country/Sub-region
- 11.1.1 United Kingdom
- 11.1.2 Germany
- 11.1.3 France
- 11.1.4 Rest of Europe
- 12. Asia Pacific Explosion Proof Equipment Market Analysis, Insights and Forecast, 2019-2031
- 12.1. Market Analysis, Insights and Forecast - By Country/Sub-region
- 12.1.1 China
- 12.1.2 Japan
- 12.1.3 India
- 12.1.4 Rest of Asia Pacific
- 13. Rest of the World Explosion Proof Equipment Market Analysis, Insights and Forecast, 2019-2031
- 13.1. Market Analysis, Insights and Forecast - By Country/Sub-region
- 13.1.1.
- 14. Competitive Analysis
- 14.1. Global Market Share Analysis 2024
- 14.2. Company Profiles
- 14.2.1 Intertek Group PLC
- 14.2.1.1. Overview
- 14.2.1.2. Products
- 14.2.1.3. SWOT Analysis
- 14.2.1.4. Recent Developments
- 14.2.1.5. Financials (Based on Availability)
- 14.2.2 ABB Ltd
- 14.2.2.1. Overview
- 14.2.2.2. Products
- 14.2.2.3. SWOT Analysis
- 14.2.2.4. Recent Developments
- 14.2.2.5. Financials (Based on Availability)
- 14.2.3 Adalet Inc
- 14.2.3.1. Overview
- 14.2.3.2. Products
- 14.2.3.3. SWOT Analysis
- 14.2.3.4. Recent Developments
- 14.2.3.5. Financials (Based on Availability)
- 14.2.4 Bartec GmbH
- 14.2.4.1. Overview
- 14.2.4.2. Products
- 14.2.4.3. SWOT Analysis
- 14.2.4.4. Recent Developments
- 14.2.4.5. Financials (Based on Availability)
- 14.2.5 CZ Electric Co Lt
- 14.2.5.1. Overview
- 14.2.5.2. Products
- 14.2.5.3. SWOT Analysis
- 14.2.5.4. Recent Developments
- 14.2.5.5. Financials (Based on Availability)
- 14.2.6 RAE Systems (Honeywell)
- 14.2.6.1. Overview
- 14.2.6.2. Products
- 14.2.6.3. SWOT Analysis
- 14.2.6.4. Recent Developments
- 14.2.6.5. Financials (Based on Availability)
- 14.2.7 MAM Explosion-proof Technology (Shanghai) Co Ltd
- 14.2.7.1. Overview
- 14.2.7.2. Products
- 14.2.7.3. SWOT Analysis
- 14.2.7.4. Recent Developments
- 14.2.7.5. Financials (Based on Availability)
- 14.2.8 Marechal Electric Group
- 14.2.8.1. Overview
- 14.2.8.2. Products
- 14.2.8.3. SWOT Analysis
- 14.2.8.4. Recent Developments
- 14.2.8.5. Financials (Based on Availability)
- 14.2.9 Eaton Corporation PLC
- 14.2.9.1. Overview
- 14.2.9.2. Products
- 14.2.9.3. SWOT Analysis
- 14.2.9.4. Recent Developments
- 14.2.9.5. Financials (Based on Availability)
- 14.2.10 Extronics Limited
- 14.2.10.1. Overview
- 14.2.10.2. Products
- 14.2.10.3. SWOT Analysis
- 14.2.10.4. Recent Developments
- 14.2.10.5. Financials (Based on Availability)
- 14.2.11 R STAHL AG
- 14.2.11.1. Overview
- 14.2.11.2. Products
- 14.2.11.3. SWOT Analysis
- 14.2.11.4. Recent Developments
- 14.2.11.5. Financials (Based on Availability)
- 14.2.12 G M International SRL
- 14.2.12.1. Overview
- 14.2.12.2. Products
- 14.2.12.3. SWOT Analysis
- 14.2.12.4. Recent Developments
- 14.2.12.5. Financials (Based on Availability)
- 14.2.13 Cordex Instruments Ltd
- 14.2.13.1. Overview
- 14.2.13.2. Products
- 14.2.13.3. SWOT Analysis
- 14.2.13.4. Recent Developments
- 14.2.13.5. Financials (Based on Availability)
- 14.2.14 Pepperl+Fuchs GmbH
- 14.2.14.1. Overview
- 14.2.14.2. Products
- 14.2.14.3. SWOT Analysis
- 14.2.14.4. Recent Developments
- 14.2.14.5. Financials (Based on Availability)
- 14.2.15 Alloy Industry Co Ltd
- 14.2.15.1. Overview
- 14.2.15.2. Products
- 14.2.15.3. SWOT Analysis
- 14.2.15.4. Recent Developments
- 14.2.15.5. Financials (Based on Availability)
- 14.2.1 Intertek Group PLC
List of Figures
- Figure 1: Global Explosion Proof Equipment Market Revenue Breakdown (Million, %) by Region 2024 & 2032
- Figure 2: North America Explosion Proof Equipment Market Revenue (Million), by Country 2024 & 2032
- Figure 3: North America Explosion Proof Equipment Market Revenue Share (%), by Country 2024 & 2032
- Figure 4: Europe Explosion Proof Equipment Market Revenue (Million), by Country 2024 & 2032
- Figure 5: Europe Explosion Proof Equipment Market Revenue Share (%), by Country 2024 & 2032
- Figure 6: Asia Pacific Explosion Proof Equipment Market Revenue (Million), by Country 2024 & 2032
- Figure 7: Asia Pacific Explosion Proof Equipment Market Revenue Share (%), by Country 2024 & 2032
- Figure 8: Rest of the World Explosion Proof Equipment Market Revenue (Million), by Country 2024 & 2032
- Figure 9: Rest of the World Explosion Proof Equipment Market Revenue Share (%), by Country 2024 & 2032
- Figure 10: North America Explosion Proof Equipment Market Revenue (Million), by Method of Protection 2024 & 2032
- Figure 11: North America Explosion Proof Equipment Market Revenue Share (%), by Method of Protection 2024 & 2032
- Figure 12: North America Explosion Proof Equipment Market Revenue (Million), by Zone 2024 & 2032
- Figure 13: North America Explosion Proof Equipment Market Revenue Share (%), by Zone 2024 & 2032
- Figure 14: North America Explosion Proof Equipment Market Revenue (Million), by End-user 2024 & 2032
- Figure 15: North America Explosion Proof Equipment Market Revenue Share (%), by End-user 2024 & 2032
- Figure 16: North America Explosion Proof Equipment Market Revenue (Million), by System 2024 & 2032
- Figure 17: North America Explosion Proof Equipment Market Revenue Share (%), by System 2024 & 2032
- Figure 18: North America Explosion Proof Equipment Market Revenue (Million), by Country 2024 & 2032
- Figure 19: North America Explosion Proof Equipment Market Revenue Share (%), by Country 2024 & 2032
- Figure 20: Europe Explosion Proof Equipment Market Revenue (Million), by Method of Protection 2024 & 2032
- Figure 21: Europe Explosion Proof Equipment Market Revenue Share (%), by Method of Protection 2024 & 2032
- Figure 22: Europe Explosion Proof Equipment Market Revenue (Million), by Zone 2024 & 2032
- Figure 23: Europe Explosion Proof Equipment Market Revenue Share (%), by Zone 2024 & 2032
- Figure 24: Europe Explosion Proof Equipment Market Revenue (Million), by End-user 2024 & 2032
- Figure 25: Europe Explosion Proof Equipment Market Revenue Share (%), by End-user 2024 & 2032
- Figure 26: Europe Explosion Proof Equipment Market Revenue (Million), by System 2024 & 2032
- Figure 27: Europe Explosion Proof Equipment Market Revenue Share (%), by System 2024 & 2032
- Figure 28: Europe Explosion Proof Equipment Market Revenue (Million), by Country 2024 & 2032
- Figure 29: Europe Explosion Proof Equipment Market Revenue Share (%), by Country 2024 & 2032
- Figure 30: Asia Pacific Explosion Proof Equipment Market Revenue (Million), by Method of Protection 2024 & 2032
- Figure 31: Asia Pacific Explosion Proof Equipment Market Revenue Share (%), by Method of Protection 2024 & 2032
- Figure 32: Asia Pacific Explosion Proof Equipment Market Revenue (Million), by Zone 2024 & 2032
- Figure 33: Asia Pacific Explosion Proof Equipment Market Revenue Share (%), by Zone 2024 & 2032
- Figure 34: Asia Pacific Explosion Proof Equipment Market Revenue (Million), by End-user 2024 & 2032
- Figure 35: Asia Pacific Explosion Proof Equipment Market Revenue Share (%), by End-user 2024 & 2032
- Figure 36: Asia Pacific Explosion Proof Equipment Market Revenue (Million), by System 2024 & 2032
- Figure 37: Asia Pacific Explosion Proof Equipment Market Revenue Share (%), by System 2024 & 2032
- Figure 38: Asia Pacific Explosion Proof Equipment Market Revenue (Million), by Country 2024 & 2032
- Figure 39: Asia Pacific Explosion Proof Equipment Market Revenue Share (%), by Country 2024 & 2032
- Figure 40: Rest of the World Explosion Proof Equipment Market Revenue (Million), by Method of Protection 2024 & 2032
- Figure 41: Rest of the World Explosion Proof Equipment Market Revenue Share (%), by Method of Protection 2024 & 2032
- Figure 42: Rest of the World Explosion Proof Equipment Market Revenue (Million), by Zone 2024 & 2032
- Figure 43: Rest of the World Explosion Proof Equipment Market Revenue Share (%), by Zone 2024 & 2032
- Figure 44: Rest of the World Explosion Proof Equipment Market Revenue (Million), by End-user 2024 & 2032
- Figure 45: Rest of the World Explosion Proof Equipment Market Revenue Share (%), by End-user 2024 & 2032
- Figure 46: Rest of the World Explosion Proof Equipment Market Revenue (Million), by System 2024 & 2032
- Figure 47: Rest of the World Explosion Proof Equipment Market Revenue Share (%), by System 2024 & 2032
- Figure 48: Rest of the World Explosion Proof Equipment Market Revenue (Million), by Country 2024 & 2032
- Figure 49: Rest of the World Explosion Proof Equipment Market Revenue Share (%), by Country 2024 & 2032
List of Tables
- Table 1: Global Explosion Proof Equipment Market Revenue Million Forecast, by Region 2019 & 2032
- Table 2: Global Explosion Proof Equipment Market Revenue Million Forecast, by Method of Protection 2019 & 2032
- Table 3: Global Explosion Proof Equipment Market Revenue Million Forecast, by Zone 2019 & 2032
- Table 4: Global Explosion Proof Equipment Market Revenue Million Forecast, by End-user 2019 & 2032
- Table 5: Global Explosion Proof Equipment Market Revenue Million Forecast, by System 2019 & 2032
- Table 6: Global Explosion Proof Equipment Market Revenue Million Forecast, by Region 2019 & 2032
- Table 7: Global Explosion Proof Equipment Market Revenue Million Forecast, by Country 2019 & 2032
- Table 8: United States Explosion Proof Equipment Market Revenue (Million) Forecast, by Application 2019 & 2032
- Table 9: Canada Explosion Proof Equipment Market Revenue (Million) Forecast, by Application 2019 & 2032
- Table 10: Global Explosion Proof Equipment Market Revenue Million Forecast, by Country 2019 & 2032
- Table 11: United Kingdom Explosion Proof Equipment Market Revenue (Million) Forecast, by Application 2019 & 2032
- Table 12: Germany Explosion Proof Equipment Market Revenue (Million) Forecast, by Application 2019 & 2032
- Table 13: France Explosion Proof Equipment Market Revenue (Million) Forecast, by Application 2019 & 2032
- Table 14: Rest of Europe Explosion Proof Equipment Market Revenue (Million) Forecast, by Application 2019 & 2032
- Table 15: Global Explosion Proof Equipment Market Revenue Million Forecast, by Country 2019 & 2032
- Table 16: China Explosion Proof Equipment Market Revenue (Million) Forecast, by Application 2019 & 2032
- Table 17: Japan Explosion Proof Equipment Market Revenue (Million) Forecast, by Application 2019 & 2032
- Table 18: India Explosion Proof Equipment Market Revenue (Million) Forecast, by Application 2019 & 2032
- Table 19: Rest of Asia Pacific Explosion Proof Equipment Market Revenue (Million) Forecast, by Application 2019 & 2032
- Table 20: Global Explosion Proof Equipment Market Revenue Million Forecast, by Country 2019 & 2032
- Table 21: Explosion Proof Equipment Market Revenue (Million) Forecast, by Application 2019 & 2032
- Table 22: Global Explosion Proof Equipment Market Revenue Million Forecast, by Method of Protection 2019 & 2032
- Table 23: Global Explosion Proof Equipment Market Revenue Million Forecast, by Zone 2019 & 2032
- Table 24: Global Explosion Proof Equipment Market Revenue Million Forecast, by End-user 2019 & 2032
- Table 25: Global Explosion Proof Equipment Market Revenue Million Forecast, by System 2019 & 2032
- Table 26: Global Explosion Proof Equipment Market Revenue Million Forecast, by Country 2019 & 2032
- Table 27: United States Explosion Proof Equipment Market Revenue (Million) Forecast, by Application 2019 & 2032
- Table 28: Canada Explosion Proof Equipment Market Revenue (Million) Forecast, by Application 2019 & 2032
- Table 29: Global Explosion Proof Equipment Market Revenue Million Forecast, by Method of Protection 2019 & 2032
- Table 30: Global Explosion Proof Equipment Market Revenue Million Forecast, by Zone 2019 & 2032
- Table 31: Global Explosion Proof Equipment Market Revenue Million Forecast, by End-user 2019 & 2032
- Table 32: Global Explosion Proof Equipment Market Revenue Million Forecast, by System 2019 & 2032
- Table 33: Global Explosion Proof Equipment Market Revenue Million Forecast, by Country 2019 & 2032
- Table 34: United Kingdom Explosion Proof Equipment Market Revenue (Million) Forecast, by Application 2019 & 2032
- Table 35: Germany Explosion Proof Equipment Market Revenue (Million) Forecast, by Application 2019 & 2032
- Table 36: France Explosion Proof Equipment Market Revenue (Million) Forecast, by Application 2019 & 2032
- Table 37: Rest of Europe Explosion Proof Equipment Market Revenue (Million) Forecast, by Application 2019 & 2032
- Table 38: Global Explosion Proof Equipment Market Revenue Million Forecast, by Method of Protection 2019 & 2032
- Table 39: Global Explosion Proof Equipment Market Revenue Million Forecast, by Zone 2019 & 2032
- Table 40: Global Explosion Proof Equipment Market Revenue Million Forecast, by End-user 2019 & 2032
- Table 41: Global Explosion Proof Equipment Market Revenue Million Forecast, by System 2019 & 2032
- Table 42: Global Explosion Proof Equipment Market Revenue Million Forecast, by Country 2019 & 2032
- Table 43: China Explosion Proof Equipment Market Revenue (Million) Forecast, by Application 2019 & 2032
- Table 44: Japan Explosion Proof Equipment Market Revenue (Million) Forecast, by Application 2019 & 2032
- Table 45: India Explosion Proof Equipment Market Revenue (Million) Forecast, by Application 2019 & 2032
- Table 46: Rest of Asia Pacific Explosion Proof Equipment Market Revenue (Million) Forecast, by Application 2019 & 2032
- Table 47: Global Explosion Proof Equipment Market Revenue Million Forecast, by Method of Protection 2019 & 2032
- Table 48: Global Explosion Proof Equipment Market Revenue Million Forecast, by Zone 2019 & 2032
- Table 49: Global Explosion Proof Equipment Market Revenue Million Forecast, by End-user 2019 & 2032
- Table 50: Global Explosion Proof Equipment Market Revenue Million Forecast, by System 2019 & 2032
- Table 51: Global Explosion Proof Equipment Market Revenue Million Forecast, by Country 2019 & 2032
Frequently Asked Questions
1. What is the projected Compound Annual Growth Rate (CAGR) of the Explosion Proof Equipment Market?
The projected CAGR is approximately 7.18%.
2. Which companies are prominent players in the Explosion Proof Equipment Market?
Key companies in the market include Intertek Group PLC, ABB Ltd, Adalet Inc, Bartec GmbH, CZ Electric Co Lt, RAE Systems (Honeywell), MAM Explosion-proof Technology (Shanghai) Co Ltd, Marechal Electric Group, Eaton Corporation PLC, Extronics Limited, R STAHL AG, G M International SRL, Cordex Instruments Ltd, Pepperl+Fuchs GmbH, Alloy Industry Co Ltd.
3. What are the main segments of the Explosion Proof Equipment Market?
The market segments include Method of Protection, Zone, End-user, System.
4. Can you provide details about the market size?
The market size is estimated to be USD 9.79 Million as of 2022.
5. What are some drivers contributing to market growth?
Stricter Regulations for Handling Hazardous Areas and Substances; Increasing Energy Requirements Drives the Demand for Exploration of New Mines and Oil and Gas Resources.
6. What are the notable trends driving market growth?
The Mining Industry is Expected to Hold a Significant Share in the Market.
7. Are there any restraints impacting market growth?
Slow Economic Activity Directly Affects the Market; Safety Regulations Vary Across Different Geographies.
8. Can you provide examples of recent developments in the market?
April 2024: ScanReach, a wireless IoT networking company, unveiled a strategic partnership with BARTEC. Together, they aim to introduce an explosion-proof node tailored for seamless sensor data integration in EX zones, specifically targeting the maritime sector. This innovative node, designed for hazardous environments, seamlessly integrates with ScanReach's OWC (Onboard Wireless Connectivity) network, enabling wireless data ingestion and sharing.
9. What pricing options are available for accessing the report?
Pricing options include single-user, multi-user, and enterprise licenses priced at USD 4750, USD 5250, and USD 8750 respectively.
10. Is the market size provided in terms of value or volume?
The market size is provided in terms of value, measured in Million.
11. Are there any specific market keywords associated with the report?
Yes, the market keyword associated with the report is "Explosion Proof Equipment Market," which aids in identifying and referencing the specific market segment covered.
12. How do I determine which pricing option suits my needs best?
The pricing options vary based on user requirements and access needs. Individual users may opt for single-user licenses, while businesses requiring broader access may choose multi-user or enterprise licenses for cost-effective access to the report.
13. Are there any additional resources or data provided in the Explosion Proof Equipment Market report?
While the report offers comprehensive insights, it's advisable to review the specific contents or supplementary materials provided to ascertain if additional resources or data are available.
14. How can I stay updated on further developments or reports in the Explosion Proof Equipment Market?
To stay informed about further developments, trends, and reports in the Explosion Proof Equipment Market, consider subscribing to industry newsletters, following relevant companies and organizations, or regularly checking reputable industry news sources and publications.
Methodology
Step 1 - Identification of Relevant Samples Size from Population Database


Step 2 - Approaches for Defining Global Market Size (Value, Volume* & Price*)

Note*: In applicable scenarios
Step 3 - Data Sources
Primary Research
- Web Analytics
- Survey Reports
- Research Institute
- Latest Research Reports
- Opinion Leaders
Secondary Research
- Annual Reports
- White Paper
- Latest Press Release
- Industry Association
- Paid Database
- Investor Presentations

Step 4 - Data Triangulation
Involves using different sources of information in order to increase the validity of a study
These sources are likely to be stakeholders in a program - participants, other researchers, program staff, other community members, and so on.
Then we put all data in single framework & apply various statistical tools to find out the dynamic on the market.
During the analysis stage, feedback from the stakeholder groups would be compared to determine areas of agreement as well as areas of divergence
