

Key Insights
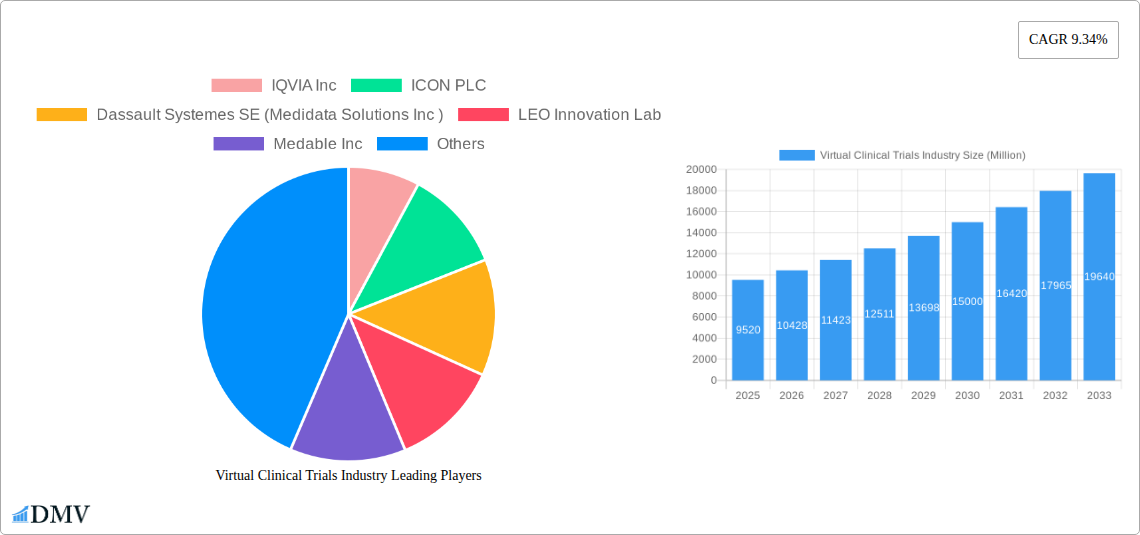
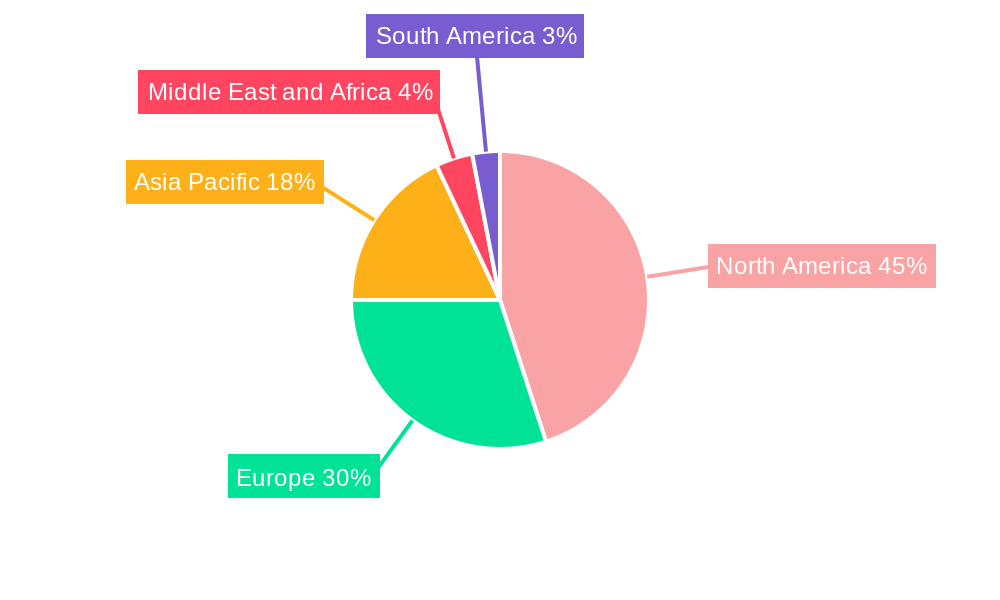
The virtual clinical trials (VCT) market, valued at $9.52 billion in 2025, is experiencing robust growth, projected to expand at a compound annual growth rate (CAGR) of 9.34% from 2025 to 2033. This surge is driven by several factors. Firstly, the increasing need for faster, more efficient, and cost-effective clinical trials is compelling pharmaceutical and biotechnology companies to adopt VCT technologies. Secondly, advancements in technology, particularly in telehealth, remote patient monitoring, and data analytics, are enabling the seamless execution of virtual trials, improving patient engagement and data quality. Furthermore, regulatory support and the growing acceptance of decentralized clinical trials (DCTs) are facilitating wider adoption. The market is segmented by study design (observational, interventional, expanded access) and indication type (cardiovascular disease, oncology, other indications). Observational studies currently dominate, but interventional trials are expected to witness significant growth due to technological advancements enabling remote monitoring and data collection. Similarly, oncology trials represent a major segment driven by the high demand for efficient drug development in this therapeutic area. Geographic expansion is also a key driver, with North America currently holding the largest market share, followed by Europe and Asia Pacific. However, emerging markets in Asia Pacific and the Middle East & Africa are demonstrating promising growth potential. The competitive landscape includes prominent players like IQVIA, ICON PLC, and Medidata Solutions, alongside several smaller, specialized technology providers.
The future of VCTs hinges on addressing certain challenges. Data security and privacy concerns require robust solutions. The need for digital literacy among patients and investigators necessitates targeted training programs. Ensuring equitable access to VCTs across diverse patient populations remains a crucial concern that must be addressed to avoid exacerbating existing healthcare disparities. Despite these challenges, the long-term outlook for the VCT market remains positive. The integration of artificial intelligence (AI) and machine learning (ML) into VCTs promises to further optimize trial design, reduce costs, and accelerate drug development, furthering the market's expansion in the coming years. The industry’s focus on improving patient experience and engagement through innovative technological advancements will be critical for continued growth and broader adoption.
Virtual Clinical Trials Industry: A Comprehensive Market Report (2019-2033)
This insightful report provides a comprehensive analysis of the Virtual Clinical Trials industry, projecting a market valuation exceeding $xx Million by 2033. It delves into market dynamics, technological advancements, and key players shaping this rapidly evolving landscape, offering crucial insights for stakeholders seeking to navigate and capitalize on emerging opportunities. The report covers the period 2019-2033, with a base year of 2025 and a forecast period spanning 2025-2033.
Virtual Clinical Trials Industry Market Composition & Trends
This section analyzes the competitive landscape, innovation drivers, and regulatory factors influencing the Virtual Clinical Trials market. The market exhibits a moderately concentrated structure, with key players like IQVIA Inc, ICON PLC, and Dassault Systèmes SE (Medidata Solutions Inc) holding significant market share. The combined market share of the top 5 companies is estimated at xx%, highlighting the presence of both established players and emerging innovators. The market is characterized by continuous innovation, driven by advancements in telehealth, wearable technology, and AI-powered data analytics. Regulatory landscapes are evolving, with agencies like the FDA actively promoting the adoption of virtual trials to accelerate drug development. Substitute products remain limited, bolstering industry growth. End-users primarily include pharmaceutical and biotechnology companies, Contract Research Organizations (CROs), and academic research institutions. M&A activity has been significant, with deal values exceeding $xx Million in the historical period (2019-2024), reflecting industry consolidation and expansion.
- Market Concentration: Top 5 players hold an estimated xx% market share in 2025.
- Innovation Catalysts: Advancements in telehealth, AI, and wearable technologies.
- Regulatory Landscape: Evolving guidelines from FDA and other regulatory bodies.
- M&A Activity: Deal values exceeded $xx Million from 2019-2024.
Virtual Clinical Trials Industry Industry Evolution
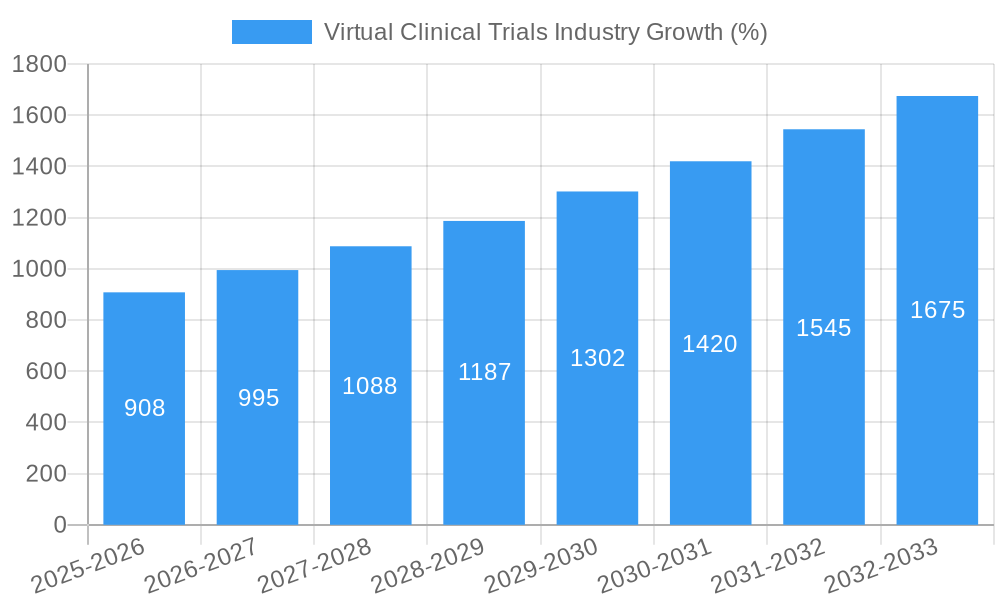
The Virtual Clinical Trials market has witnessed exponential growth, fueled by technological advancements and evolving patient preferences. From 2019 to 2024, the market expanded at a Compound Annual Growth Rate (CAGR) of xx%, reaching $xx Million in 2024. This growth trajectory is projected to continue, with a forecasted CAGR of xx% from 2025 to 2033, driven by factors such as increasing adoption of digital health technologies, rising demand for cost-effective clinical trials, and the need to accelerate drug development processes. Technological advancements, including the integration of artificial intelligence (AI) for data analysis and remote patient monitoring devices, are significantly enhancing the efficiency and efficacy of virtual trials. Furthermore, shifting consumer demands for convenient and accessible healthcare options are fueling the adoption of these innovative approaches. The adoption rate of virtual trials within clinical research is expected to increase from xx% in 2024 to xx% by 2033.
Leading Regions, Countries, or Segments in Virtual Clinical Trials Industry
North America currently dominates the Virtual Clinical Trials market, driven by significant investments in digital health technologies, robust regulatory frameworks, and the presence of major pharmaceutical companies. Within study designs, interventional trials constitute the largest segment, while oncology leads in indication type.
- North America Dominance: Driven by high investment in digital health, strong regulatory support, and a large pharmaceutical industry presence.
- Interventional Trials: Largest segment by study design due to suitability for virtual methodologies.
- Oncology Indication: Leading indication type due to high research activity and patient demand for convenient treatment options.
- Europe & Asia-Pacific: Significant growth potential due to increasing adoption of digital health technologies and supportive government policies.
Virtual Clinical Trials Industry Product Innovations
Recent innovations include AI-powered platforms for patient recruitment and data analysis, enhanced remote patient monitoring devices, and improved eConsent solutions. These innovations offer superior data quality, enhanced patient engagement, and reduced trial timelines. Unique selling propositions often center around enhanced data security, streamlined workflows, and the ability to reach geographically dispersed patient populations.
Propelling Factors for Virtual Clinical Trials Industry Growth
The industry's growth is driven by several factors including decreasing trial costs, increased patient access, faster recruitment, and advancements in remote patient monitoring and data analytics. Regulatory support from agencies like the FDA further accelerates market expansion. The convergence of technological advancements and a shift towards patient-centric care is central to the industry's upward trajectory.
Obstacles in the Virtual Clinical Trials Industry Market
Challenges include ensuring data privacy and security, addressing technological limitations in certain regions, and navigating complex regulatory landscapes. High initial investment costs and potential for disparities in patient access to technology also pose constraints. The competitive intensity within the market adds another layer of complexity.
Future Opportunities in Virtual Clinical Trials Industry
Emerging opportunities lie in expanding into new therapeutic areas, developing more sophisticated AI-driven tools, and leveraging the potential of decentralized clinical trials. Growth in emerging markets and the integration of blockchain technology for enhanced data security represent promising avenues for future expansion.
Major Players in the Virtual Clinical Trials Industry Ecosystem
- IQVIA Inc
- ICON PLC
- Dassault Systemes SE (Medidata Solutions Inc)
- LEO Innovation Lab
- Medable Inc
- Parexel International Corporation
- Oracle Corporation
- Signant Health
- Clinical Ink Inc
- Medpace Holdings Inc
- Laboratory Corporation of America Holdings (Covance Inc)
Key Developments in Virtual Clinical Trials Industry Industry
- 2022-Q4: Medable Inc. launches a new platform integrating AI-powered patient engagement tools.
- 2023-Q1: IQVIA Inc. announces a strategic partnership to expand its virtual trial capabilities in Asia.
- 2023-Q3: FDA releases updated guidelines on the use of virtual technologies in clinical trials. (Further developments can be added here)
Strategic Virtual Clinical Trials Industry Market Forecast
The Virtual Clinical Trials market is poised for sustained growth, driven by ongoing technological advancements, supportive regulatory environments, and an increasing emphasis on patient-centric care. The market's expanding scope and innovative solutions suggest considerable future potential, with significant opportunities for expansion across diverse therapeutic areas and geographies. The integration of cutting-edge technologies like AI and blockchain will further propel market growth and redefine the landscape of clinical research.
Virtual Clinical Trials Industry Segmentation
-
1. Study Design
- 1.1. Observational
- 1.2. Intervensional
- 1.3. Expanded Access
-
2. Indication Type
- 2.1. Cardiovascular Disease
- 2.2. Oncology
- 2.3. Other Indication Types
Virtual Clinical Trials Industry Segmentation By Geography
-
1. North America
- 1.1. United States
- 1.2. Canada
- 1.3. Mexico
-
2. Europe
- 2.1. Germany
- 2.2. United Kingdom
- 2.3. France
- 2.4. Italy
- 2.5. Spain
- 2.6. Rest of Europe
-
3. Asia Pacific
- 3.1. China
- 3.2. Japan
- 3.3. India
- 3.4. Australia
- 3.5. South Korea
- 3.6. Rest of Asia Pacific
-
4. Middle East and Africa
- 4.1. GCC
- 4.2. South Africa
- 4.3. Rest of Middle East and Africa
-
5. South America
- 5.1. Brazil
- 5.2. Argentina
- 5.3. Rest of South America
Virtual Clinical Trials Industry REPORT HIGHLIGHTS
| Aspects | Details |
|---|---|
| Study Period | 2019-2033 |
| Base Year | 2024 |
| Estimated Year | 2025 |
| Forecast Period | 2025-2033 |
| Historical Period | 2019-2024 |
| Growth Rate | CAGR of 9.34% from 2019-2033 |
| Segmentation |
|
Table of Contents
- 1. Introduction
- 1.1. Research Scope
- 1.2. Market Segmentation
- 1.3. Research Methodology
- 1.4. Definitions and Assumptions
- 2. Executive Summary
- 2.1. Introduction
- 3. Market Dynamics
- 3.1. Introduction
- 3.2. Market Drivers
- 3.2.1. Growing Digitization in Healthcare Sector; Technological Advancements in Virtual Clinical Trials; Prevalence of Chronic Disease
- 3.3. Market Restrains
- 3.3.1. Challenges Associated with the Virtual Clinical Trials
- 3.4. Market Trends
- 3.4.1. The Oncology Segment is Expected to Occupy a Significant Share of the Market Over the Forecast Period
- 4. Market Factor Analysis
- 4.1. Porters Five Forces
- 4.2. Supply/Value Chain
- 4.3. PESTEL analysis
- 4.4. Market Entropy
- 4.5. Patent/Trademark Analysis
- 5. Global Virtual Clinical Trials Industry Analysis, Insights and Forecast, 2019-2031
- 5.1. Market Analysis, Insights and Forecast - by Study Design
- 5.1.1. Observational
- 5.1.2. Intervensional
- 5.1.3. Expanded Access
- 5.2. Market Analysis, Insights and Forecast - by Indication Type
- 5.2.1. Cardiovascular Disease
- 5.2.2. Oncology
- 5.2.3. Other Indication Types
- 5.3. Market Analysis, Insights and Forecast - by Region
- 5.3.1. North America
- 5.3.2. Europe
- 5.3.3. Asia Pacific
- 5.3.4. Middle East and Africa
- 5.3.5. South America
- 5.1. Market Analysis, Insights and Forecast - by Study Design
- 6. North America Virtual Clinical Trials Industry Analysis, Insights and Forecast, 2019-2031
- 6.1. Market Analysis, Insights and Forecast - by Study Design
- 6.1.1. Observational
- 6.1.2. Intervensional
- 6.1.3. Expanded Access
- 6.2. Market Analysis, Insights and Forecast - by Indication Type
- 6.2.1. Cardiovascular Disease
- 6.2.2. Oncology
- 6.2.3. Other Indication Types
- 6.1. Market Analysis, Insights and Forecast - by Study Design
- 7. Europe Virtual Clinical Trials Industry Analysis, Insights and Forecast, 2019-2031
- 7.1. Market Analysis, Insights and Forecast - by Study Design
- 7.1.1. Observational
- 7.1.2. Intervensional
- 7.1.3. Expanded Access
- 7.2. Market Analysis, Insights and Forecast - by Indication Type
- 7.2.1. Cardiovascular Disease
- 7.2.2. Oncology
- 7.2.3. Other Indication Types
- 7.1. Market Analysis, Insights and Forecast - by Study Design
- 8. Asia Pacific Virtual Clinical Trials Industry Analysis, Insights and Forecast, 2019-2031
- 8.1. Market Analysis, Insights and Forecast - by Study Design
- 8.1.1. Observational
- 8.1.2. Intervensional
- 8.1.3. Expanded Access
- 8.2. Market Analysis, Insights and Forecast - by Indication Type
- 8.2.1. Cardiovascular Disease
- 8.2.2. Oncology
- 8.2.3. Other Indication Types
- 8.1. Market Analysis, Insights and Forecast - by Study Design
- 9. Middle East and Africa Virtual Clinical Trials Industry Analysis, Insights and Forecast, 2019-2031
- 9.1. Market Analysis, Insights and Forecast - by Study Design
- 9.1.1. Observational
- 9.1.2. Intervensional
- 9.1.3. Expanded Access
- 9.2. Market Analysis, Insights and Forecast - by Indication Type
- 9.2.1. Cardiovascular Disease
- 9.2.2. Oncology
- 9.2.3. Other Indication Types
- 9.1. Market Analysis, Insights and Forecast - by Study Design
- 10. South America Virtual Clinical Trials Industry Analysis, Insights and Forecast, 2019-2031
- 10.1. Market Analysis, Insights and Forecast - by Study Design
- 10.1.1. Observational
- 10.1.2. Intervensional
- 10.1.3. Expanded Access
- 10.2. Market Analysis, Insights and Forecast - by Indication Type
- 10.2.1. Cardiovascular Disease
- 10.2.2. Oncology
- 10.2.3. Other Indication Types
- 10.1. Market Analysis, Insights and Forecast - by Study Design
- 11. North America Virtual Clinical Trials Industry Analysis, Insights and Forecast, 2019-2031
- 11.1. Market Analysis, Insights and Forecast - By Country/Sub-region
- 11.1.1 United States
- 11.1.2 Canada
- 11.1.3 Mexico
- 12. Europe Virtual Clinical Trials Industry Analysis, Insights and Forecast, 2019-2031
- 12.1. Market Analysis, Insights and Forecast - By Country/Sub-region
- 12.1.1 Germany
- 12.1.2 United Kingdom
- 12.1.3 France
- 12.1.4 Italy
- 12.1.5 Spain
- 12.1.6 Rest of Europe
- 13. Asia Pacific Virtual Clinical Trials Industry Analysis, Insights and Forecast, 2019-2031
- 13.1. Market Analysis, Insights and Forecast - By Country/Sub-region
- 13.1.1 China
- 13.1.2 Japan
- 13.1.3 India
- 13.1.4 Australia
- 13.1.5 South Korea
- 13.1.6 Rest of Asia Pacific
- 14. Middle East and Africa Virtual Clinical Trials Industry Analysis, Insights and Forecast, 2019-2031
- 14.1. Market Analysis, Insights and Forecast - By Country/Sub-region
- 14.1.1 GCC
- 14.1.2 South Africa
- 14.1.3 Rest of Middle East and Africa
- 15. South America Virtual Clinical Trials Industry Analysis, Insights and Forecast, 2019-2031
- 15.1. Market Analysis, Insights and Forecast - By Country/Sub-region
- 15.1.1 Brazil
- 15.1.2 Argentina
- 15.1.3 Rest of South America
- 16. Competitive Analysis
- 16.1. Global Market Share Analysis 2024
- 16.2. Company Profiles
- 16.2.1 IQVIA Inc
- 16.2.1.1. Overview
- 16.2.1.2. Products
- 16.2.1.3. SWOT Analysis
- 16.2.1.4. Recent Developments
- 16.2.1.5. Financials (Based on Availability)
- 16.2.2 ICON PLC
- 16.2.2.1. Overview
- 16.2.2.2. Products
- 16.2.2.3. SWOT Analysis
- 16.2.2.4. Recent Developments
- 16.2.2.5. Financials (Based on Availability)
- 16.2.3 Dassault Systemes SE (Medidata Solutions Inc )
- 16.2.3.1. Overview
- 16.2.3.2. Products
- 16.2.3.3. SWOT Analysis
- 16.2.3.4. Recent Developments
- 16.2.3.5. Financials (Based on Availability)
- 16.2.4 LEO Innovation Lab
- 16.2.4.1. Overview
- 16.2.4.2. Products
- 16.2.4.3. SWOT Analysis
- 16.2.4.4. Recent Developments
- 16.2.4.5. Financials (Based on Availability)
- 16.2.5 Medable Inc
- 16.2.5.1. Overview
- 16.2.5.2. Products
- 16.2.5.3. SWOT Analysis
- 16.2.5.4. Recent Developments
- 16.2.5.5. Financials (Based on Availability)
- 16.2.6 Parexel International Corporation
- 16.2.6.1. Overview
- 16.2.6.2. Products
- 16.2.6.3. SWOT Analysis
- 16.2.6.4. Recent Developments
- 16.2.6.5. Financials (Based on Availability)
- 16.2.7 Oracle Corporation
- 16.2.7.1. Overview
- 16.2.7.2. Products
- 16.2.7.3. SWOT Analysis
- 16.2.7.4. Recent Developments
- 16.2.7.5. Financials (Based on Availability)
- 16.2.8 Signant Health
- 16.2.8.1. Overview
- 16.2.8.2. Products
- 16.2.8.3. SWOT Analysis
- 16.2.8.4. Recent Developments
- 16.2.8.5. Financials (Based on Availability)
- 16.2.9 Clinical Ink Inc
- 16.2.9.1. Overview
- 16.2.9.2. Products
- 16.2.9.3. SWOT Analysis
- 16.2.9.4. Recent Developments
- 16.2.9.5. Financials (Based on Availability)
- 16.2.10 Medpace Holdings Inc
- 16.2.10.1. Overview
- 16.2.10.2. Products
- 16.2.10.3. SWOT Analysis
- 16.2.10.4. Recent Developments
- 16.2.10.5. Financials (Based on Availability)
- 16.2.11 Laboratory Corporation of America Holdings (Covance Inc )
- 16.2.11.1. Overview
- 16.2.11.2. Products
- 16.2.11.3. SWOT Analysis
- 16.2.11.4. Recent Developments
- 16.2.11.5. Financials (Based on Availability)
- 16.2.1 IQVIA Inc
List of Figures
- Figure 1: Global Virtual Clinical Trials Industry Revenue Breakdown (Million, %) by Region 2024 & 2032
- Figure 2: North America Virtual Clinical Trials Industry Revenue (Million), by Country 2024 & 2032
- Figure 3: North America Virtual Clinical Trials Industry Revenue Share (%), by Country 2024 & 2032
- Figure 4: Europe Virtual Clinical Trials Industry Revenue (Million), by Country 2024 & 2032
- Figure 5: Europe Virtual Clinical Trials Industry Revenue Share (%), by Country 2024 & 2032
- Figure 6: Asia Pacific Virtual Clinical Trials Industry Revenue (Million), by Country 2024 & 2032
- Figure 7: Asia Pacific Virtual Clinical Trials Industry Revenue Share (%), by Country 2024 & 2032
- Figure 8: Middle East and Africa Virtual Clinical Trials Industry Revenue (Million), by Country 2024 & 2032
- Figure 9: Middle East and Africa Virtual Clinical Trials Industry Revenue Share (%), by Country 2024 & 2032
- Figure 10: South America Virtual Clinical Trials Industry Revenue (Million), by Country 2024 & 2032
- Figure 11: South America Virtual Clinical Trials Industry Revenue Share (%), by Country 2024 & 2032
- Figure 12: North America Virtual Clinical Trials Industry Revenue (Million), by Study Design 2024 & 2032
- Figure 13: North America Virtual Clinical Trials Industry Revenue Share (%), by Study Design 2024 & 2032
- Figure 14: North America Virtual Clinical Trials Industry Revenue (Million), by Indication Type 2024 & 2032
- Figure 15: North America Virtual Clinical Trials Industry Revenue Share (%), by Indication Type 2024 & 2032
- Figure 16: North America Virtual Clinical Trials Industry Revenue (Million), by Country 2024 & 2032
- Figure 17: North America Virtual Clinical Trials Industry Revenue Share (%), by Country 2024 & 2032
- Figure 18: Europe Virtual Clinical Trials Industry Revenue (Million), by Study Design 2024 & 2032
- Figure 19: Europe Virtual Clinical Trials Industry Revenue Share (%), by Study Design 2024 & 2032
- Figure 20: Europe Virtual Clinical Trials Industry Revenue (Million), by Indication Type 2024 & 2032
- Figure 21: Europe Virtual Clinical Trials Industry Revenue Share (%), by Indication Type 2024 & 2032
- Figure 22: Europe Virtual Clinical Trials Industry Revenue (Million), by Country 2024 & 2032
- Figure 23: Europe Virtual Clinical Trials Industry Revenue Share (%), by Country 2024 & 2032
- Figure 24: Asia Pacific Virtual Clinical Trials Industry Revenue (Million), by Study Design 2024 & 2032
- Figure 25: Asia Pacific Virtual Clinical Trials Industry Revenue Share (%), by Study Design 2024 & 2032
- Figure 26: Asia Pacific Virtual Clinical Trials Industry Revenue (Million), by Indication Type 2024 & 2032
- Figure 27: Asia Pacific Virtual Clinical Trials Industry Revenue Share (%), by Indication Type 2024 & 2032
- Figure 28: Asia Pacific Virtual Clinical Trials Industry Revenue (Million), by Country 2024 & 2032
- Figure 29: Asia Pacific Virtual Clinical Trials Industry Revenue Share (%), by Country 2024 & 2032
- Figure 30: Middle East and Africa Virtual Clinical Trials Industry Revenue (Million), by Study Design 2024 & 2032
- Figure 31: Middle East and Africa Virtual Clinical Trials Industry Revenue Share (%), by Study Design 2024 & 2032
- Figure 32: Middle East and Africa Virtual Clinical Trials Industry Revenue (Million), by Indication Type 2024 & 2032
- Figure 33: Middle East and Africa Virtual Clinical Trials Industry Revenue Share (%), by Indication Type 2024 & 2032
- Figure 34: Middle East and Africa Virtual Clinical Trials Industry Revenue (Million), by Country 2024 & 2032
- Figure 35: Middle East and Africa Virtual Clinical Trials Industry Revenue Share (%), by Country 2024 & 2032
- Figure 36: South America Virtual Clinical Trials Industry Revenue (Million), by Study Design 2024 & 2032
- Figure 37: South America Virtual Clinical Trials Industry Revenue Share (%), by Study Design 2024 & 2032
- Figure 38: South America Virtual Clinical Trials Industry Revenue (Million), by Indication Type 2024 & 2032
- Figure 39: South America Virtual Clinical Trials Industry Revenue Share (%), by Indication Type 2024 & 2032
- Figure 40: South America Virtual Clinical Trials Industry Revenue (Million), by Country 2024 & 2032
- Figure 41: South America Virtual Clinical Trials Industry Revenue Share (%), by Country 2024 & 2032
List of Tables
- Table 1: Global Virtual Clinical Trials Industry Revenue Million Forecast, by Region 2019 & 2032
- Table 2: Global Virtual Clinical Trials Industry Revenue Million Forecast, by Study Design 2019 & 2032
- Table 3: Global Virtual Clinical Trials Industry Revenue Million Forecast, by Indication Type 2019 & 2032
- Table 4: Global Virtual Clinical Trials Industry Revenue Million Forecast, by Region 2019 & 2032
- Table 5: Global Virtual Clinical Trials Industry Revenue Million Forecast, by Country 2019 & 2032
- Table 6: United States Virtual Clinical Trials Industry Revenue (Million) Forecast, by Application 2019 & 2032
- Table 7: Canada Virtual Clinical Trials Industry Revenue (Million) Forecast, by Application 2019 & 2032
- Table 8: Mexico Virtual Clinical Trials Industry Revenue (Million) Forecast, by Application 2019 & 2032
- Table 9: Global Virtual Clinical Trials Industry Revenue Million Forecast, by Country 2019 & 2032
- Table 10: Germany Virtual Clinical Trials Industry Revenue (Million) Forecast, by Application 2019 & 2032
- Table 11: United Kingdom Virtual Clinical Trials Industry Revenue (Million) Forecast, by Application 2019 & 2032
- Table 12: France Virtual Clinical Trials Industry Revenue (Million) Forecast, by Application 2019 & 2032
- Table 13: Italy Virtual Clinical Trials Industry Revenue (Million) Forecast, by Application 2019 & 2032
- Table 14: Spain Virtual Clinical Trials Industry Revenue (Million) Forecast, by Application 2019 & 2032
- Table 15: Rest of Europe Virtual Clinical Trials Industry Revenue (Million) Forecast, by Application 2019 & 2032
- Table 16: Global Virtual Clinical Trials Industry Revenue Million Forecast, by Country 2019 & 2032
- Table 17: China Virtual Clinical Trials Industry Revenue (Million) Forecast, by Application 2019 & 2032
- Table 18: Japan Virtual Clinical Trials Industry Revenue (Million) Forecast, by Application 2019 & 2032
- Table 19: India Virtual Clinical Trials Industry Revenue (Million) Forecast, by Application 2019 & 2032
- Table 20: Australia Virtual Clinical Trials Industry Revenue (Million) Forecast, by Application 2019 & 2032
- Table 21: South Korea Virtual Clinical Trials Industry Revenue (Million) Forecast, by Application 2019 & 2032
- Table 22: Rest of Asia Pacific Virtual Clinical Trials Industry Revenue (Million) Forecast, by Application 2019 & 2032
- Table 23: Global Virtual Clinical Trials Industry Revenue Million Forecast, by Country 2019 & 2032
- Table 24: GCC Virtual Clinical Trials Industry Revenue (Million) Forecast, by Application 2019 & 2032
- Table 25: South Africa Virtual Clinical Trials Industry Revenue (Million) Forecast, by Application 2019 & 2032
- Table 26: Rest of Middle East and Africa Virtual Clinical Trials Industry Revenue (Million) Forecast, by Application 2019 & 2032
- Table 27: Global Virtual Clinical Trials Industry Revenue Million Forecast, by Country 2019 & 2032
- Table 28: Brazil Virtual Clinical Trials Industry Revenue (Million) Forecast, by Application 2019 & 2032
- Table 29: Argentina Virtual Clinical Trials Industry Revenue (Million) Forecast, by Application 2019 & 2032
- Table 30: Rest of South America Virtual Clinical Trials Industry Revenue (Million) Forecast, by Application 2019 & 2032
- Table 31: Global Virtual Clinical Trials Industry Revenue Million Forecast, by Study Design 2019 & 2032
- Table 32: Global Virtual Clinical Trials Industry Revenue Million Forecast, by Indication Type 2019 & 2032
- Table 33: Global Virtual Clinical Trials Industry Revenue Million Forecast, by Country 2019 & 2032
- Table 34: United States Virtual Clinical Trials Industry Revenue (Million) Forecast, by Application 2019 & 2032
- Table 35: Canada Virtual Clinical Trials Industry Revenue (Million) Forecast, by Application 2019 & 2032
- Table 36: Mexico Virtual Clinical Trials Industry Revenue (Million) Forecast, by Application 2019 & 2032
- Table 37: Global Virtual Clinical Trials Industry Revenue Million Forecast, by Study Design 2019 & 2032
- Table 38: Global Virtual Clinical Trials Industry Revenue Million Forecast, by Indication Type 2019 & 2032
- Table 39: Global Virtual Clinical Trials Industry Revenue Million Forecast, by Country 2019 & 2032
- Table 40: Germany Virtual Clinical Trials Industry Revenue (Million) Forecast, by Application 2019 & 2032
- Table 41: United Kingdom Virtual Clinical Trials Industry Revenue (Million) Forecast, by Application 2019 & 2032
- Table 42: France Virtual Clinical Trials Industry Revenue (Million) Forecast, by Application 2019 & 2032
- Table 43: Italy Virtual Clinical Trials Industry Revenue (Million) Forecast, by Application 2019 & 2032
- Table 44: Spain Virtual Clinical Trials Industry Revenue (Million) Forecast, by Application 2019 & 2032
- Table 45: Rest of Europe Virtual Clinical Trials Industry Revenue (Million) Forecast, by Application 2019 & 2032
- Table 46: Global Virtual Clinical Trials Industry Revenue Million Forecast, by Study Design 2019 & 2032
- Table 47: Global Virtual Clinical Trials Industry Revenue Million Forecast, by Indication Type 2019 & 2032
- Table 48: Global Virtual Clinical Trials Industry Revenue Million Forecast, by Country 2019 & 2032
- Table 49: China Virtual Clinical Trials Industry Revenue (Million) Forecast, by Application 2019 & 2032
- Table 50: Japan Virtual Clinical Trials Industry Revenue (Million) Forecast, by Application 2019 & 2032
- Table 51: India Virtual Clinical Trials Industry Revenue (Million) Forecast, by Application 2019 & 2032
- Table 52: Australia Virtual Clinical Trials Industry Revenue (Million) Forecast, by Application 2019 & 2032
- Table 53: South Korea Virtual Clinical Trials Industry Revenue (Million) Forecast, by Application 2019 & 2032
- Table 54: Rest of Asia Pacific Virtual Clinical Trials Industry Revenue (Million) Forecast, by Application 2019 & 2032
- Table 55: Global Virtual Clinical Trials Industry Revenue Million Forecast, by Study Design 2019 & 2032
- Table 56: Global Virtual Clinical Trials Industry Revenue Million Forecast, by Indication Type 2019 & 2032
- Table 57: Global Virtual Clinical Trials Industry Revenue Million Forecast, by Country 2019 & 2032
- Table 58: GCC Virtual Clinical Trials Industry Revenue (Million) Forecast, by Application 2019 & 2032
- Table 59: South Africa Virtual Clinical Trials Industry Revenue (Million) Forecast, by Application 2019 & 2032
- Table 60: Rest of Middle East and Africa Virtual Clinical Trials Industry Revenue (Million) Forecast, by Application 2019 & 2032
- Table 61: Global Virtual Clinical Trials Industry Revenue Million Forecast, by Study Design 2019 & 2032
- Table 62: Global Virtual Clinical Trials Industry Revenue Million Forecast, by Indication Type 2019 & 2032
- Table 63: Global Virtual Clinical Trials Industry Revenue Million Forecast, by Country 2019 & 2032
- Table 64: Brazil Virtual Clinical Trials Industry Revenue (Million) Forecast, by Application 2019 & 2032
- Table 65: Argentina Virtual Clinical Trials Industry Revenue (Million) Forecast, by Application 2019 & 2032
- Table 66: Rest of South America Virtual Clinical Trials Industry Revenue (Million) Forecast, by Application 2019 & 2032
Frequently Asked Questions
1. What is the projected Compound Annual Growth Rate (CAGR) of the Virtual Clinical Trials Industry?
The projected CAGR is approximately 9.34%.
2. Which companies are prominent players in the Virtual Clinical Trials Industry?
Key companies in the market include IQVIA Inc, ICON PLC, Dassault Systemes SE (Medidata Solutions Inc ), LEO Innovation Lab, Medable Inc, Parexel International Corporation, Oracle Corporation, Signant Health, Clinical Ink Inc, Medpace Holdings Inc, Laboratory Corporation of America Holdings (Covance Inc ).
3. What are the main segments of the Virtual Clinical Trials Industry?
The market segments include Study Design, Indication Type.
4. Can you provide details about the market size?
The market size is estimated to be USD 9.52 Million as of 2022.
5. What are some drivers contributing to market growth?
Growing Digitization in Healthcare Sector; Technological Advancements in Virtual Clinical Trials; Prevalence of Chronic Disease.
6. What are the notable trends driving market growth?
The Oncology Segment is Expected to Occupy a Significant Share of the Market Over the Forecast Period.
7. Are there any restraints impacting market growth?
Challenges Associated with the Virtual Clinical Trials.
8. Can you provide examples of recent developments in the market?
N/A
9. What pricing options are available for accessing the report?
Pricing options include single-user, multi-user, and enterprise licenses priced at USD 4750, USD 5250, and USD 8750 respectively.
10. Is the market size provided in terms of value or volume?
The market size is provided in terms of value, measured in Million.
11. Are there any specific market keywords associated with the report?
Yes, the market keyword associated with the report is "Virtual Clinical Trials Industry," which aids in identifying and referencing the specific market segment covered.
12. How do I determine which pricing option suits my needs best?
The pricing options vary based on user requirements and access needs. Individual users may opt for single-user licenses, while businesses requiring broader access may choose multi-user or enterprise licenses for cost-effective access to the report.
13. Are there any additional resources or data provided in the Virtual Clinical Trials Industry report?
While the report offers comprehensive insights, it's advisable to review the specific contents or supplementary materials provided to ascertain if additional resources or data are available.
14. How can I stay updated on further developments or reports in the Virtual Clinical Trials Industry?
To stay informed about further developments, trends, and reports in the Virtual Clinical Trials Industry, consider subscribing to industry newsletters, following relevant companies and organizations, or regularly checking reputable industry news sources and publications.
Methodology
Step 1 - Identification of Relevant Samples Size from Population Database


Step 2 - Approaches for Defining Global Market Size (Value, Volume* & Price*)

Note*: In applicable scenarios
Step 3 - Data Sources
Primary Research
- Web Analytics
- Survey Reports
- Research Institute
- Latest Research Reports
- Opinion Leaders
Secondary Research
- Annual Reports
- White Paper
- Latest Press Release
- Industry Association
- Paid Database
- Investor Presentations

Step 4 - Data Triangulation
Involves using different sources of information in order to increase the validity of a study
These sources are likely to be stakeholders in a program - participants, other researchers, program staff, other community members, and so on.
Then we put all data in single framework & apply various statistical tools to find out the dynamic on the market.
During the analysis stage, feedback from the stakeholder groups would be compared to determine areas of agreement as well as areas of divergence
