

Key Insights
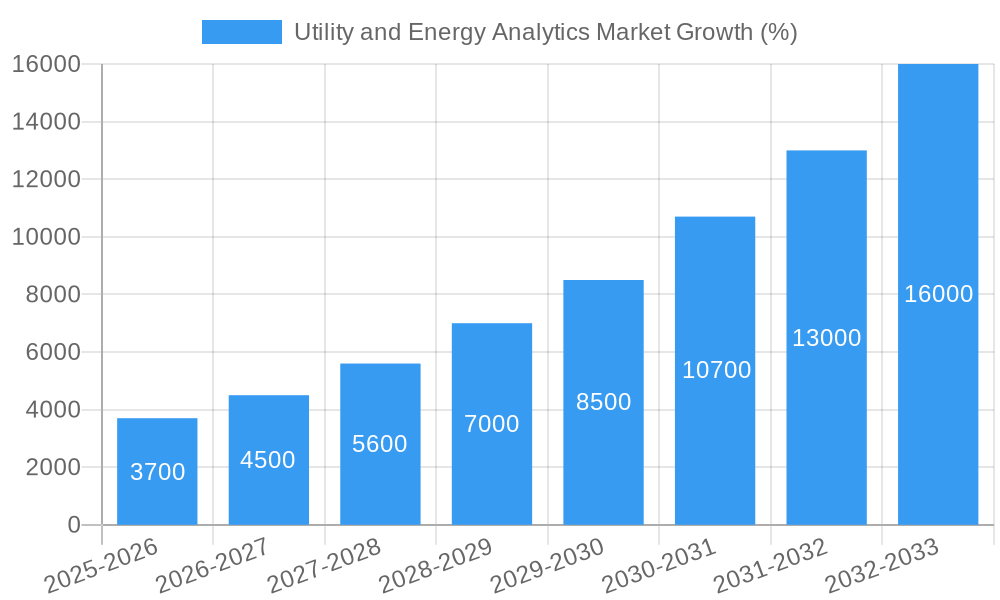
The Utility and Energy Analytics market is experiencing robust growth, driven by the increasing need for efficient grid management, renewable energy integration, and improved customer service. A compound annual growth rate (CAGR) of 24.90% from 2019 to 2024 indicates a rapidly expanding market. This growth is fueled by several key factors. The rising adoption of smart meters and advanced metering infrastructure (AMI) provides vast amounts of data, creating a demand for sophisticated analytics solutions to optimize operations and reduce costs. Furthermore, the increasing penetration of renewable energy sources, like solar and wind power, necessitates advanced forecasting and grid management tools to ensure grid stability and reliability. Regulatory pressures to improve efficiency and reduce carbon emissions are also driving investments in analytics technologies. The market segmentation reveals strong growth across all application areas, with Meter Operation and Load Forecasting leading the way. Cloud-based deployment models are gaining significant traction due to their scalability, flexibility, and cost-effectiveness. Major players, including SAS, Teradata, IBM, and others, are actively competing to capture market share, fostering innovation and accelerating market development.
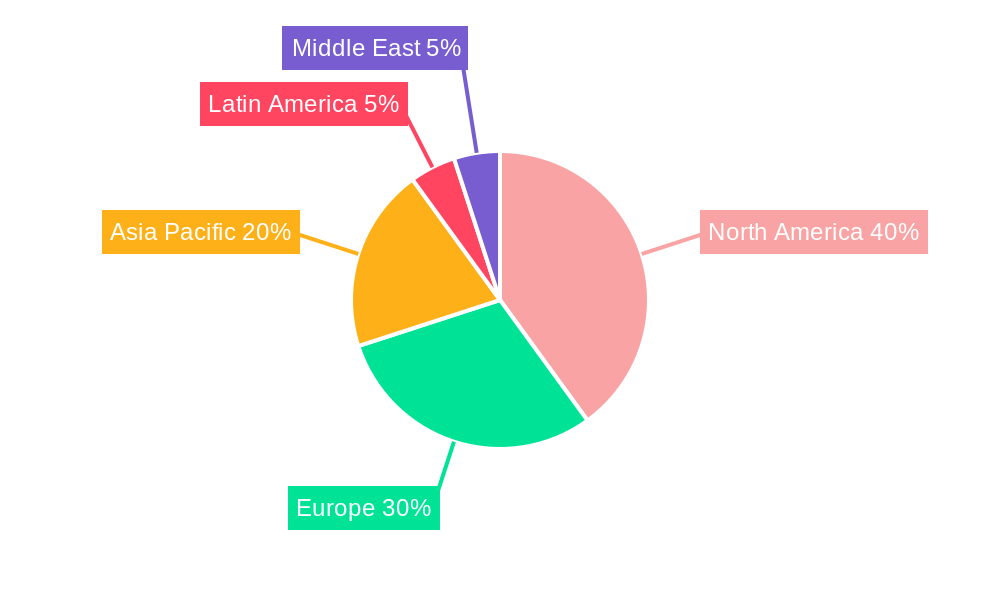
The market is segmented by type (Software and Services), application (Meter Operation, Load Forecasting, Demand Response, Distribution Planning, and Other Applications), and deployment (Cloud and On-premise). While precise regional market share data is unavailable, North America is expected to hold a significant share, followed by Europe and the Asia-Pacific region. The ongoing digital transformation within the utility sector, coupled with the increasing adoption of artificial intelligence (AI) and machine learning (ML) for predictive analytics, will continue to drive market expansion. However, challenges remain, including the high initial investment costs associated with implementing analytics solutions and the need for skilled professionals to manage and interpret the data. Despite these restraints, the long-term outlook for the Utility and Energy Analytics market remains exceptionally positive, with a projected continued high CAGR through 2033. The market's potential for substantial revenue generation and positive environmental impact further supports its sustained expansion.
Utility and Energy Analytics Market: A Comprehensive Report (2019-2033)
This insightful report provides a detailed analysis of the Utility and Energy Analytics Market, offering a comprehensive overview of market trends, key players, and future growth prospects. The study period covers 2019-2033, with 2025 as the base and estimated year. The report is invaluable for stakeholders seeking to understand the current market landscape and make informed strategic decisions. The market is projected to reach xx Million by 2033, exhibiting a robust Compound Annual Growth Rate (CAGR) of xx% during the forecast period (2025-2033).
Utility and Energy Analytics Market Market Composition & Trends
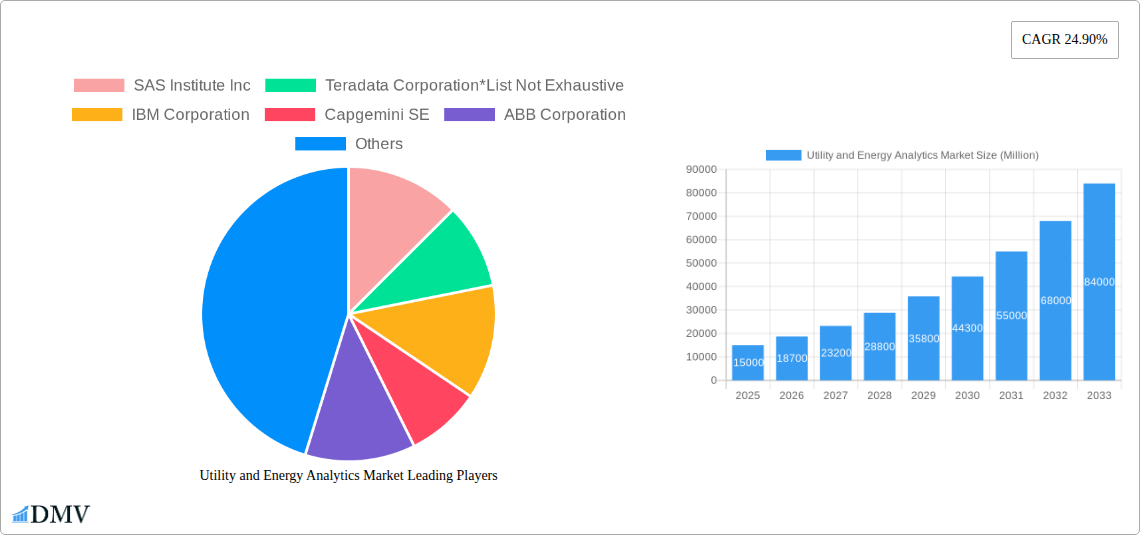
The Utility and Energy Analytics Market is characterized by a moderately concentrated landscape, with key players like SAS Institute Inc, Teradata Corporation, IBM Corporation, Capgemini SE, ABB Corporation, Siemens AG, Schneider Electric SE, Oracle Corporation, General Electric Company, and SAP SE holding significant market share. However, the market also features numerous smaller, specialized providers.
Market share distribution is dynamic, with the top 5 players accounting for approximately xx% of the total market revenue in 2024. Innovation is driven by advancements in AI, machine learning, and big data analytics, enabling more accurate forecasting and optimized grid management. Stringent environmental regulations and the increasing focus on sustainability are further accelerating market growth. Substitute products, while present, often lack the sophistication and comprehensive capabilities of dedicated utility analytics solutions. End-users are primarily utilities, energy providers, and related industries. M&A activity is prevalent, with deal values reaching xx Million in 2024, signifying consolidation and expansion within the sector. Key M&A activities include:
- Strategic acquisitions to expand product portfolios and geographic reach.
- Partnerships to leverage complementary technologies and expertise.
Utility and Energy Analytics Market Industry Evolution
The Utility and Energy Analytics Market has witnessed significant growth since 2019, driven by several factors. The increasing complexity of energy grids, coupled with the need for enhanced operational efficiency and improved renewable energy integration, has fueled demand for sophisticated analytics solutions. The historical period (2019-2024) saw a CAGR of xx%, while the estimated growth for 2025 is xx%. This growth is attributed to several technological advancements, such as the rise of cloud-based solutions, improved data visualization tools, and the integration of AI and machine learning algorithms. The adoption rate of these technologies varies across regions, with mature markets demonstrating higher penetration rates. Consumer demand is evolving, with a growing emphasis on sustainability, transparency, and personalized energy management solutions. These factors are shaping the future trajectory of the market, driving innovation and transforming industry practices. The market’s evolution is further shaped by:
- The growing adoption of smart meters and smart grid technologies.
- Increasing government investments in renewable energy infrastructure.
- The growing need for efficient energy management and grid optimization.
- The rising concerns about climate change and sustainability.
Leading Regions, Countries, or Segments in Utility and Energy Analytics Market
North America currently holds the dominant position in the Utility and Energy Analytics Market, driven by factors such as high investments in smart grid infrastructure, advanced regulatory frameworks, and the presence of major technology vendors. Europe follows closely, exhibiting strong growth momentum.
Key Drivers:
- High investment in smart grid modernization: Governments in North America and Europe are actively investing in upgrading their electricity grids, creating a substantial demand for analytics solutions.
- Stringent environmental regulations: Regulations aimed at reducing carbon emissions are driving the adoption of analytics for optimizing energy efficiency and integrating renewable energy sources.
- Technological advancements: The development of sophisticated analytics platforms and the adoption of cloud computing are fueling market growth.
Dominance Factors:
- High level of technology adoption: North America has seen a high level of adoption of advanced metering infrastructure (AMI) and smart grid technologies.
- Presence of major technology players: The region hosts several leading technology providers of utility and energy analytics solutions.
- Government support for R&D: The government and private sector are collaboratively fostering research and development in this sector.
Segment Analysis:
- By Type: The Software segment dominates due to its scalability and adaptability. The Services segment is experiencing significant growth due to the increasing demand for consulting and implementation expertise.
- By Application: Load forecasting and demand response are major application areas, closely followed by distribution planning and meter operation.
- By Deployment: Cloud deployment is gaining traction due to its cost-effectiveness and scalability. On-premise solutions still retain a substantial market share.
Utility and Energy Analytics Market Product Innovations
Recent innovations in the Utility and Energy Analytics Market include the incorporation of advanced machine learning algorithms for predictive maintenance, improved data visualization tools for enhanced decision-making, and the integration of blockchain technology for secure data management. These advancements are improving the accuracy, efficiency, and reliability of utility analytics solutions, enabling more effective grid management, demand forecasting, and resource allocation. Unique selling propositions include personalized energy management tools for consumers and real-time grid monitoring capabilities for utilities.
Propelling Factors for Utility and Energy Analytics Market Growth
Several factors are driving the growth of the Utility and Energy Analytics Market. Technological advancements, such as the development of AI-powered solutions and cloud-based platforms, are enhancing the capabilities of analytics tools. Economically, the need for cost optimization and improved efficiency within the energy sector is a major driving force. Regulatory pressures, including environmental regulations and the push for renewable energy integration, are further propelling the adoption of analytics solutions. For instance, government incentives for smart grid deployment are creating opportunities for growth in this market.
Obstacles in the Utility and Energy Analytics Market Market
Significant barriers hinder the Utility and Energy Analytics Market's growth. Regulatory hurdles, such as data privacy concerns and cybersecurity regulations, can slow down market expansion. Supply chain disruptions, especially regarding critical components for smart meters and other hardware, can impact deployment. Furthermore, intense competition among numerous established players and emerging startups creates a challenging environment for new entrants. These factors collectively have a noticeable impact on market growth, potentially resulting in a reduction of projected revenues by xx Million annually.
Future Opportunities in Utility and Energy Analytics Market
Emerging opportunities abound in the Utility and Energy Analytics Market. Expansion into developing economies with rapidly growing energy demands presents significant potential. The integration of advanced technologies like the Internet of Things (IoT) and edge computing will further enhance the capabilities of analytics platforms. The growing focus on consumer engagement and the development of personalized energy management tools offer lucrative avenues for market players.
Major Players in the Utility and Energy Analytics Market Ecosystem
- SAS Institute Inc
- Teradata Corporation
- IBM Corporation
- Capgemini SE
- ABB Corporation
- Siemens AG
- Schneider Electric SE
- Oracle Corporation
- General Electric Company
- SAP SE
Key Developments in Utility and Energy Analytics Market Industry
- August 2022: mCloud Technologies Corp. announced a technology continuation agreement with Agnity Global Inc., strengthening its AI-powered asset management solutions. This collaboration expands the market reach of mCloud's offerings.
- May 2022: Siemens launched its cloud-based PSS-E transmission grid simulation software, enhancing accessibility and scalability, indicating a shift towards cloud-based solutions in the industry.
Strategic Utility and Energy Analytics Market Market Forecast
The Utility and Energy Analytics Market is poised for substantial growth, driven by ongoing technological advancements, increasing regulatory pressure, and the rising need for efficient and sustainable energy management. The market's potential is vast, particularly in developing economies and with the continued integration of renewable energy sources. This growth trajectory indicates a strong outlook for both established players and new entrants seeking to capitalize on the market's expansion.
Utility and Energy Analytics Market Segmentation
-
1. Deployment
- 1.1. Cloud
- 1.2. On-premise
-
2. Type
- 2.1. Software
- 2.2. Services
-
3. Application
- 3.1. Meter Operation
- 3.2. Load Forecasting
- 3.3. Demand Response
- 3.4. Distribution Planning
- 3.5. Other Applications
Utility and Energy Analytics Market Segmentation By Geography
- 1. North America
- 2. Europe
- 3. Asia Pacific
- 4. Latin America
- 5. Middle East
Utility and Energy Analytics Market REPORT HIGHLIGHTS
| Aspects | Details |
|---|---|
| Study Period | 2019-2033 |
| Base Year | 2024 |
| Estimated Year | 2025 |
| Forecast Period | 2025-2033 |
| Historical Period | 2019-2024 |
| Growth Rate | CAGR of 24.90% from 2019-2033 |
| Segmentation |
|
Table of Contents
- 1. Introduction
- 1.1. Research Scope
- 1.2. Market Segmentation
- 1.3. Research Methodology
- 1.4. Definitions and Assumptions
- 2. Executive Summary
- 2.1. Introduction
- 3. Market Dynamics
- 3.1. Introduction
- 3.2. Market Drivers
- 3.2.1. Rising Demand for Energy and Increasing Emphasis on a Greener Environment; Growing Consumer Focus on Energy Consumption Pattern Analysis
- 3.3. Market Restrains
- 3.3.1. Slightly High Cost of Implementation of the Software
- 3.4. Market Trends
- 3.4.1. The cloud-based deployment model is expected to grow at a rapid pace.
- 4. Market Factor Analysis
- 4.1. Porters Five Forces
- 4.2. Supply/Value Chain
- 4.3. PESTEL analysis
- 4.4. Market Entropy
- 4.5. Patent/Trademark Analysis
- 5. Global Utility and Energy Analytics Market Analysis, Insights and Forecast, 2019-2031
- 5.1. Market Analysis, Insights and Forecast - by Deployment
- 5.1.1. Cloud
- 5.1.2. On-premise
- 5.2. Market Analysis, Insights and Forecast - by Type
- 5.2.1. Software
- 5.2.2. Services
- 5.3. Market Analysis, Insights and Forecast - by Application
- 5.3.1. Meter Operation
- 5.3.2. Load Forecasting
- 5.3.3. Demand Response
- 5.3.4. Distribution Planning
- 5.3.5. Other Applications
- 5.4. Market Analysis, Insights and Forecast - by Region
- 5.4.1. North America
- 5.4.2. Europe
- 5.4.3. Asia Pacific
- 5.4.4. Latin America
- 5.4.5. Middle East
- 5.1. Market Analysis, Insights and Forecast - by Deployment
- 6. North America Utility and Energy Analytics Market Analysis, Insights and Forecast, 2019-2031
- 6.1. Market Analysis, Insights and Forecast - by Deployment
- 6.1.1. Cloud
- 6.1.2. On-premise
- 6.2. Market Analysis, Insights and Forecast - by Type
- 6.2.1. Software
- 6.2.2. Services
- 6.3. Market Analysis, Insights and Forecast - by Application
- 6.3.1. Meter Operation
- 6.3.2. Load Forecasting
- 6.3.3. Demand Response
- 6.3.4. Distribution Planning
- 6.3.5. Other Applications
- 6.1. Market Analysis, Insights and Forecast - by Deployment
- 7. Europe Utility and Energy Analytics Market Analysis, Insights and Forecast, 2019-2031
- 7.1. Market Analysis, Insights and Forecast - by Deployment
- 7.1.1. Cloud
- 7.1.2. On-premise
- 7.2. Market Analysis, Insights and Forecast - by Type
- 7.2.1. Software
- 7.2.2. Services
- 7.3. Market Analysis, Insights and Forecast - by Application
- 7.3.1. Meter Operation
- 7.3.2. Load Forecasting
- 7.3.3. Demand Response
- 7.3.4. Distribution Planning
- 7.3.5. Other Applications
- 7.1. Market Analysis, Insights and Forecast - by Deployment
- 8. Asia Pacific Utility and Energy Analytics Market Analysis, Insights and Forecast, 2019-2031
- 8.1. Market Analysis, Insights and Forecast - by Deployment
- 8.1.1. Cloud
- 8.1.2. On-premise
- 8.2. Market Analysis, Insights and Forecast - by Type
- 8.2.1. Software
- 8.2.2. Services
- 8.3. Market Analysis, Insights and Forecast - by Application
- 8.3.1. Meter Operation
- 8.3.2. Load Forecasting
- 8.3.3. Demand Response
- 8.3.4. Distribution Planning
- 8.3.5. Other Applications
- 8.1. Market Analysis, Insights and Forecast - by Deployment
- 9. Latin America Utility and Energy Analytics Market Analysis, Insights and Forecast, 2019-2031
- 9.1. Market Analysis, Insights and Forecast - by Deployment
- 9.1.1. Cloud
- 9.1.2. On-premise
- 9.2. Market Analysis, Insights and Forecast - by Type
- 9.2.1. Software
- 9.2.2. Services
- 9.3. Market Analysis, Insights and Forecast - by Application
- 9.3.1. Meter Operation
- 9.3.2. Load Forecasting
- 9.3.3. Demand Response
- 9.3.4. Distribution Planning
- 9.3.5. Other Applications
- 9.1. Market Analysis, Insights and Forecast - by Deployment
- 10. Middle East Utility and Energy Analytics Market Analysis, Insights and Forecast, 2019-2031
- 10.1. Market Analysis, Insights and Forecast - by Deployment
- 10.1.1. Cloud
- 10.1.2. On-premise
- 10.2. Market Analysis, Insights and Forecast - by Type
- 10.2.1. Software
- 10.2.2. Services
- 10.3. Market Analysis, Insights and Forecast - by Application
- 10.3.1. Meter Operation
- 10.3.2. Load Forecasting
- 10.3.3. Demand Response
- 10.3.4. Distribution Planning
- 10.3.5. Other Applications
- 10.1. Market Analysis, Insights and Forecast - by Deployment
- 11. North America Utility and Energy Analytics Market Analysis, Insights and Forecast, 2019-2031
- 11.1. Market Analysis, Insights and Forecast - By Country/Sub-region
- 11.1.1.
- 12. Europe Utility and Energy Analytics Market Analysis, Insights and Forecast, 2019-2031
- 12.1. Market Analysis, Insights and Forecast - By Country/Sub-region
- 12.1.1.
- 13. Asia Pacific Utility and Energy Analytics Market Analysis, Insights and Forecast, 2019-2031
- 13.1. Market Analysis, Insights and Forecast - By Country/Sub-region
- 13.1.1.
- 14. Latin America Utility and Energy Analytics Market Analysis, Insights and Forecast, 2019-2031
- 14.1. Market Analysis, Insights and Forecast - By Country/Sub-region
- 14.1.1.
- 15. Middle East Utility and Energy Analytics Market Analysis, Insights and Forecast, 2019-2031
- 15.1. Market Analysis, Insights and Forecast - By Country/Sub-region
- 15.1.1.
- 16. Competitive Analysis
- 16.1. Global Market Share Analysis 2024
- 16.2. Company Profiles
- 16.2.1 SAS Institute Inc
- 16.2.1.1. Overview
- 16.2.1.2. Products
- 16.2.1.3. SWOT Analysis
- 16.2.1.4. Recent Developments
- 16.2.1.5. Financials (Based on Availability)
- 16.2.2 Teradata Corporation*List Not Exhaustive
- 16.2.2.1. Overview
- 16.2.2.2. Products
- 16.2.2.3. SWOT Analysis
- 16.2.2.4. Recent Developments
- 16.2.2.5. Financials (Based on Availability)
- 16.2.3 IBM Corporation
- 16.2.3.1. Overview
- 16.2.3.2. Products
- 16.2.3.3. SWOT Analysis
- 16.2.3.4. Recent Developments
- 16.2.3.5. Financials (Based on Availability)
- 16.2.4 Capgemini SE
- 16.2.4.1. Overview
- 16.2.4.2. Products
- 16.2.4.3. SWOT Analysis
- 16.2.4.4. Recent Developments
- 16.2.4.5. Financials (Based on Availability)
- 16.2.5 ABB Corporation
- 16.2.5.1. Overview
- 16.2.5.2. Products
- 16.2.5.3. SWOT Analysis
- 16.2.5.4. Recent Developments
- 16.2.5.5. Financials (Based on Availability)
- 16.2.6 Siemens AG
- 16.2.6.1. Overview
- 16.2.6.2. Products
- 16.2.6.3. SWOT Analysis
- 16.2.6.4. Recent Developments
- 16.2.6.5. Financials (Based on Availability)
- 16.2.7 Schneider Electric SE
- 16.2.7.1. Overview
- 16.2.7.2. Products
- 16.2.7.3. SWOT Analysis
- 16.2.7.4. Recent Developments
- 16.2.7.5. Financials (Based on Availability)
- 16.2.8 Oracle Corporation
- 16.2.8.1. Overview
- 16.2.8.2. Products
- 16.2.8.3. SWOT Analysis
- 16.2.8.4. Recent Developments
- 16.2.8.5. Financials (Based on Availability)
- 16.2.9 General Electric Company
- 16.2.9.1. Overview
- 16.2.9.2. Products
- 16.2.9.3. SWOT Analysis
- 16.2.9.4. Recent Developments
- 16.2.9.5. Financials (Based on Availability)
- 16.2.10 SAP SE
- 16.2.10.1. Overview
- 16.2.10.2. Products
- 16.2.10.3. SWOT Analysis
- 16.2.10.4. Recent Developments
- 16.2.10.5. Financials (Based on Availability)
- 16.2.1 SAS Institute Inc
List of Figures
- Figure 1: Global Utility and Energy Analytics Market Revenue Breakdown (Million, %) by Region 2024 & 2032
- Figure 2: North America Utility and Energy Analytics Market Revenue (Million), by Country 2024 & 2032
- Figure 3: North America Utility and Energy Analytics Market Revenue Share (%), by Country 2024 & 2032
- Figure 4: Europe Utility and Energy Analytics Market Revenue (Million), by Country 2024 & 2032
- Figure 5: Europe Utility and Energy Analytics Market Revenue Share (%), by Country 2024 & 2032
- Figure 6: Asia Pacific Utility and Energy Analytics Market Revenue (Million), by Country 2024 & 2032
- Figure 7: Asia Pacific Utility and Energy Analytics Market Revenue Share (%), by Country 2024 & 2032
- Figure 8: Latin America Utility and Energy Analytics Market Revenue (Million), by Country 2024 & 2032
- Figure 9: Latin America Utility and Energy Analytics Market Revenue Share (%), by Country 2024 & 2032
- Figure 10: Middle East Utility and Energy Analytics Market Revenue (Million), by Country 2024 & 2032
- Figure 11: Middle East Utility and Energy Analytics Market Revenue Share (%), by Country 2024 & 2032
- Figure 12: North America Utility and Energy Analytics Market Revenue (Million), by Deployment 2024 & 2032
- Figure 13: North America Utility and Energy Analytics Market Revenue Share (%), by Deployment 2024 & 2032
- Figure 14: North America Utility and Energy Analytics Market Revenue (Million), by Type 2024 & 2032
- Figure 15: North America Utility and Energy Analytics Market Revenue Share (%), by Type 2024 & 2032
- Figure 16: North America Utility and Energy Analytics Market Revenue (Million), by Application 2024 & 2032
- Figure 17: North America Utility and Energy Analytics Market Revenue Share (%), by Application 2024 & 2032
- Figure 18: North America Utility and Energy Analytics Market Revenue (Million), by Country 2024 & 2032
- Figure 19: North America Utility and Energy Analytics Market Revenue Share (%), by Country 2024 & 2032
- Figure 20: Europe Utility and Energy Analytics Market Revenue (Million), by Deployment 2024 & 2032
- Figure 21: Europe Utility and Energy Analytics Market Revenue Share (%), by Deployment 2024 & 2032
- Figure 22: Europe Utility and Energy Analytics Market Revenue (Million), by Type 2024 & 2032
- Figure 23: Europe Utility and Energy Analytics Market Revenue Share (%), by Type 2024 & 2032
- Figure 24: Europe Utility and Energy Analytics Market Revenue (Million), by Application 2024 & 2032
- Figure 25: Europe Utility and Energy Analytics Market Revenue Share (%), by Application 2024 & 2032
- Figure 26: Europe Utility and Energy Analytics Market Revenue (Million), by Country 2024 & 2032
- Figure 27: Europe Utility and Energy Analytics Market Revenue Share (%), by Country 2024 & 2032
- Figure 28: Asia Pacific Utility and Energy Analytics Market Revenue (Million), by Deployment 2024 & 2032
- Figure 29: Asia Pacific Utility and Energy Analytics Market Revenue Share (%), by Deployment 2024 & 2032
- Figure 30: Asia Pacific Utility and Energy Analytics Market Revenue (Million), by Type 2024 & 2032
- Figure 31: Asia Pacific Utility and Energy Analytics Market Revenue Share (%), by Type 2024 & 2032
- Figure 32: Asia Pacific Utility and Energy Analytics Market Revenue (Million), by Application 2024 & 2032
- Figure 33: Asia Pacific Utility and Energy Analytics Market Revenue Share (%), by Application 2024 & 2032
- Figure 34: Asia Pacific Utility and Energy Analytics Market Revenue (Million), by Country 2024 & 2032
- Figure 35: Asia Pacific Utility and Energy Analytics Market Revenue Share (%), by Country 2024 & 2032
- Figure 36: Latin America Utility and Energy Analytics Market Revenue (Million), by Deployment 2024 & 2032
- Figure 37: Latin America Utility and Energy Analytics Market Revenue Share (%), by Deployment 2024 & 2032
- Figure 38: Latin America Utility and Energy Analytics Market Revenue (Million), by Type 2024 & 2032
- Figure 39: Latin America Utility and Energy Analytics Market Revenue Share (%), by Type 2024 & 2032
- Figure 40: Latin America Utility and Energy Analytics Market Revenue (Million), by Application 2024 & 2032
- Figure 41: Latin America Utility and Energy Analytics Market Revenue Share (%), by Application 2024 & 2032
- Figure 42: Latin America Utility and Energy Analytics Market Revenue (Million), by Country 2024 & 2032
- Figure 43: Latin America Utility and Energy Analytics Market Revenue Share (%), by Country 2024 & 2032
- Figure 44: Middle East Utility and Energy Analytics Market Revenue (Million), by Deployment 2024 & 2032
- Figure 45: Middle East Utility and Energy Analytics Market Revenue Share (%), by Deployment 2024 & 2032
- Figure 46: Middle East Utility and Energy Analytics Market Revenue (Million), by Type 2024 & 2032
- Figure 47: Middle East Utility and Energy Analytics Market Revenue Share (%), by Type 2024 & 2032
- Figure 48: Middle East Utility and Energy Analytics Market Revenue (Million), by Application 2024 & 2032
- Figure 49: Middle East Utility and Energy Analytics Market Revenue Share (%), by Application 2024 & 2032
- Figure 50: Middle East Utility and Energy Analytics Market Revenue (Million), by Country 2024 & 2032
- Figure 51: Middle East Utility and Energy Analytics Market Revenue Share (%), by Country 2024 & 2032
List of Tables
- Table 1: Global Utility and Energy Analytics Market Revenue Million Forecast, by Region 2019 & 2032
- Table 2: Global Utility and Energy Analytics Market Revenue Million Forecast, by Deployment 2019 & 2032
- Table 3: Global Utility and Energy Analytics Market Revenue Million Forecast, by Type 2019 & 2032
- Table 4: Global Utility and Energy Analytics Market Revenue Million Forecast, by Application 2019 & 2032
- Table 5: Global Utility and Energy Analytics Market Revenue Million Forecast, by Region 2019 & 2032
- Table 6: Global Utility and Energy Analytics Market Revenue Million Forecast, by Country 2019 & 2032
- Table 7: Utility and Energy Analytics Market Revenue (Million) Forecast, by Application 2019 & 2032
- Table 8: Global Utility and Energy Analytics Market Revenue Million Forecast, by Country 2019 & 2032
- Table 9: Utility and Energy Analytics Market Revenue (Million) Forecast, by Application 2019 & 2032
- Table 10: Global Utility and Energy Analytics Market Revenue Million Forecast, by Country 2019 & 2032
- Table 11: Utility and Energy Analytics Market Revenue (Million) Forecast, by Application 2019 & 2032
- Table 12: Global Utility and Energy Analytics Market Revenue Million Forecast, by Country 2019 & 2032
- Table 13: Utility and Energy Analytics Market Revenue (Million) Forecast, by Application 2019 & 2032
- Table 14: Global Utility and Energy Analytics Market Revenue Million Forecast, by Country 2019 & 2032
- Table 15: Utility and Energy Analytics Market Revenue (Million) Forecast, by Application 2019 & 2032
- Table 16: Global Utility and Energy Analytics Market Revenue Million Forecast, by Deployment 2019 & 2032
- Table 17: Global Utility and Energy Analytics Market Revenue Million Forecast, by Type 2019 & 2032
- Table 18: Global Utility and Energy Analytics Market Revenue Million Forecast, by Application 2019 & 2032
- Table 19: Global Utility and Energy Analytics Market Revenue Million Forecast, by Country 2019 & 2032
- Table 20: Global Utility and Energy Analytics Market Revenue Million Forecast, by Deployment 2019 & 2032
- Table 21: Global Utility and Energy Analytics Market Revenue Million Forecast, by Type 2019 & 2032
- Table 22: Global Utility and Energy Analytics Market Revenue Million Forecast, by Application 2019 & 2032
- Table 23: Global Utility and Energy Analytics Market Revenue Million Forecast, by Country 2019 & 2032
- Table 24: Global Utility and Energy Analytics Market Revenue Million Forecast, by Deployment 2019 & 2032
- Table 25: Global Utility and Energy Analytics Market Revenue Million Forecast, by Type 2019 & 2032
- Table 26: Global Utility and Energy Analytics Market Revenue Million Forecast, by Application 2019 & 2032
- Table 27: Global Utility and Energy Analytics Market Revenue Million Forecast, by Country 2019 & 2032
- Table 28: Global Utility and Energy Analytics Market Revenue Million Forecast, by Deployment 2019 & 2032
- Table 29: Global Utility and Energy Analytics Market Revenue Million Forecast, by Type 2019 & 2032
- Table 30: Global Utility and Energy Analytics Market Revenue Million Forecast, by Application 2019 & 2032
- Table 31: Global Utility and Energy Analytics Market Revenue Million Forecast, by Country 2019 & 2032
- Table 32: Global Utility and Energy Analytics Market Revenue Million Forecast, by Deployment 2019 & 2032
- Table 33: Global Utility and Energy Analytics Market Revenue Million Forecast, by Type 2019 & 2032
- Table 34: Global Utility and Energy Analytics Market Revenue Million Forecast, by Application 2019 & 2032
- Table 35: Global Utility and Energy Analytics Market Revenue Million Forecast, by Country 2019 & 2032
Frequently Asked Questions
1. What is the projected Compound Annual Growth Rate (CAGR) of the Utility and Energy Analytics Market?
The projected CAGR is approximately 24.90%.
2. Which companies are prominent players in the Utility and Energy Analytics Market?
Key companies in the market include SAS Institute Inc, Teradata Corporation*List Not Exhaustive, IBM Corporation, Capgemini SE, ABB Corporation, Siemens AG, Schneider Electric SE, Oracle Corporation, General Electric Company, SAP SE.
3. What are the main segments of the Utility and Energy Analytics Market?
The market segments include Deployment, Type, Application.
4. Can you provide details about the market size?
The market size is estimated to be USD XX Million as of 2022.
5. What are some drivers contributing to market growth?
Rising Demand for Energy and Increasing Emphasis on a Greener Environment; Growing Consumer Focus on Energy Consumption Pattern Analysis.
6. What are the notable trends driving market growth?
The cloud-based deployment model is expected to grow at a rapid pace..
7. Are there any restraints impacting market growth?
Slightly High Cost of Implementation of the Software.
8. Can you provide examples of recent developments in the market?
August 2022 - mCloud Technologies Corp., a leading provider of AI-powered asset management and Environmental, Social, and Governance ("ESG") solutions, announced that it has entered into a technology continuation agreement with Agnity Global Inc., enabling mCloud to build on the success of its existing relationship with Agnity.
9. What pricing options are available for accessing the report?
Pricing options include single-user, multi-user, and enterprise licenses priced at USD 4750, USD 5250, and USD 8750 respectively.
10. Is the market size provided in terms of value or volume?
The market size is provided in terms of value, measured in Million.
11. Are there any specific market keywords associated with the report?
Yes, the market keyword associated with the report is "Utility and Energy Analytics Market," which aids in identifying and referencing the specific market segment covered.
12. How do I determine which pricing option suits my needs best?
The pricing options vary based on user requirements and access needs. Individual users may opt for single-user licenses, while businesses requiring broader access may choose multi-user or enterprise licenses for cost-effective access to the report.
13. Are there any additional resources or data provided in the Utility and Energy Analytics Market report?
While the report offers comprehensive insights, it's advisable to review the specific contents or supplementary materials provided to ascertain if additional resources or data are available.
14. How can I stay updated on further developments or reports in the Utility and Energy Analytics Market?
To stay informed about further developments, trends, and reports in the Utility and Energy Analytics Market, consider subscribing to industry newsletters, following relevant companies and organizations, or regularly checking reputable industry news sources and publications.
Methodology
Step 1 - Identification of Relevant Samples Size from Population Database


Step 2 - Approaches for Defining Global Market Size (Value, Volume* & Price*)

Note*: In applicable scenarios
Step 3 - Data Sources
Primary Research
- Web Analytics
- Survey Reports
- Research Institute
- Latest Research Reports
- Opinion Leaders
Secondary Research
- Annual Reports
- White Paper
- Latest Press Release
- Industry Association
- Paid Database
- Investor Presentations

Step 4 - Data Triangulation
Involves using different sources of information in order to increase the validity of a study
These sources are likely to be stakeholders in a program - participants, other researchers, program staff, other community members, and so on.
Then we put all data in single framework & apply various statistical tools to find out the dynamic on the market.
During the analysis stage, feedback from the stakeholder groups would be compared to determine areas of agreement as well as areas of divergence
