

Key Insights
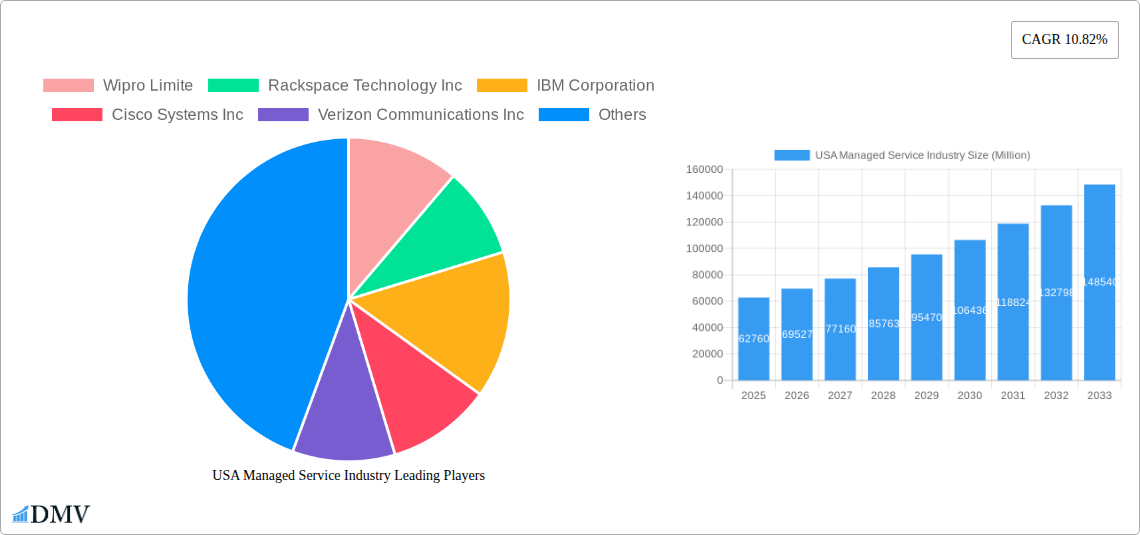
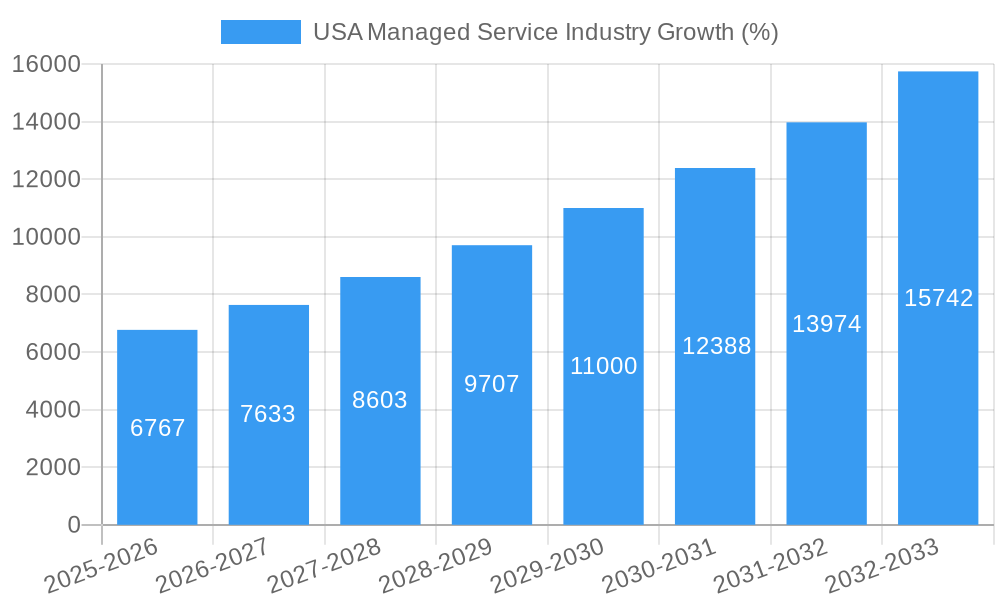
The US managed services market, a significant segment of the broader IT landscape, is experiencing robust growth, projected to reach $62.76 billion in 2025 and maintain a Compound Annual Growth Rate (CAGR) of 10.82% from 2025 to 2033. This expansion is fueled by several key drivers. The increasing adoption of cloud computing necessitates robust managed services for security, infrastructure, and application management. Furthermore, the growing complexity of IT environments, especially within large enterprises and across diverse verticals like BFSI (Banking, Financial Services, and Insurance), healthcare, and IT & Telecom, necessitates outsourcing non-core IT functions to specialized managed service providers (MSPs). This allows organizations to focus on their core competencies while benefiting from the expertise and economies of scale offered by MSPs. The trend towards digital transformation and the increasing reliance on mobile technologies further amplify the demand for comprehensive managed mobility and communication services. While potential restraints such as cybersecurity threats and the need for continuous skills development exist, the overall market outlook remains positive, driven by strong customer adoption and technological advancements.
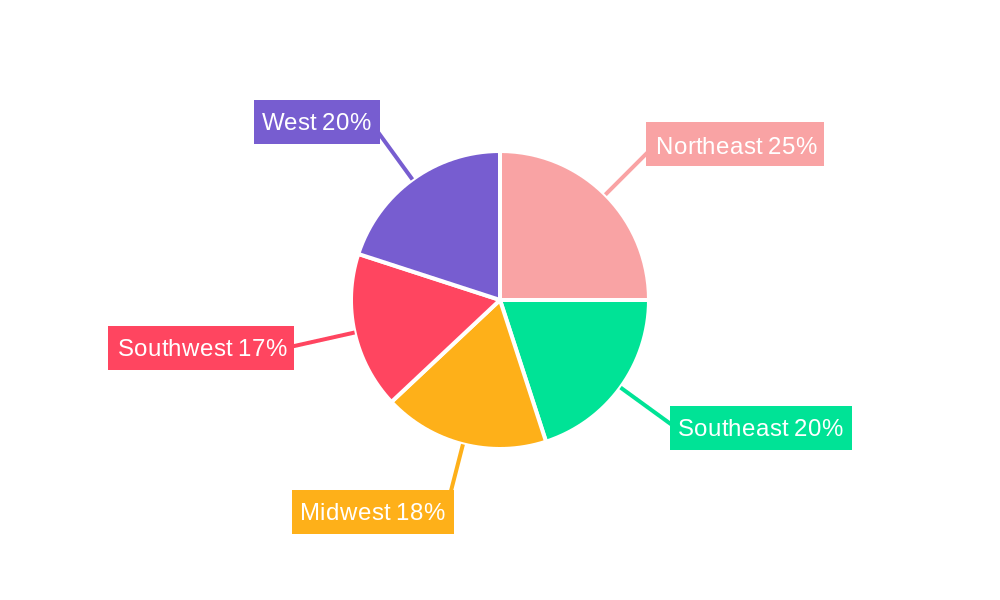
The market segmentation reveals significant opportunities across different deployment models (on-premise and cloud), service types (managed data centers, security, communications, networks, infrastructure, and mobility), enterprise sizes (SMEs and large enterprises), and end-user verticals. The US market is geographically diverse, with regional variations in adoption rates likely reflecting differences in digital maturity and IT infrastructure development across the Northeast, Southeast, Midwest, Southwest, and West regions. Major players such as Wipro, Rackspace, IBM, Cisco, Verizon, Microsoft, HP, Fujitsu, TCS, Dell, AT&T, and Citrix are actively competing, shaping the market through innovation and strategic acquisitions. The continued focus on enhancing security, improving service delivery models (e.g., AI-powered automation), and expanding service portfolios will be crucial for success in this dynamic and rapidly evolving market.
USA Managed Service Industry Market Report: 2019-2033
This comprehensive report provides a detailed analysis of the USA Managed Service Industry, encompassing market size, segmentation, key players, growth drivers, challenges, and future opportunities. The study period covers 2019-2033, with 2025 as the base and estimated year. The market is projected to reach xx Million by 2033, showcasing significant growth potential.
USA Managed Service Industry Market Composition & Trends
This section delves into the competitive landscape of the US Managed Services market, examining market concentration, innovation drivers, regulatory influences, substitute products, end-user behavior, and mergers and acquisitions (M&A) activity. The report analyzes the market share distribution among key players like Wipro Limited, Rackspace Technology Inc., IBM Corporation, Cisco Systems Inc., Verizon Communications Inc., Microsoft Corporation, HP Inc., Fujitsu Limited, Tata Consultancy Services Limited, Dell Technologies Inc., AT&T Inc., and Citrix Systems Inc.. It explores the impact of M&A activities, with an estimated total deal value of xx Million during the historical period (2019-2024), and assesses their influence on market concentration and competitive dynamics. The analysis considers the impact of regulatory changes on market access and pricing strategies and identifies substitute products and services that could impact market growth. Finally, the report profiles end-users across various sectors, providing insights into their specific needs and preferences.
- Market Concentration: Analysis of market share held by top 10 players.
- Innovation Catalysts: Examination of R&D investments and technological advancements driving market innovation.
- Regulatory Landscape: Impact of government regulations and compliance requirements.
- Substitute Products: Analysis of alternative solutions and their potential impact on market growth.
- End-User Profiles: Detailed segmentation of end-users by industry and enterprise size.
- M&A Activity: Review of significant M&A transactions, including deal values and strategic implications.
USA Managed Service Industry Industry Evolution
This section charts the evolutionary path of the USA Managed Services market from 2019 to 2033, analyzing market growth trajectories, technological advancements, and evolving consumer demands. The report details the significant shift towards cloud-based managed services, driven by factors such as scalability, cost-efficiency, and enhanced security. It also examines the adoption rates of various managed service types, including managed security, managed network, and managed infrastructure, and quantifies the impact of these shifts on market growth. The projected Compound Annual Growth Rate (CAGR) for the forecast period (2025-2033) is estimated at xx%, reflecting a strong growth trajectory driven by increasing digital transformation initiatives across diverse sectors. Technological advancements, such as AI and automation, are analyzed for their role in shaping service offerings and improving operational efficiency. The report also investigates the influence of evolving consumer preferences, including demand for customized and integrated solutions, on market development. Finally, it assesses the long-term market outlook and potential future growth opportunities.
Leading Regions, Countries, or Segments in USA Managed Service Industry
This section identifies the leading segments within the USA Managed Service industry, analyzing dominant regions, countries, and service types. The report examines the market performance across different deployment models (on-premise vs. cloud), service types (managed data center, managed security, etc.), enterprise sizes (SMEs vs. large enterprises), and end-user verticals (BFSI, IT and Telecom, Healthcare, etc.). The analysis highlights the factors driving the dominance of specific segments, considering investment trends, regulatory support, and market maturity.
- By Deployment: Cloud-based services are expected to dominate, driven by scalability and cost-effectiveness.
- By Type: Managed security services are experiencing rapid growth, fueled by increasing cyber threats.
- By Enterprise Size: Large enterprises represent a significant portion of the market due to their higher IT budgets.
- By End-user Vertical: BFSI and IT and Telecom are key segments, driven by their high reliance on IT infrastructure.
The dominance of specific segments is driven by a confluence of factors. For instance, the strong growth of cloud-based deployments is fueled by cost optimization, enhanced scalability, and accessibility of advanced features. Similarly, the robust growth in the managed security segment can be attributed to the heightened focus on cybersecurity measures and the rise in sophisticated cyber threats. The preference for large enterprises in the overall market share reflects their greater IT spending capacity and advanced technological adoption.
USA Managed Service Industry Product Innovations
The USA Managed Service Industry is characterized by continuous innovation in products and services. Recent advancements include AI-powered automation for improved efficiency, integrated security solutions offering comprehensive protection, and customized service packages tailored to specific client needs. These innovations enhance operational efficiency, strengthen security postures, and improve overall client experience, resulting in enhanced value propositions and greater market competitiveness. Key performance indicators (KPIs) such as reduced downtime, improved security compliance, and enhanced operational efficiency are used to evaluate the effectiveness of these new offerings.
Propelling Factors for USA Managed Service Industry Growth
Several key factors are driving the growth of the USA Managed Service Industry. Firstly, the increasing adoption of cloud technologies is fueling demand for managed cloud services. Secondly, the rising complexity of IT infrastructures is leading organizations to outsource management responsibilities to specialized providers. Thirdly, stringent data security regulations are driving the adoption of managed security services. Finally, the growing need for cost optimization and enhanced operational efficiency is further bolstering market growth. These factors collectively contribute to a robust and expanding market for managed services in the USA.
Obstacles in the USA Managed Service Industry Market
Despite significant growth potential, the USA Managed Service Industry faces certain challenges. These include intense competition among numerous providers, potential supply chain disruptions affecting service delivery, and the complexity of navigating evolving regulatory landscapes. These factors can impact service pricing, availability, and overall market stability. The fluctuating economic conditions also add another layer of uncertainty and can affect clients’ willingness to invest in managed services.
Future Opportunities in USA Managed Service Industry
The USA Managed Service Industry presents significant future opportunities. The expanding adoption of 5G networks, the growth of edge computing, and the increasing adoption of AI and IoT technologies are all creating new avenues for growth. Additionally, the continued digital transformation across various sectors presents a substantial opportunity for service providers to offer specialized and integrated solutions. These factors suggest a promising outlook for the market, with continued expansion and diversification of service offerings.
Major Players in the USA Managed Service Industry Ecosystem
- Wipro Limited
- Rackspace Technology Inc.
- IBM Corporation
- Cisco Systems Inc.
- Verizon Communications Inc.
- Microsoft Corporation
- HP Inc.
- Fujitsu Limited
- Tata Consultancy Services Limited
- Dell Technologies Inc.
- AT&T Inc.
- Citrix Systems Inc.
Key Developments in USA Managed Service Industry Industry
October 2023: Rackspace Technology launched Rackspace Managed Cloud (RMC), a comprehensive cloud management service. This launch significantly expands Rackspace's service portfolio and strengthens its position in the market.
August 2023: Verizon Business partnered with HCLTech for Managed Network Services (MNS), enhancing its global enterprise networking capabilities. This strategic alliance positions Verizon to better serve large-scale enterprise customers needing comprehensive networking solutions.
Strategic USA Managed Service Industry Market Forecast
The USA Managed Service Industry is poised for continued strong growth, driven by ongoing digital transformation initiatives, the increasing adoption of cloud technologies, and the rising demand for managed security solutions. The market's future potential is significant, with opportunities for innovation, expansion into new segments, and enhanced service offerings. The forecast period promises further market consolidation and increased competition, demanding strategic agility and continuous innovation from market participants.
USA Managed Service Industry Segmentation
-
1. Deployment
- 1.1. On-premise
- 1.2. Cloud
-
2. Type
- 2.1. Managed Data Center
- 2.2. Managed Security
- 2.3. Managed Communications
- 2.4. Managed Network
- 2.5. Managed Infrastructure
- 2.6. Managed Mobility
-
3. Enterprise Size
- 3.1. Small and Medium Enterprises
- 3.2. Large Enterprises
-
4. End-user Vertical
- 4.1. BFSI
- 4.2. IT and Telecom
- 4.3. Healthcare
- 4.4. Entertainment and Media
- 4.5. Retail
- 4.6. Manufacturing
- 4.7. Government
- 4.8. Other End-user Verticals
USA Managed Service Industry Segmentation By Geography
-
1. North America
- 1.1. United States
- 1.2. Canada
- 1.3. Mexico
-
2. South America
- 2.1. Brazil
- 2.2. Argentina
- 2.3. Rest of South America
-
3. Europe
- 3.1. United Kingdom
- 3.2. Germany
- 3.3. France
- 3.4. Italy
- 3.5. Spain
- 3.6. Russia
- 3.7. Benelux
- 3.8. Nordics
- 3.9. Rest of Europe
-
4. Middle East & Africa
- 4.1. Turkey
- 4.2. Israel
- 4.3. GCC
- 4.4. North Africa
- 4.5. South Africa
- 4.6. Rest of Middle East & Africa
-
5. Asia Pacific
- 5.1. China
- 5.2. India
- 5.3. Japan
- 5.4. South Korea
- 5.5. ASEAN
- 5.6. Oceania
- 5.7. Rest of Asia Pacific
USA Managed Service Industry REPORT HIGHLIGHTS
| Aspects | Details |
|---|---|
| Study Period | 2019-2033 |
| Base Year | 2024 |
| Estimated Year | 2025 |
| Forecast Period | 2025-2033 |
| Historical Period | 2019-2024 |
| Growth Rate | CAGR of 10.82% from 2019-2033 |
| Segmentation |
|
Table of Contents
- 1. Introduction
- 1.1. Research Scope
- 1.2. Market Segmentation
- 1.3. Research Methodology
- 1.4. Definitions and Assumptions
- 2. Executive Summary
- 2.1. Introduction
- 3. Market Dynamics
- 3.1. Introduction
- 3.2. Market Drivers
- 3.2.1. Increasing Shift to Hybrid IT; Improved Cost and Operational Efficiency
- 3.3. Market Restrains
- 3.3.1 High Risk of Radiation Since it uses Gamma Rays
- 3.3.2 X-Rays; High Deployment Costs
- 3.4. Market Trends
- 3.4.1. Cloud to Witness Significant Growth
- 4. Market Factor Analysis
- 4.1. Porters Five Forces
- 4.2. Supply/Value Chain
- 4.3. PESTEL analysis
- 4.4. Market Entropy
- 4.5. Patent/Trademark Analysis
- 5. Global USA Managed Service Industry Analysis, Insights and Forecast, 2019-2031
- 5.1. Market Analysis, Insights and Forecast - by Deployment
- 5.1.1. On-premise
- 5.1.2. Cloud
- 5.2. Market Analysis, Insights and Forecast - by Type
- 5.2.1. Managed Data Center
- 5.2.2. Managed Security
- 5.2.3. Managed Communications
- 5.2.4. Managed Network
- 5.2.5. Managed Infrastructure
- 5.2.6. Managed Mobility
- 5.3. Market Analysis, Insights and Forecast - by Enterprise Size
- 5.3.1. Small and Medium Enterprises
- 5.3.2. Large Enterprises
- 5.4. Market Analysis, Insights and Forecast - by End-user Vertical
- 5.4.1. BFSI
- 5.4.2. IT and Telecom
- 5.4.3. Healthcare
- 5.4.4. Entertainment and Media
- 5.4.5. Retail
- 5.4.6. Manufacturing
- 5.4.7. Government
- 5.4.8. Other End-user Verticals
- 5.5. Market Analysis, Insights and Forecast - by Region
- 5.5.1. North America
- 5.5.2. South America
- 5.5.3. Europe
- 5.5.4. Middle East & Africa
- 5.5.5. Asia Pacific
- 5.1. Market Analysis, Insights and Forecast - by Deployment
- 6. North America USA Managed Service Industry Analysis, Insights and Forecast, 2019-2031
- 6.1. Market Analysis, Insights and Forecast - by Deployment
- 6.1.1. On-premise
- 6.1.2. Cloud
- 6.2. Market Analysis, Insights and Forecast - by Type
- 6.2.1. Managed Data Center
- 6.2.2. Managed Security
- 6.2.3. Managed Communications
- 6.2.4. Managed Network
- 6.2.5. Managed Infrastructure
- 6.2.6. Managed Mobility
- 6.3. Market Analysis, Insights and Forecast - by Enterprise Size
- 6.3.1. Small and Medium Enterprises
- 6.3.2. Large Enterprises
- 6.4. Market Analysis, Insights and Forecast - by End-user Vertical
- 6.4.1. BFSI
- 6.4.2. IT and Telecom
- 6.4.3. Healthcare
- 6.4.4. Entertainment and Media
- 6.4.5. Retail
- 6.4.6. Manufacturing
- 6.4.7. Government
- 6.4.8. Other End-user Verticals
- 6.1. Market Analysis, Insights and Forecast - by Deployment
- 7. South America USA Managed Service Industry Analysis, Insights and Forecast, 2019-2031
- 7.1. Market Analysis, Insights and Forecast - by Deployment
- 7.1.1. On-premise
- 7.1.2. Cloud
- 7.2. Market Analysis, Insights and Forecast - by Type
- 7.2.1. Managed Data Center
- 7.2.2. Managed Security
- 7.2.3. Managed Communications
- 7.2.4. Managed Network
- 7.2.5. Managed Infrastructure
- 7.2.6. Managed Mobility
- 7.3. Market Analysis, Insights and Forecast - by Enterprise Size
- 7.3.1. Small and Medium Enterprises
- 7.3.2. Large Enterprises
- 7.4. Market Analysis, Insights and Forecast - by End-user Vertical
- 7.4.1. BFSI
- 7.4.2. IT and Telecom
- 7.4.3. Healthcare
- 7.4.4. Entertainment and Media
- 7.4.5. Retail
- 7.4.6. Manufacturing
- 7.4.7. Government
- 7.4.8. Other End-user Verticals
- 7.1. Market Analysis, Insights and Forecast - by Deployment
- 8. Europe USA Managed Service Industry Analysis, Insights and Forecast, 2019-2031
- 8.1. Market Analysis, Insights and Forecast - by Deployment
- 8.1.1. On-premise
- 8.1.2. Cloud
- 8.2. Market Analysis, Insights and Forecast - by Type
- 8.2.1. Managed Data Center
- 8.2.2. Managed Security
- 8.2.3. Managed Communications
- 8.2.4. Managed Network
- 8.2.5. Managed Infrastructure
- 8.2.6. Managed Mobility
- 8.3. Market Analysis, Insights and Forecast - by Enterprise Size
- 8.3.1. Small and Medium Enterprises
- 8.3.2. Large Enterprises
- 8.4. Market Analysis, Insights and Forecast - by End-user Vertical
- 8.4.1. BFSI
- 8.4.2. IT and Telecom
- 8.4.3. Healthcare
- 8.4.4. Entertainment and Media
- 8.4.5. Retail
- 8.4.6. Manufacturing
- 8.4.7. Government
- 8.4.8. Other End-user Verticals
- 8.1. Market Analysis, Insights and Forecast - by Deployment
- 9. Middle East & Africa USA Managed Service Industry Analysis, Insights and Forecast, 2019-2031
- 9.1. Market Analysis, Insights and Forecast - by Deployment
- 9.1.1. On-premise
- 9.1.2. Cloud
- 9.2. Market Analysis, Insights and Forecast - by Type
- 9.2.1. Managed Data Center
- 9.2.2. Managed Security
- 9.2.3. Managed Communications
- 9.2.4. Managed Network
- 9.2.5. Managed Infrastructure
- 9.2.6. Managed Mobility
- 9.3. Market Analysis, Insights and Forecast - by Enterprise Size
- 9.3.1. Small and Medium Enterprises
- 9.3.2. Large Enterprises
- 9.4. Market Analysis, Insights and Forecast - by End-user Vertical
- 9.4.1. BFSI
- 9.4.2. IT and Telecom
- 9.4.3. Healthcare
- 9.4.4. Entertainment and Media
- 9.4.5. Retail
- 9.4.6. Manufacturing
- 9.4.7. Government
- 9.4.8. Other End-user Verticals
- 9.1. Market Analysis, Insights and Forecast - by Deployment
- 10. Asia Pacific USA Managed Service Industry Analysis, Insights and Forecast, 2019-2031
- 10.1. Market Analysis, Insights and Forecast - by Deployment
- 10.1.1. On-premise
- 10.1.2. Cloud
- 10.2. Market Analysis, Insights and Forecast - by Type
- 10.2.1. Managed Data Center
- 10.2.2. Managed Security
- 10.2.3. Managed Communications
- 10.2.4. Managed Network
- 10.2.5. Managed Infrastructure
- 10.2.6. Managed Mobility
- 10.3. Market Analysis, Insights and Forecast - by Enterprise Size
- 10.3.1. Small and Medium Enterprises
- 10.3.2. Large Enterprises
- 10.4. Market Analysis, Insights and Forecast - by End-user Vertical
- 10.4.1. BFSI
- 10.4.2. IT and Telecom
- 10.4.3. Healthcare
- 10.4.4. Entertainment and Media
- 10.4.5. Retail
- 10.4.6. Manufacturing
- 10.4.7. Government
- 10.4.8. Other End-user Verticals
- 10.1. Market Analysis, Insights and Forecast - by Deployment
- 11. Northeast USA Managed Service Industry Analysis, Insights and Forecast, 2019-2031
- 12. Southeast USA Managed Service Industry Analysis, Insights and Forecast, 2019-2031
- 13. Midwest USA Managed Service Industry Analysis, Insights and Forecast, 2019-2031
- 14. Southwest USA Managed Service Industry Analysis, Insights and Forecast, 2019-2031
- 15. West USA Managed Service Industry Analysis, Insights and Forecast, 2019-2031
- 16. Competitive Analysis
- 16.1. Global Market Share Analysis 2024
- 16.2. Company Profiles
- 16.2.1 Wipro Limite
- 16.2.1.1. Overview
- 16.2.1.2. Products
- 16.2.1.3. SWOT Analysis
- 16.2.1.4. Recent Developments
- 16.2.1.5. Financials (Based on Availability)
- 16.2.2 Rackspace Technology Inc
- 16.2.2.1. Overview
- 16.2.2.2. Products
- 16.2.2.3. SWOT Analysis
- 16.2.2.4. Recent Developments
- 16.2.2.5. Financials (Based on Availability)
- 16.2.3 IBM Corporation
- 16.2.3.1. Overview
- 16.2.3.2. Products
- 16.2.3.3. SWOT Analysis
- 16.2.3.4. Recent Developments
- 16.2.3.5. Financials (Based on Availability)
- 16.2.4 Cisco Systems Inc
- 16.2.4.1. Overview
- 16.2.4.2. Products
- 16.2.4.3. SWOT Analysis
- 16.2.4.4. Recent Developments
- 16.2.4.5. Financials (Based on Availability)
- 16.2.5 Verizon Communications Inc
- 16.2.5.1. Overview
- 16.2.5.2. Products
- 16.2.5.3. SWOT Analysis
- 16.2.5.4. Recent Developments
- 16.2.5.5. Financials (Based on Availability)
- 16.2.6 Microsoft Corporation
- 16.2.6.1. Overview
- 16.2.6.2. Products
- 16.2.6.3. SWOT Analysis
- 16.2.6.4. Recent Developments
- 16.2.6.5. Financials (Based on Availability)
- 16.2.7 HP Inc
- 16.2.7.1. Overview
- 16.2.7.2. Products
- 16.2.7.3. SWOT Analysis
- 16.2.7.4. Recent Developments
- 16.2.7.5. Financials (Based on Availability)
- 16.2.8 Fujitsu Limited
- 16.2.8.1. Overview
- 16.2.8.2. Products
- 16.2.8.3. SWOT Analysis
- 16.2.8.4. Recent Developments
- 16.2.8.5. Financials (Based on Availability)
- 16.2.9 Tata Consultancy Services Limited
- 16.2.9.1. Overview
- 16.2.9.2. Products
- 16.2.9.3. SWOT Analysis
- 16.2.9.4. Recent Developments
- 16.2.9.5. Financials (Based on Availability)
- 16.2.10 Dell Technologies Inc
- 16.2.10.1. Overview
- 16.2.10.2. Products
- 16.2.10.3. SWOT Analysis
- 16.2.10.4. Recent Developments
- 16.2.10.5. Financials (Based on Availability)
- 16.2.11 AT&T Inc
- 16.2.11.1. Overview
- 16.2.11.2. Products
- 16.2.11.3. SWOT Analysis
- 16.2.11.4. Recent Developments
- 16.2.11.5. Financials (Based on Availability)
- 16.2.12 Citrix Systems Inc
- 16.2.12.1. Overview
- 16.2.12.2. Products
- 16.2.12.3. SWOT Analysis
- 16.2.12.4. Recent Developments
- 16.2.12.5. Financials (Based on Availability)
- 16.2.1 Wipro Limite
List of Figures
- Figure 1: Global USA Managed Service Industry Revenue Breakdown (Million, %) by Region 2024 & 2032
- Figure 2: United states USA Managed Service Industry Revenue (Million), by Country 2024 & 2032
- Figure 3: United states USA Managed Service Industry Revenue Share (%), by Country 2024 & 2032
- Figure 4: North America USA Managed Service Industry Revenue (Million), by Deployment 2024 & 2032
- Figure 5: North America USA Managed Service Industry Revenue Share (%), by Deployment 2024 & 2032
- Figure 6: North America USA Managed Service Industry Revenue (Million), by Type 2024 & 2032
- Figure 7: North America USA Managed Service Industry Revenue Share (%), by Type 2024 & 2032
- Figure 8: North America USA Managed Service Industry Revenue (Million), by Enterprise Size 2024 & 2032
- Figure 9: North America USA Managed Service Industry Revenue Share (%), by Enterprise Size 2024 & 2032
- Figure 10: North America USA Managed Service Industry Revenue (Million), by End-user Vertical 2024 & 2032
- Figure 11: North America USA Managed Service Industry Revenue Share (%), by End-user Vertical 2024 & 2032
- Figure 12: North America USA Managed Service Industry Revenue (Million), by Country 2024 & 2032
- Figure 13: North America USA Managed Service Industry Revenue Share (%), by Country 2024 & 2032
- Figure 14: South America USA Managed Service Industry Revenue (Million), by Deployment 2024 & 2032
- Figure 15: South America USA Managed Service Industry Revenue Share (%), by Deployment 2024 & 2032
- Figure 16: South America USA Managed Service Industry Revenue (Million), by Type 2024 & 2032
- Figure 17: South America USA Managed Service Industry Revenue Share (%), by Type 2024 & 2032
- Figure 18: South America USA Managed Service Industry Revenue (Million), by Enterprise Size 2024 & 2032
- Figure 19: South America USA Managed Service Industry Revenue Share (%), by Enterprise Size 2024 & 2032
- Figure 20: South America USA Managed Service Industry Revenue (Million), by End-user Vertical 2024 & 2032
- Figure 21: South America USA Managed Service Industry Revenue Share (%), by End-user Vertical 2024 & 2032
- Figure 22: South America USA Managed Service Industry Revenue (Million), by Country 2024 & 2032
- Figure 23: South America USA Managed Service Industry Revenue Share (%), by Country 2024 & 2032
- Figure 24: Europe USA Managed Service Industry Revenue (Million), by Deployment 2024 & 2032
- Figure 25: Europe USA Managed Service Industry Revenue Share (%), by Deployment 2024 & 2032
- Figure 26: Europe USA Managed Service Industry Revenue (Million), by Type 2024 & 2032
- Figure 27: Europe USA Managed Service Industry Revenue Share (%), by Type 2024 & 2032
- Figure 28: Europe USA Managed Service Industry Revenue (Million), by Enterprise Size 2024 & 2032
- Figure 29: Europe USA Managed Service Industry Revenue Share (%), by Enterprise Size 2024 & 2032
- Figure 30: Europe USA Managed Service Industry Revenue (Million), by End-user Vertical 2024 & 2032
- Figure 31: Europe USA Managed Service Industry Revenue Share (%), by End-user Vertical 2024 & 2032
- Figure 32: Europe USA Managed Service Industry Revenue (Million), by Country 2024 & 2032
- Figure 33: Europe USA Managed Service Industry Revenue Share (%), by Country 2024 & 2032
- Figure 34: Middle East & Africa USA Managed Service Industry Revenue (Million), by Deployment 2024 & 2032
- Figure 35: Middle East & Africa USA Managed Service Industry Revenue Share (%), by Deployment 2024 & 2032
- Figure 36: Middle East & Africa USA Managed Service Industry Revenue (Million), by Type 2024 & 2032
- Figure 37: Middle East & Africa USA Managed Service Industry Revenue Share (%), by Type 2024 & 2032
- Figure 38: Middle East & Africa USA Managed Service Industry Revenue (Million), by Enterprise Size 2024 & 2032
- Figure 39: Middle East & Africa USA Managed Service Industry Revenue Share (%), by Enterprise Size 2024 & 2032
- Figure 40: Middle East & Africa USA Managed Service Industry Revenue (Million), by End-user Vertical 2024 & 2032
- Figure 41: Middle East & Africa USA Managed Service Industry Revenue Share (%), by End-user Vertical 2024 & 2032
- Figure 42: Middle East & Africa USA Managed Service Industry Revenue (Million), by Country 2024 & 2032
- Figure 43: Middle East & Africa USA Managed Service Industry Revenue Share (%), by Country 2024 & 2032
- Figure 44: Asia Pacific USA Managed Service Industry Revenue (Million), by Deployment 2024 & 2032
- Figure 45: Asia Pacific USA Managed Service Industry Revenue Share (%), by Deployment 2024 & 2032
- Figure 46: Asia Pacific USA Managed Service Industry Revenue (Million), by Type 2024 & 2032
- Figure 47: Asia Pacific USA Managed Service Industry Revenue Share (%), by Type 2024 & 2032
- Figure 48: Asia Pacific USA Managed Service Industry Revenue (Million), by Enterprise Size 2024 & 2032
- Figure 49: Asia Pacific USA Managed Service Industry Revenue Share (%), by Enterprise Size 2024 & 2032
- Figure 50: Asia Pacific USA Managed Service Industry Revenue (Million), by End-user Vertical 2024 & 2032
- Figure 51: Asia Pacific USA Managed Service Industry Revenue Share (%), by End-user Vertical 2024 & 2032
- Figure 52: Asia Pacific USA Managed Service Industry Revenue (Million), by Country 2024 & 2032
- Figure 53: Asia Pacific USA Managed Service Industry Revenue Share (%), by Country 2024 & 2032
List of Tables
- Table 1: Global USA Managed Service Industry Revenue Million Forecast, by Region 2019 & 2032
- Table 2: Global USA Managed Service Industry Revenue Million Forecast, by Deployment 2019 & 2032
- Table 3: Global USA Managed Service Industry Revenue Million Forecast, by Type 2019 & 2032
- Table 4: Global USA Managed Service Industry Revenue Million Forecast, by Enterprise Size 2019 & 2032
- Table 5: Global USA Managed Service Industry Revenue Million Forecast, by End-user Vertical 2019 & 2032
- Table 6: Global USA Managed Service Industry Revenue Million Forecast, by Region 2019 & 2032
- Table 7: Global USA Managed Service Industry Revenue Million Forecast, by Country 2019 & 2032
- Table 8: Northeast USA Managed Service Industry Revenue (Million) Forecast, by Application 2019 & 2032
- Table 9: Southeast USA Managed Service Industry Revenue (Million) Forecast, by Application 2019 & 2032
- Table 10: Midwest USA Managed Service Industry Revenue (Million) Forecast, by Application 2019 & 2032
- Table 11: Southwest USA Managed Service Industry Revenue (Million) Forecast, by Application 2019 & 2032
- Table 12: West USA Managed Service Industry Revenue (Million) Forecast, by Application 2019 & 2032
- Table 13: Global USA Managed Service Industry Revenue Million Forecast, by Deployment 2019 & 2032
- Table 14: Global USA Managed Service Industry Revenue Million Forecast, by Type 2019 & 2032
- Table 15: Global USA Managed Service Industry Revenue Million Forecast, by Enterprise Size 2019 & 2032
- Table 16: Global USA Managed Service Industry Revenue Million Forecast, by End-user Vertical 2019 & 2032
- Table 17: Global USA Managed Service Industry Revenue Million Forecast, by Country 2019 & 2032
- Table 18: United States USA Managed Service Industry Revenue (Million) Forecast, by Application 2019 & 2032
- Table 19: Canada USA Managed Service Industry Revenue (Million) Forecast, by Application 2019 & 2032
- Table 20: Mexico USA Managed Service Industry Revenue (Million) Forecast, by Application 2019 & 2032
- Table 21: Global USA Managed Service Industry Revenue Million Forecast, by Deployment 2019 & 2032
- Table 22: Global USA Managed Service Industry Revenue Million Forecast, by Type 2019 & 2032
- Table 23: Global USA Managed Service Industry Revenue Million Forecast, by Enterprise Size 2019 & 2032
- Table 24: Global USA Managed Service Industry Revenue Million Forecast, by End-user Vertical 2019 & 2032
- Table 25: Global USA Managed Service Industry Revenue Million Forecast, by Country 2019 & 2032
- Table 26: Brazil USA Managed Service Industry Revenue (Million) Forecast, by Application 2019 & 2032
- Table 27: Argentina USA Managed Service Industry Revenue (Million) Forecast, by Application 2019 & 2032
- Table 28: Rest of South America USA Managed Service Industry Revenue (Million) Forecast, by Application 2019 & 2032
- Table 29: Global USA Managed Service Industry Revenue Million Forecast, by Deployment 2019 & 2032
- Table 30: Global USA Managed Service Industry Revenue Million Forecast, by Type 2019 & 2032
- Table 31: Global USA Managed Service Industry Revenue Million Forecast, by Enterprise Size 2019 & 2032
- Table 32: Global USA Managed Service Industry Revenue Million Forecast, by End-user Vertical 2019 & 2032
- Table 33: Global USA Managed Service Industry Revenue Million Forecast, by Country 2019 & 2032
- Table 34: United Kingdom USA Managed Service Industry Revenue (Million) Forecast, by Application 2019 & 2032
- Table 35: Germany USA Managed Service Industry Revenue (Million) Forecast, by Application 2019 & 2032
- Table 36: France USA Managed Service Industry Revenue (Million) Forecast, by Application 2019 & 2032
- Table 37: Italy USA Managed Service Industry Revenue (Million) Forecast, by Application 2019 & 2032
- Table 38: Spain USA Managed Service Industry Revenue (Million) Forecast, by Application 2019 & 2032
- Table 39: Russia USA Managed Service Industry Revenue (Million) Forecast, by Application 2019 & 2032
- Table 40: Benelux USA Managed Service Industry Revenue (Million) Forecast, by Application 2019 & 2032
- Table 41: Nordics USA Managed Service Industry Revenue (Million) Forecast, by Application 2019 & 2032
- Table 42: Rest of Europe USA Managed Service Industry Revenue (Million) Forecast, by Application 2019 & 2032
- Table 43: Global USA Managed Service Industry Revenue Million Forecast, by Deployment 2019 & 2032
- Table 44: Global USA Managed Service Industry Revenue Million Forecast, by Type 2019 & 2032
- Table 45: Global USA Managed Service Industry Revenue Million Forecast, by Enterprise Size 2019 & 2032
- Table 46: Global USA Managed Service Industry Revenue Million Forecast, by End-user Vertical 2019 & 2032
- Table 47: Global USA Managed Service Industry Revenue Million Forecast, by Country 2019 & 2032
- Table 48: Turkey USA Managed Service Industry Revenue (Million) Forecast, by Application 2019 & 2032
- Table 49: Israel USA Managed Service Industry Revenue (Million) Forecast, by Application 2019 & 2032
- Table 50: GCC USA Managed Service Industry Revenue (Million) Forecast, by Application 2019 & 2032
- Table 51: North Africa USA Managed Service Industry Revenue (Million) Forecast, by Application 2019 & 2032
- Table 52: South Africa USA Managed Service Industry Revenue (Million) Forecast, by Application 2019 & 2032
- Table 53: Rest of Middle East & Africa USA Managed Service Industry Revenue (Million) Forecast, by Application 2019 & 2032
- Table 54: Global USA Managed Service Industry Revenue Million Forecast, by Deployment 2019 & 2032
- Table 55: Global USA Managed Service Industry Revenue Million Forecast, by Type 2019 & 2032
- Table 56: Global USA Managed Service Industry Revenue Million Forecast, by Enterprise Size 2019 & 2032
- Table 57: Global USA Managed Service Industry Revenue Million Forecast, by End-user Vertical 2019 & 2032
- Table 58: Global USA Managed Service Industry Revenue Million Forecast, by Country 2019 & 2032
- Table 59: China USA Managed Service Industry Revenue (Million) Forecast, by Application 2019 & 2032
- Table 60: India USA Managed Service Industry Revenue (Million) Forecast, by Application 2019 & 2032
- Table 61: Japan USA Managed Service Industry Revenue (Million) Forecast, by Application 2019 & 2032
- Table 62: South Korea USA Managed Service Industry Revenue (Million) Forecast, by Application 2019 & 2032
- Table 63: ASEAN USA Managed Service Industry Revenue (Million) Forecast, by Application 2019 & 2032
- Table 64: Oceania USA Managed Service Industry Revenue (Million) Forecast, by Application 2019 & 2032
- Table 65: Rest of Asia Pacific USA Managed Service Industry Revenue (Million) Forecast, by Application 2019 & 2032
Frequently Asked Questions
1. What is the projected Compound Annual Growth Rate (CAGR) of the USA Managed Service Industry?
The projected CAGR is approximately 10.82%.
2. Which companies are prominent players in the USA Managed Service Industry?
Key companies in the market include Wipro Limite, Rackspace Technology Inc, IBM Corporation, Cisco Systems Inc, Verizon Communications Inc, Microsoft Corporation, HP Inc, Fujitsu Limited, Tata Consultancy Services Limited, Dell Technologies Inc, AT&T Inc, Citrix Systems Inc.
3. What are the main segments of the USA Managed Service Industry?
The market segments include Deployment, Type, Enterprise Size, End-user Vertical.
4. Can you provide details about the market size?
The market size is estimated to be USD 62.76 Million as of 2022.
5. What are some drivers contributing to market growth?
Increasing Shift to Hybrid IT; Improved Cost and Operational Efficiency.
6. What are the notable trends driving market growth?
Cloud to Witness Significant Growth.
7. Are there any restraints impacting market growth?
High Risk of Radiation Since it uses Gamma Rays. X-Rays; High Deployment Costs.
8. Can you provide examples of recent developments in the market?
October 2023 - Rackspace Technology introduced Rackspace Managed Cloud (RMC), an all-inclusive service enabling customers to delegate their cloud environments' management and operations. This comprehensive solution is tailored for organizations utilizing platforms such as AWS, Azure, Google Cloud, Rackspace Private Cloud, and on-premises infrastructure.
9. What pricing options are available for accessing the report?
Pricing options include single-user, multi-user, and enterprise licenses priced at USD 3800, USD 4500, and USD 5800 respectively.
10. Is the market size provided in terms of value or volume?
The market size is provided in terms of value, measured in Million.
11. Are there any specific market keywords associated with the report?
Yes, the market keyword associated with the report is "USA Managed Service Industry," which aids in identifying and referencing the specific market segment covered.
12. How do I determine which pricing option suits my needs best?
The pricing options vary based on user requirements and access needs. Individual users may opt for single-user licenses, while businesses requiring broader access may choose multi-user or enterprise licenses for cost-effective access to the report.
13. Are there any additional resources or data provided in the USA Managed Service Industry report?
While the report offers comprehensive insights, it's advisable to review the specific contents or supplementary materials provided to ascertain if additional resources or data are available.
14. How can I stay updated on further developments or reports in the USA Managed Service Industry?
To stay informed about further developments, trends, and reports in the USA Managed Service Industry, consider subscribing to industry newsletters, following relevant companies and organizations, or regularly checking reputable industry news sources and publications.
Methodology
Step 1 - Identification of Relevant Samples Size from Population Database


Step 2 - Approaches for Defining Global Market Size (Value, Volume* & Price*)

Note*: In applicable scenarios
Step 3 - Data Sources
Primary Research
- Web Analytics
- Survey Reports
- Research Institute
- Latest Research Reports
- Opinion Leaders
Secondary Research
- Annual Reports
- White Paper
- Latest Press Release
- Industry Association
- Paid Database
- Investor Presentations

Step 4 - Data Triangulation
Involves using different sources of information in order to increase the validity of a study
These sources are likely to be stakeholders in a program - participants, other researchers, program staff, other community members, and so on.
Then we put all data in single framework & apply various statistical tools to find out the dynamic on the market.
During the analysis stage, feedback from the stakeholder groups would be compared to determine areas of agreement as well as areas of divergence
