

Key Insights
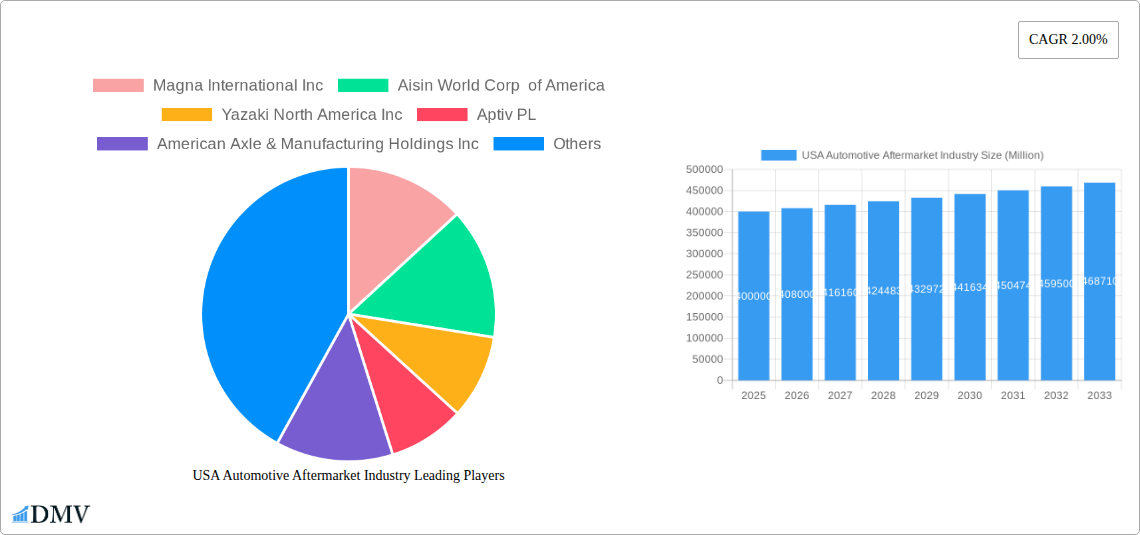
The US automotive aftermarket industry, valued at approximately $400 billion in 2025, is projected to experience steady growth, with a compound annual growth rate (CAGR) of 2.00% from 2025 to 2033. This growth is fueled by several key factors. The aging vehicle population in the US necessitates increased repair and maintenance, driving demand for replacement parts and services. Technological advancements in vehicle systems, including advanced driver-assistance systems (ADAS) and electric vehicles (EVs), are also contributing to market expansion, albeit with some complexities. While the shift towards EVs initially presents challenges for traditional aftermarket businesses focused on internal combustion engine (ICE) components, it simultaneously creates new opportunities in specialized EV parts and charging infrastructure. Further growth is driven by a rising consumer preference for vehicle customization and personalization, expanding the market for aftermarket accessories and styling components. The increasing adoption of online sales channels also facilitates convenient access to parts and services, boosting market reach.
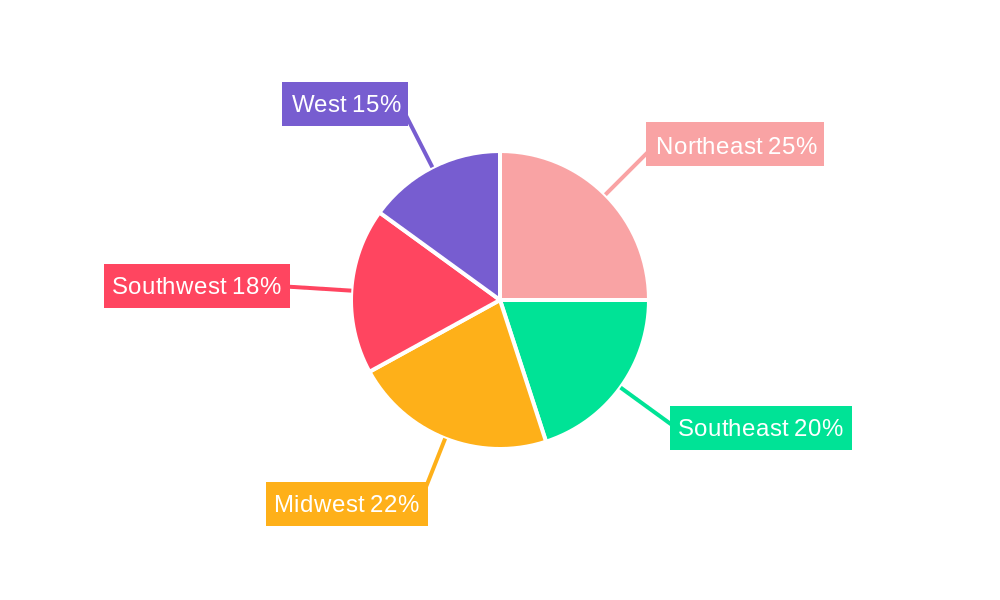
However, economic fluctuations and supply chain disruptions pose significant restraints on market growth. Fluctuations in fuel prices and consumer spending directly impact demand for vehicle maintenance and repairs. Supply chain bottlenecks can lead to delays in parts delivery and increased costs, impacting profitability. Furthermore, the increasing complexity of modern vehicles may necessitate specialized tools and expertise, potentially limiting the participation of smaller repair shops. The industry is segmented by vehicle type (passenger cars and commercial vehicles), application (engine components, transmission, interior, exterior, and other applications), and sales channel (online and offline). Major players such as Magna International, Aisin, Yazaki, Aptiv, and Bosch are actively competing to capture market share, focusing on innovation and strategic partnerships to address the evolving market landscape and leverage technological advancements to gain a competitive edge. Regional variations exist across the United States, with higher concentrations of automotive businesses and demand in densely populated areas like the Northeast and West.
USA Automotive Aftermarket Industry: A Comprehensive Market Report (2019-2033)
This insightful report provides a detailed analysis of the USA automotive aftermarket industry, offering a comprehensive overview of market trends, key players, and future growth prospects. Covering the period from 2019 to 2033, with 2025 as the base year, this report is an essential resource for stakeholders seeking to understand and capitalize on opportunities within this dynamic sector. The market is projected to reach xx Million by 2033.
USA Automotive Aftermarket Industry Market Composition & Trends
This section delves into the intricate landscape of the US automotive aftermarket, analyzing market concentration, innovation drivers, regulatory frameworks, substitute products, end-user profiles, and the impact of mergers and acquisitions (M&A). The market is characterized by a moderately concentrated structure, with a few dominant players holding significant market share. The report examines the distribution of this market share amongst key players, along with a detailed analysis of the value and impact of recent M&A deals. Innovation is driven by technological advancements in areas such as electric vehicles (EVs) and autonomous driving, demanding new aftermarket components and services. Stringent emission regulations and safety standards significantly influence industry dynamics, pushing for the adoption of greener and safer technologies. Competition from substitute products, including used parts and repair services, adds another layer of complexity. Finally, the report provides a detailed profile of the diverse end-user segments, including individual vehicle owners, commercial fleets, and repair shops.
- Market Concentration: High concentration in certain segments (e.g., xx% held by top 5 players in engine components).
- Innovation Catalysts: Advancements in EVs, autonomous driving, and connected car technologies.
- Regulatory Landscape: Stringent emission and safety regulations driving innovation and consolidation.
- Substitute Products: Growing competition from used parts and third-party repair services.
- End-User Profiles: Analysis of individual vehicle owners, commercial fleets, and repair shops.
- M&A Activities: Review of significant mergers and acquisitions with estimated deal values (e.g., xx Million for Cummins acquisition of Meritor).
USA Automotive Aftermarket Industry Industry Evolution
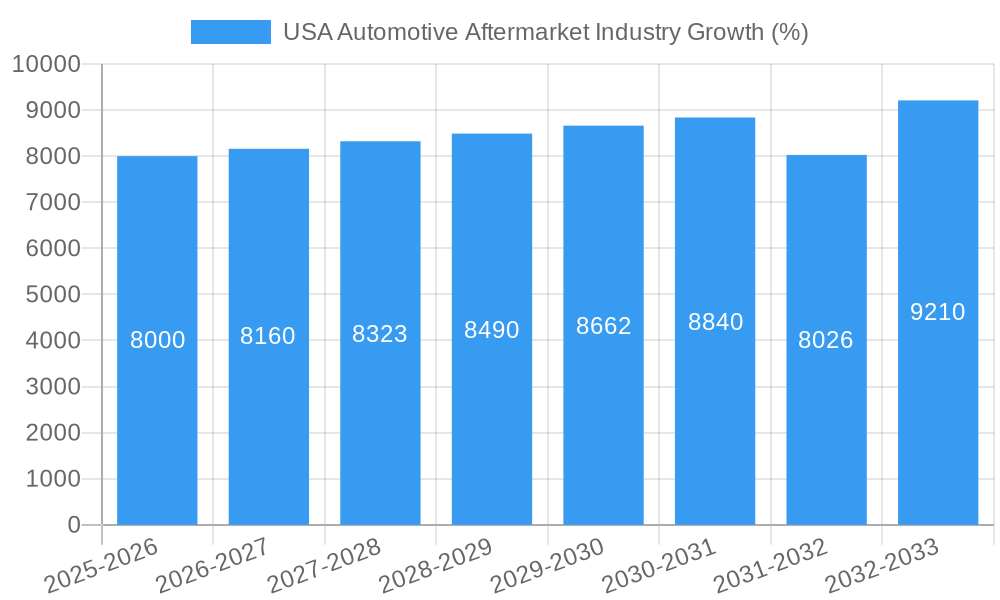
This section provides a detailed examination of the automotive aftermarket's evolutionary trajectory, focusing on market growth rates, technological advancements, and evolving consumer preferences. We analyze the historical period (2019-2024), the estimated year (2025), and forecast the market's growth from 2025 to 2033. The market shows steady growth, driven by factors such as the increasing age of the vehicle fleet and the growing demand for vehicle maintenance and repairs. Technological advancements, such as the increased adoption of advanced driver-assistance systems (ADAS) and the growth of the electric vehicle market, are reshaping the aftermarket landscape, creating opportunities for new products and services. The shift in consumer preferences towards digital channels for parts purchasing and service scheduling is another key trend. We provide quantifiable data on growth rates and adoption metrics for key technological advancements, shedding light on how these dynamics will shape the future of the industry. Growth is expected to be driven by factors such as the rising number of vehicles on the road, increasing average vehicle age, and rising consumer spending on vehicle maintenance and repairs.
Leading Regions, Countries, or Segments in USA Automotive Aftermarket Industry
This section identifies the dominant regions, countries, and segments within the US automotive aftermarket. We analyze key drivers for dominance across different vehicle types (passenger cars and commercial vehicles), applications (engine components, transmission, interior, exterior, and other applications), and sales channels (online and offline).
Key Drivers (Bullet Points):
- Passenger Cars: High vehicle ownership, aging vehicle fleet, and increasing demand for maintenance and repairs.
- Commercial Vehicles: Large fleet sizes, stringent regulations, and need for uptime maximization.
- Engine Components: High replacement rates due to wear and tear and technological advancements.
- Transmission: High repair costs and increasing complexity of modern transmissions.
- Interior: Growing demand for comfort and convenience features.
- Exterior: High demand for aesthetic upgrades and collision repair.
- Online Sales Channel: Convenience, price comparison, and wider product selection.
- Offline Sales Channel: Personalization, immediate availability, and expert advice.
Dominance Factors (Paragraphs): [Detailed analysis of the factors contributing to the dominance of specific regions, countries, or segments will be provided here, incorporating data on investment trends, regulatory support, and market size.]
USA Automotive Aftermarket Industry Product Innovations
The US automotive aftermarket is witnessing a wave of product innovations, driven by the need for enhanced vehicle performance, safety, and fuel efficiency. New materials, advanced manufacturing techniques, and smart technologies are leading to lighter, stronger, and more durable components. These innovations are enhancing the capabilities and functionalities of vehicles, extending their lifespan, and improving overall driving experience. Key innovations include advanced sensors for ADAS, improved battery technologies for EVs, and more efficient fuel systems. These products offer unique selling propositions such as increased durability, improved fuel economy, and enhanced safety features, making them highly attractive to consumers and businesses alike.
Propelling Factors for USA Automotive Aftermarket Industry Growth
Several factors are propelling the growth of the US automotive aftermarket. Technological advancements are generating demand for new products and services. The rising disposable income and increased vehicle ownership are boosting consumer spending on vehicle maintenance and repairs. Government regulations focusing on vehicle safety and emission standards are creating opportunities for aftermarket parts and services that meet these requirements. The growth of the online retail market is offering new avenues for distribution and sales.
Obstacles in the USA Automotive Aftermarket Industry Market
The US automotive aftermarket faces several obstacles. Stricter regulatory compliance requirements can increase costs and complexity for businesses. Supply chain disruptions can lead to delays and shortages of parts, impacting production and sales. Intense competition from established players and new entrants creates pressure on pricing and profitability. These challenges need to be addressed strategically to ensure sustainable growth. The overall impact of these restraints is estimated to reduce the market growth by xx% in the forecast period.
Future Opportunities in USA Automotive Aftermarket Industry
The future holds exciting opportunities for the US automotive aftermarket. The growing adoption of EVs and autonomous vehicles is creating demand for specialized parts and services. The increasing penetration of connected car technology is opening up new possibilities for remote diagnostics and predictive maintenance. Expansion into emerging markets and developing innovative business models can further drive growth.
Major Players in the USA Automotive Aftermarket Industry Ecosystem
- Magna International Inc
- Aisin World Corp of America
- Yazaki North America Inc
- Aptiv PL
- American Axle & Manufacturing Holdings Inc
- Panasonic Automotive Systems Company of America
- Continental AG
- Flex-N-Gate Corporation
- Robert Bosch GmbH
- Lear Corporation
- Faurecia
- DENSO Corporation
- Adient PLC
- ZF Friedrichshafen AG
Key Developments in USA Automotive Aftermarket Industry Industry
December 2022: BorgWarner Inc. announced plans to spin off its Fuel Systems and Aftermarket businesses, creating "NewCo" focused on GDI and hydrogen injection systems, aiming to reach 25% EV revenue by 2025. This signals a significant shift towards electrification in the aftermarket.
August 2022: Cummins Inc. completed its acquisition of Meritor, Inc., strengthening its position in integrated powertrain solutions for both combustion and electric vehicles. This merger significantly impacts the commercial vehicle aftermarket.
June 2022: Meritor, Inc. launched the ProTec Independent Front Suspension (IFS) for motorcoaches, expanding its product portfolio and solidifying its position in the specialty vehicle market.
Strategic USA Automotive Aftermarket Industry Market Forecast
The US automotive aftermarket is poised for continued growth, driven by technological advancements, increasing vehicle age, and rising consumer spending. Opportunities lie in the electrification of vehicles, the growth of the connected car market, and the increasing adoption of ADAS. The market is expected to witness significant innovation in areas such as battery technology, electric powertrains, and autonomous driving systems, creating a robust demand for related aftermarket products and services. This will lead to a significant market expansion in the coming years.
USA Automotive Aftermarket Industry Segmentation
-
1. Vehicle Type
- 1.1. Passenger Cars
- 1.2. Commercial Vehicles
-
2. Application
- 2.1. Engine Components
- 2.2. Transmission
- 2.3. Interior
- 2.4. Exterior
- 2.5. Other Applications
-
3. Sales Channel
- 3.1. Online
- 3.2. Offline
USA Automotive Aftermarket Industry Segmentation By Geography
-
1. North America
- 1.1. United States
- 1.2. Canada
- 1.3. Mexico
-
2. South America
- 2.1. Brazil
- 2.2. Argentina
- 2.3. Rest of South America
-
3. Europe
- 3.1. United Kingdom
- 3.2. Germany
- 3.3. France
- 3.4. Italy
- 3.5. Spain
- 3.6. Russia
- 3.7. Benelux
- 3.8. Nordics
- 3.9. Rest of Europe
-
4. Middle East & Africa
- 4.1. Turkey
- 4.2. Israel
- 4.3. GCC
- 4.4. North Africa
- 4.5. South Africa
- 4.6. Rest of Middle East & Africa
-
5. Asia Pacific
- 5.1. China
- 5.2. India
- 5.3. Japan
- 5.4. South Korea
- 5.5. ASEAN
- 5.6. Oceania
- 5.7. Rest of Asia Pacific
USA Automotive Aftermarket Industry REPORT HIGHLIGHTS
| Aspects | Details |
|---|---|
| Study Period | 2019-2033 |
| Base Year | 2024 |
| Estimated Year | 2025 |
| Forecast Period | 2025-2033 |
| Historical Period | 2019-2024 |
| Growth Rate | CAGR of 2.00% from 2019-2033 |
| Segmentation |
|
Table of Contents
- 1. Introduction
- 1.1. Research Scope
- 1.2. Market Segmentation
- 1.3. Research Methodology
- 1.4. Definitions and Assumptions
- 2. Executive Summary
- 2.1. Introduction
- 3. Market Dynamics
- 3.1. Introduction
- 3.2. Market Drivers
- 3.2.1. Rising Recreational and Motorsports Activities is Expected to Drive the Market; Others
- 3.3. Market Restrains
- 3.3.1. High Value and Maintenance Cost Offered to Restrain the Market Growth; Others
- 3.4. Market Trends
- 3.4.1. Rising Online Aftermarket Automotive Parts and Components Sales
- 4. Market Factor Analysis
- 4.1. Porters Five Forces
- 4.2. Supply/Value Chain
- 4.3. PESTEL analysis
- 4.4. Market Entropy
- 4.5. Patent/Trademark Analysis
- 5. Global USA Automotive Aftermarket Industry Analysis, Insights and Forecast, 2019-2031
- 5.1. Market Analysis, Insights and Forecast - by Vehicle Type
- 5.1.1. Passenger Cars
- 5.1.2. Commercial Vehicles
- 5.2. Market Analysis, Insights and Forecast - by Application
- 5.2.1. Engine Components
- 5.2.2. Transmission
- 5.2.3. Interior
- 5.2.4. Exterior
- 5.2.5. Other Applications
- 5.3. Market Analysis, Insights and Forecast - by Sales Channel
- 5.3.1. Online
- 5.3.2. Offline
- 5.4. Market Analysis, Insights and Forecast - by Region
- 5.4.1. North America
- 5.4.2. South America
- 5.4.3. Europe
- 5.4.4. Middle East & Africa
- 5.4.5. Asia Pacific
- 5.1. Market Analysis, Insights and Forecast - by Vehicle Type
- 6. North America USA Automotive Aftermarket Industry Analysis, Insights and Forecast, 2019-2031
- 6.1. Market Analysis, Insights and Forecast - by Vehicle Type
- 6.1.1. Passenger Cars
- 6.1.2. Commercial Vehicles
- 6.2. Market Analysis, Insights and Forecast - by Application
- 6.2.1. Engine Components
- 6.2.2. Transmission
- 6.2.3. Interior
- 6.2.4. Exterior
- 6.2.5. Other Applications
- 6.3. Market Analysis, Insights and Forecast - by Sales Channel
- 6.3.1. Online
- 6.3.2. Offline
- 6.1. Market Analysis, Insights and Forecast - by Vehicle Type
- 7. South America USA Automotive Aftermarket Industry Analysis, Insights and Forecast, 2019-2031
- 7.1. Market Analysis, Insights and Forecast - by Vehicle Type
- 7.1.1. Passenger Cars
- 7.1.2. Commercial Vehicles
- 7.2. Market Analysis, Insights and Forecast - by Application
- 7.2.1. Engine Components
- 7.2.2. Transmission
- 7.2.3. Interior
- 7.2.4. Exterior
- 7.2.5. Other Applications
- 7.3. Market Analysis, Insights and Forecast - by Sales Channel
- 7.3.1. Online
- 7.3.2. Offline
- 7.1. Market Analysis, Insights and Forecast - by Vehicle Type
- 8. Europe USA Automotive Aftermarket Industry Analysis, Insights and Forecast, 2019-2031
- 8.1. Market Analysis, Insights and Forecast - by Vehicle Type
- 8.1.1. Passenger Cars
- 8.1.2. Commercial Vehicles
- 8.2. Market Analysis, Insights and Forecast - by Application
- 8.2.1. Engine Components
- 8.2.2. Transmission
- 8.2.3. Interior
- 8.2.4. Exterior
- 8.2.5. Other Applications
- 8.3. Market Analysis, Insights and Forecast - by Sales Channel
- 8.3.1. Online
- 8.3.2. Offline
- 8.1. Market Analysis, Insights and Forecast - by Vehicle Type
- 9. Middle East & Africa USA Automotive Aftermarket Industry Analysis, Insights and Forecast, 2019-2031
- 9.1. Market Analysis, Insights and Forecast - by Vehicle Type
- 9.1.1. Passenger Cars
- 9.1.2. Commercial Vehicles
- 9.2. Market Analysis, Insights and Forecast - by Application
- 9.2.1. Engine Components
- 9.2.2. Transmission
- 9.2.3. Interior
- 9.2.4. Exterior
- 9.2.5. Other Applications
- 9.3. Market Analysis, Insights and Forecast - by Sales Channel
- 9.3.1. Online
- 9.3.2. Offline
- 9.1. Market Analysis, Insights and Forecast - by Vehicle Type
- 10. Asia Pacific USA Automotive Aftermarket Industry Analysis, Insights and Forecast, 2019-2031
- 10.1. Market Analysis, Insights and Forecast - by Vehicle Type
- 10.1.1. Passenger Cars
- 10.1.2. Commercial Vehicles
- 10.2. Market Analysis, Insights and Forecast - by Application
- 10.2.1. Engine Components
- 10.2.2. Transmission
- 10.2.3. Interior
- 10.2.4. Exterior
- 10.2.5. Other Applications
- 10.3. Market Analysis, Insights and Forecast - by Sales Channel
- 10.3.1. Online
- 10.3.2. Offline
- 10.1. Market Analysis, Insights and Forecast - by Vehicle Type
- 11. Northeast USA Automotive Aftermarket Industry Analysis, Insights and Forecast, 2019-2031
- 12. Southeast USA Automotive Aftermarket Industry Analysis, Insights and Forecast, 2019-2031
- 13. Midwest USA Automotive Aftermarket Industry Analysis, Insights and Forecast, 2019-2031
- 14. Southwest USA Automotive Aftermarket Industry Analysis, Insights and Forecast, 2019-2031
- 15. West USA Automotive Aftermarket Industry Analysis, Insights and Forecast, 2019-2031
- 16. Competitive Analysis
- 16.1. Global Market Share Analysis 2024
- 16.2. Company Profiles
- 16.2.1 Magna International Inc
- 16.2.1.1. Overview
- 16.2.1.2. Products
- 16.2.1.3. SWOT Analysis
- 16.2.1.4. Recent Developments
- 16.2.1.5. Financials (Based on Availability)
- 16.2.2 Aisin World Corp of America
- 16.2.2.1. Overview
- 16.2.2.2. Products
- 16.2.2.3. SWOT Analysis
- 16.2.2.4. Recent Developments
- 16.2.2.5. Financials (Based on Availability)
- 16.2.3 Yazaki North America Inc
- 16.2.3.1. Overview
- 16.2.3.2. Products
- 16.2.3.3. SWOT Analysis
- 16.2.3.4. Recent Developments
- 16.2.3.5. Financials (Based on Availability)
- 16.2.4 Aptiv PL
- 16.2.4.1. Overview
- 16.2.4.2. Products
- 16.2.4.3. SWOT Analysis
- 16.2.4.4. Recent Developments
- 16.2.4.5. Financials (Based on Availability)
- 16.2.5 American Axle & Manufacturing Holdings Inc
- 16.2.5.1. Overview
- 16.2.5.2. Products
- 16.2.5.3. SWOT Analysis
- 16.2.5.4. Recent Developments
- 16.2.5.5. Financials (Based on Availability)
- 16.2.6 Panasonic Automotive Systems Company of America
- 16.2.6.1. Overview
- 16.2.6.2. Products
- 16.2.6.3. SWOT Analysis
- 16.2.6.4. Recent Developments
- 16.2.6.5. Financials (Based on Availability)
- 16.2.7 Continental AG
- 16.2.7.1. Overview
- 16.2.7.2. Products
- 16.2.7.3. SWOT Analysis
- 16.2.7.4. Recent Developments
- 16.2.7.5. Financials (Based on Availability)
- 16.2.8 Flex-N-Gate Corporation
- 16.2.8.1. Overview
- 16.2.8.2. Products
- 16.2.8.3. SWOT Analysis
- 16.2.8.4. Recent Developments
- 16.2.8.5. Financials (Based on Availability)
- 16.2.9 Robert Bosch GmbH
- 16.2.9.1. Overview
- 16.2.9.2. Products
- 16.2.9.3. SWOT Analysis
- 16.2.9.4. Recent Developments
- 16.2.9.5. Financials (Based on Availability)
- 16.2.10 Lear Corporation
- 16.2.10.1. Overview
- 16.2.10.2. Products
- 16.2.10.3. SWOT Analysis
- 16.2.10.4. Recent Developments
- 16.2.10.5. Financials (Based on Availability)
- 16.2.11 Faurecia
- 16.2.11.1. Overview
- 16.2.11.2. Products
- 16.2.11.3. SWOT Analysis
- 16.2.11.4. Recent Developments
- 16.2.11.5. Financials (Based on Availability)
- 16.2.12 DENSO Corporation
- 16.2.12.1. Overview
- 16.2.12.2. Products
- 16.2.12.3. SWOT Analysis
- 16.2.12.4. Recent Developments
- 16.2.12.5. Financials (Based on Availability)
- 16.2.13 Adient PLC
- 16.2.13.1. Overview
- 16.2.13.2. Products
- 16.2.13.3. SWOT Analysis
- 16.2.13.4. Recent Developments
- 16.2.13.5. Financials (Based on Availability)
- 16.2.14 ZF Friedrichshafen AG
- 16.2.14.1. Overview
- 16.2.14.2. Products
- 16.2.14.3. SWOT Analysis
- 16.2.14.4. Recent Developments
- 16.2.14.5. Financials (Based on Availability)
- 16.2.1 Magna International Inc
List of Figures
- Figure 1: Global USA Automotive Aftermarket Industry Revenue Breakdown (Million, %) by Region 2024 & 2032
- Figure 2: United states USA Automotive Aftermarket Industry Revenue (Million), by Country 2024 & 2032
- Figure 3: United states USA Automotive Aftermarket Industry Revenue Share (%), by Country 2024 & 2032
- Figure 4: North America USA Automotive Aftermarket Industry Revenue (Million), by Vehicle Type 2024 & 2032
- Figure 5: North America USA Automotive Aftermarket Industry Revenue Share (%), by Vehicle Type 2024 & 2032
- Figure 6: North America USA Automotive Aftermarket Industry Revenue (Million), by Application 2024 & 2032
- Figure 7: North America USA Automotive Aftermarket Industry Revenue Share (%), by Application 2024 & 2032
- Figure 8: North America USA Automotive Aftermarket Industry Revenue (Million), by Sales Channel 2024 & 2032
- Figure 9: North America USA Automotive Aftermarket Industry Revenue Share (%), by Sales Channel 2024 & 2032
- Figure 10: North America USA Automotive Aftermarket Industry Revenue (Million), by Country 2024 & 2032
- Figure 11: North America USA Automotive Aftermarket Industry Revenue Share (%), by Country 2024 & 2032
- Figure 12: South America USA Automotive Aftermarket Industry Revenue (Million), by Vehicle Type 2024 & 2032
- Figure 13: South America USA Automotive Aftermarket Industry Revenue Share (%), by Vehicle Type 2024 & 2032
- Figure 14: South America USA Automotive Aftermarket Industry Revenue (Million), by Application 2024 & 2032
- Figure 15: South America USA Automotive Aftermarket Industry Revenue Share (%), by Application 2024 & 2032
- Figure 16: South America USA Automotive Aftermarket Industry Revenue (Million), by Sales Channel 2024 & 2032
- Figure 17: South America USA Automotive Aftermarket Industry Revenue Share (%), by Sales Channel 2024 & 2032
- Figure 18: South America USA Automotive Aftermarket Industry Revenue (Million), by Country 2024 & 2032
- Figure 19: South America USA Automotive Aftermarket Industry Revenue Share (%), by Country 2024 & 2032
- Figure 20: Europe USA Automotive Aftermarket Industry Revenue (Million), by Vehicle Type 2024 & 2032
- Figure 21: Europe USA Automotive Aftermarket Industry Revenue Share (%), by Vehicle Type 2024 & 2032
- Figure 22: Europe USA Automotive Aftermarket Industry Revenue (Million), by Application 2024 & 2032
- Figure 23: Europe USA Automotive Aftermarket Industry Revenue Share (%), by Application 2024 & 2032
- Figure 24: Europe USA Automotive Aftermarket Industry Revenue (Million), by Sales Channel 2024 & 2032
- Figure 25: Europe USA Automotive Aftermarket Industry Revenue Share (%), by Sales Channel 2024 & 2032
- Figure 26: Europe USA Automotive Aftermarket Industry Revenue (Million), by Country 2024 & 2032
- Figure 27: Europe USA Automotive Aftermarket Industry Revenue Share (%), by Country 2024 & 2032
- Figure 28: Middle East & Africa USA Automotive Aftermarket Industry Revenue (Million), by Vehicle Type 2024 & 2032
- Figure 29: Middle East & Africa USA Automotive Aftermarket Industry Revenue Share (%), by Vehicle Type 2024 & 2032
- Figure 30: Middle East & Africa USA Automotive Aftermarket Industry Revenue (Million), by Application 2024 & 2032
- Figure 31: Middle East & Africa USA Automotive Aftermarket Industry Revenue Share (%), by Application 2024 & 2032
- Figure 32: Middle East & Africa USA Automotive Aftermarket Industry Revenue (Million), by Sales Channel 2024 & 2032
- Figure 33: Middle East & Africa USA Automotive Aftermarket Industry Revenue Share (%), by Sales Channel 2024 & 2032
- Figure 34: Middle East & Africa USA Automotive Aftermarket Industry Revenue (Million), by Country 2024 & 2032
- Figure 35: Middle East & Africa USA Automotive Aftermarket Industry Revenue Share (%), by Country 2024 & 2032
- Figure 36: Asia Pacific USA Automotive Aftermarket Industry Revenue (Million), by Vehicle Type 2024 & 2032
- Figure 37: Asia Pacific USA Automotive Aftermarket Industry Revenue Share (%), by Vehicle Type 2024 & 2032
- Figure 38: Asia Pacific USA Automotive Aftermarket Industry Revenue (Million), by Application 2024 & 2032
- Figure 39: Asia Pacific USA Automotive Aftermarket Industry Revenue Share (%), by Application 2024 & 2032
- Figure 40: Asia Pacific USA Automotive Aftermarket Industry Revenue (Million), by Sales Channel 2024 & 2032
- Figure 41: Asia Pacific USA Automotive Aftermarket Industry Revenue Share (%), by Sales Channel 2024 & 2032
- Figure 42: Asia Pacific USA Automotive Aftermarket Industry Revenue (Million), by Country 2024 & 2032
- Figure 43: Asia Pacific USA Automotive Aftermarket Industry Revenue Share (%), by Country 2024 & 2032
List of Tables
- Table 1: Global USA Automotive Aftermarket Industry Revenue Million Forecast, by Region 2019 & 2032
- Table 2: Global USA Automotive Aftermarket Industry Revenue Million Forecast, by Vehicle Type 2019 & 2032
- Table 3: Global USA Automotive Aftermarket Industry Revenue Million Forecast, by Application 2019 & 2032
- Table 4: Global USA Automotive Aftermarket Industry Revenue Million Forecast, by Sales Channel 2019 & 2032
- Table 5: Global USA Automotive Aftermarket Industry Revenue Million Forecast, by Region 2019 & 2032
- Table 6: Global USA Automotive Aftermarket Industry Revenue Million Forecast, by Country 2019 & 2032
- Table 7: Northeast USA Automotive Aftermarket Industry Revenue (Million) Forecast, by Application 2019 & 2032
- Table 8: Southeast USA Automotive Aftermarket Industry Revenue (Million) Forecast, by Application 2019 & 2032
- Table 9: Midwest USA Automotive Aftermarket Industry Revenue (Million) Forecast, by Application 2019 & 2032
- Table 10: Southwest USA Automotive Aftermarket Industry Revenue (Million) Forecast, by Application 2019 & 2032
- Table 11: West USA Automotive Aftermarket Industry Revenue (Million) Forecast, by Application 2019 & 2032
- Table 12: Global USA Automotive Aftermarket Industry Revenue Million Forecast, by Vehicle Type 2019 & 2032
- Table 13: Global USA Automotive Aftermarket Industry Revenue Million Forecast, by Application 2019 & 2032
- Table 14: Global USA Automotive Aftermarket Industry Revenue Million Forecast, by Sales Channel 2019 & 2032
- Table 15: Global USA Automotive Aftermarket Industry Revenue Million Forecast, by Country 2019 & 2032
- Table 16: United States USA Automotive Aftermarket Industry Revenue (Million) Forecast, by Application 2019 & 2032
- Table 17: Canada USA Automotive Aftermarket Industry Revenue (Million) Forecast, by Application 2019 & 2032
- Table 18: Mexico USA Automotive Aftermarket Industry Revenue (Million) Forecast, by Application 2019 & 2032
- Table 19: Global USA Automotive Aftermarket Industry Revenue Million Forecast, by Vehicle Type 2019 & 2032
- Table 20: Global USA Automotive Aftermarket Industry Revenue Million Forecast, by Application 2019 & 2032
- Table 21: Global USA Automotive Aftermarket Industry Revenue Million Forecast, by Sales Channel 2019 & 2032
- Table 22: Global USA Automotive Aftermarket Industry Revenue Million Forecast, by Country 2019 & 2032
- Table 23: Brazil USA Automotive Aftermarket Industry Revenue (Million) Forecast, by Application 2019 & 2032
- Table 24: Argentina USA Automotive Aftermarket Industry Revenue (Million) Forecast, by Application 2019 & 2032
- Table 25: Rest of South America USA Automotive Aftermarket Industry Revenue (Million) Forecast, by Application 2019 & 2032
- Table 26: Global USA Automotive Aftermarket Industry Revenue Million Forecast, by Vehicle Type 2019 & 2032
- Table 27: Global USA Automotive Aftermarket Industry Revenue Million Forecast, by Application 2019 & 2032
- Table 28: Global USA Automotive Aftermarket Industry Revenue Million Forecast, by Sales Channel 2019 & 2032
- Table 29: Global USA Automotive Aftermarket Industry Revenue Million Forecast, by Country 2019 & 2032
- Table 30: United Kingdom USA Automotive Aftermarket Industry Revenue (Million) Forecast, by Application 2019 & 2032
- Table 31: Germany USA Automotive Aftermarket Industry Revenue (Million) Forecast, by Application 2019 & 2032
- Table 32: France USA Automotive Aftermarket Industry Revenue (Million) Forecast, by Application 2019 & 2032
- Table 33: Italy USA Automotive Aftermarket Industry Revenue (Million) Forecast, by Application 2019 & 2032
- Table 34: Spain USA Automotive Aftermarket Industry Revenue (Million) Forecast, by Application 2019 & 2032
- Table 35: Russia USA Automotive Aftermarket Industry Revenue (Million) Forecast, by Application 2019 & 2032
- Table 36: Benelux USA Automotive Aftermarket Industry Revenue (Million) Forecast, by Application 2019 & 2032
- Table 37: Nordics USA Automotive Aftermarket Industry Revenue (Million) Forecast, by Application 2019 & 2032
- Table 38: Rest of Europe USA Automotive Aftermarket Industry Revenue (Million) Forecast, by Application 2019 & 2032
- Table 39: Global USA Automotive Aftermarket Industry Revenue Million Forecast, by Vehicle Type 2019 & 2032
- Table 40: Global USA Automotive Aftermarket Industry Revenue Million Forecast, by Application 2019 & 2032
- Table 41: Global USA Automotive Aftermarket Industry Revenue Million Forecast, by Sales Channel 2019 & 2032
- Table 42: Global USA Automotive Aftermarket Industry Revenue Million Forecast, by Country 2019 & 2032
- Table 43: Turkey USA Automotive Aftermarket Industry Revenue (Million) Forecast, by Application 2019 & 2032
- Table 44: Israel USA Automotive Aftermarket Industry Revenue (Million) Forecast, by Application 2019 & 2032
- Table 45: GCC USA Automotive Aftermarket Industry Revenue (Million) Forecast, by Application 2019 & 2032
- Table 46: North Africa USA Automotive Aftermarket Industry Revenue (Million) Forecast, by Application 2019 & 2032
- Table 47: South Africa USA Automotive Aftermarket Industry Revenue (Million) Forecast, by Application 2019 & 2032
- Table 48: Rest of Middle East & Africa USA Automotive Aftermarket Industry Revenue (Million) Forecast, by Application 2019 & 2032
- Table 49: Global USA Automotive Aftermarket Industry Revenue Million Forecast, by Vehicle Type 2019 & 2032
- Table 50: Global USA Automotive Aftermarket Industry Revenue Million Forecast, by Application 2019 & 2032
- Table 51: Global USA Automotive Aftermarket Industry Revenue Million Forecast, by Sales Channel 2019 & 2032
- Table 52: Global USA Automotive Aftermarket Industry Revenue Million Forecast, by Country 2019 & 2032
- Table 53: China USA Automotive Aftermarket Industry Revenue (Million) Forecast, by Application 2019 & 2032
- Table 54: India USA Automotive Aftermarket Industry Revenue (Million) Forecast, by Application 2019 & 2032
- Table 55: Japan USA Automotive Aftermarket Industry Revenue (Million) Forecast, by Application 2019 & 2032
- Table 56: South Korea USA Automotive Aftermarket Industry Revenue (Million) Forecast, by Application 2019 & 2032
- Table 57: ASEAN USA Automotive Aftermarket Industry Revenue (Million) Forecast, by Application 2019 & 2032
- Table 58: Oceania USA Automotive Aftermarket Industry Revenue (Million) Forecast, by Application 2019 & 2032
- Table 59: Rest of Asia Pacific USA Automotive Aftermarket Industry Revenue (Million) Forecast, by Application 2019 & 2032
Frequently Asked Questions
1. What is the projected Compound Annual Growth Rate (CAGR) of the USA Automotive Aftermarket Industry?
The projected CAGR is approximately 2.00%.
2. Which companies are prominent players in the USA Automotive Aftermarket Industry?
Key companies in the market include Magna International Inc, Aisin World Corp of America, Yazaki North America Inc, Aptiv PL, American Axle & Manufacturing Holdings Inc, Panasonic Automotive Systems Company of America, Continental AG, Flex-N-Gate Corporation, Robert Bosch GmbH, Lear Corporation, Faurecia, DENSO Corporation, Adient PLC, ZF Friedrichshafen AG.
3. What are the main segments of the USA Automotive Aftermarket Industry?
The market segments include Vehicle Type, Application, Sales Channel.
4. Can you provide details about the market size?
The market size is estimated to be USD XX Million as of 2022.
5. What are some drivers contributing to market growth?
Rising Recreational and Motorsports Activities is Expected to Drive the Market; Others.
6. What are the notable trends driving market growth?
Rising Online Aftermarket Automotive Parts and Components Sales.
7. Are there any restraints impacting market growth?
High Value and Maintenance Cost Offered to Restrain the Market Growth; Others.
8. Can you provide examples of recent developments in the market?
December 2022: BorgWarner Inc announced plans to spin off their Fuel Systems and Aftermarket businesses into a separate, publicly traded company, which they are currently calling "NewCo." NewCo also intends to capitalize on growth trends in gasoline direct injection (GDI) and hydrogen injection systems. With this announcement, BorgWarner believes it will eventually meet or exceed its stated target of 25% revenue from EVs by 2025.
9. What pricing options are available for accessing the report?
Pricing options include single-user, multi-user, and enterprise licenses priced at USD 3800, USD 4500, and USD 5800 respectively.
10. Is the market size provided in terms of value or volume?
The market size is provided in terms of value, measured in Million.
11. Are there any specific market keywords associated with the report?
Yes, the market keyword associated with the report is "USA Automotive Aftermarket Industry," which aids in identifying and referencing the specific market segment covered.
12. How do I determine which pricing option suits my needs best?
The pricing options vary based on user requirements and access needs. Individual users may opt for single-user licenses, while businesses requiring broader access may choose multi-user or enterprise licenses for cost-effective access to the report.
13. Are there any additional resources or data provided in the USA Automotive Aftermarket Industry report?
While the report offers comprehensive insights, it's advisable to review the specific contents or supplementary materials provided to ascertain if additional resources or data are available.
14. How can I stay updated on further developments or reports in the USA Automotive Aftermarket Industry?
To stay informed about further developments, trends, and reports in the USA Automotive Aftermarket Industry, consider subscribing to industry newsletters, following relevant companies and organizations, or regularly checking reputable industry news sources and publications.
Methodology
Step 1 - Identification of Relevant Samples Size from Population Database


Step 2 - Approaches for Defining Global Market Size (Value, Volume* & Price*)

Note*: In applicable scenarios
Step 3 - Data Sources
Primary Research
- Web Analytics
- Survey Reports
- Research Institute
- Latest Research Reports
- Opinion Leaders
Secondary Research
- Annual Reports
- White Paper
- Latest Press Release
- Industry Association
- Paid Database
- Investor Presentations

Step 4 - Data Triangulation
Involves using different sources of information in order to increase the validity of a study
These sources are likely to be stakeholders in a program - participants, other researchers, program staff, other community members, and so on.
Then we put all data in single framework & apply various statistical tools to find out the dynamic on the market.
During the analysis stage, feedback from the stakeholder groups would be compared to determine areas of agreement as well as areas of divergence
