

Key Insights
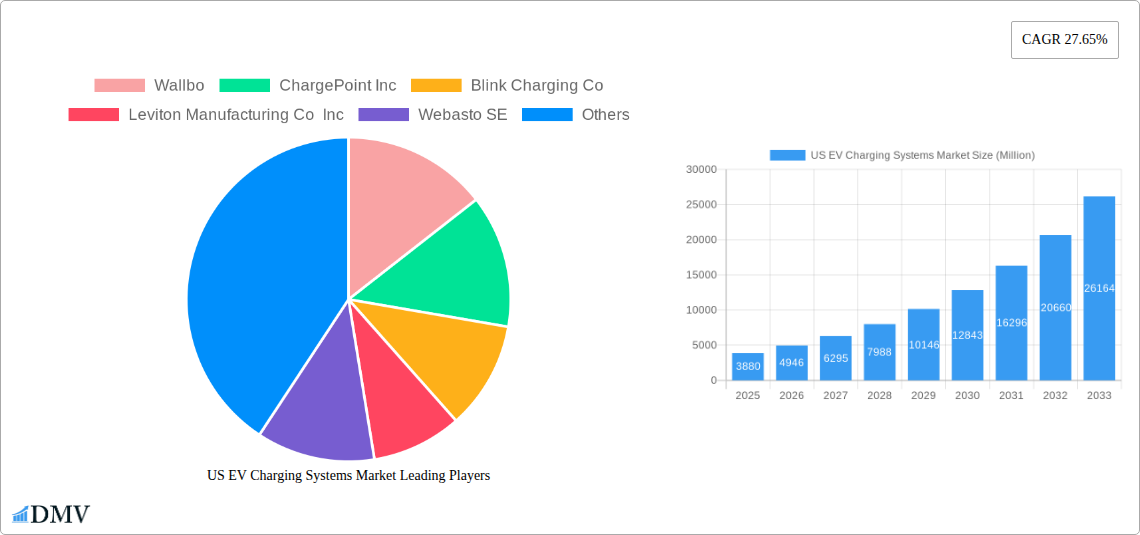
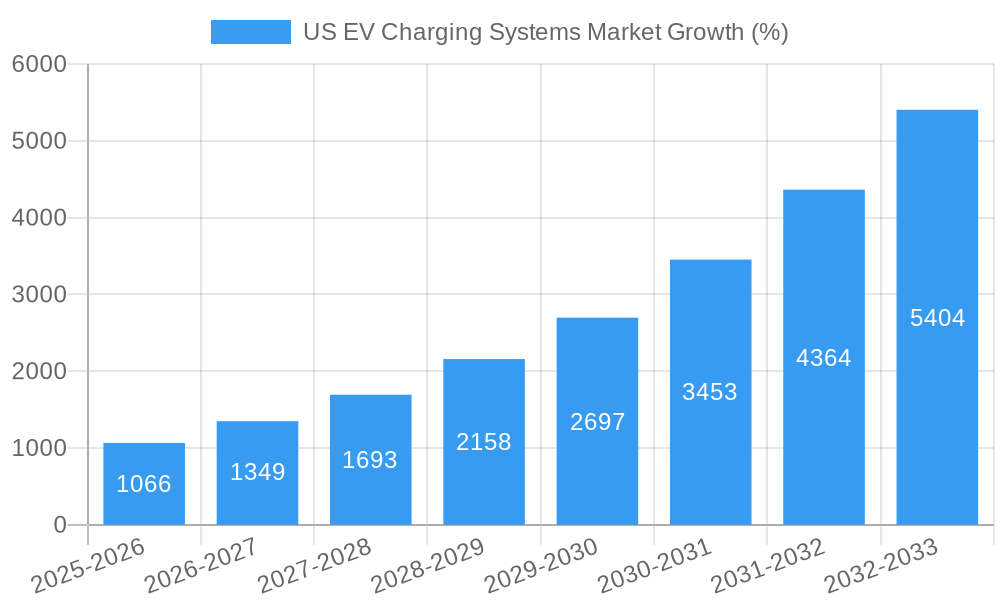
The US EV charging systems market is experiencing robust growth, fueled by increasing electric vehicle (EV) adoption, supportive government policies promoting clean energy, and advancements in charging technology. The market, valued at approximately $3.88 billion in 2025, is projected to expand at a Compound Annual Growth Rate (CAGR) of 27.65% from 2025 to 2033. This surge is driven primarily by the expanding public charging infrastructure, a growing number of commercial fleets transitioning to electric vehicles, and a consumer shift towards electric vehicles due to environmental concerns and potential cost savings on fuel. Significant investment in both fast and rapid charging solutions is further accelerating market expansion, catering to the increasing demand for convenient and quick charging options. The market segmentation reveals strong growth across various categories, including passenger car charging, fast charging systems, and charging stations installed in residential and commercial settings.
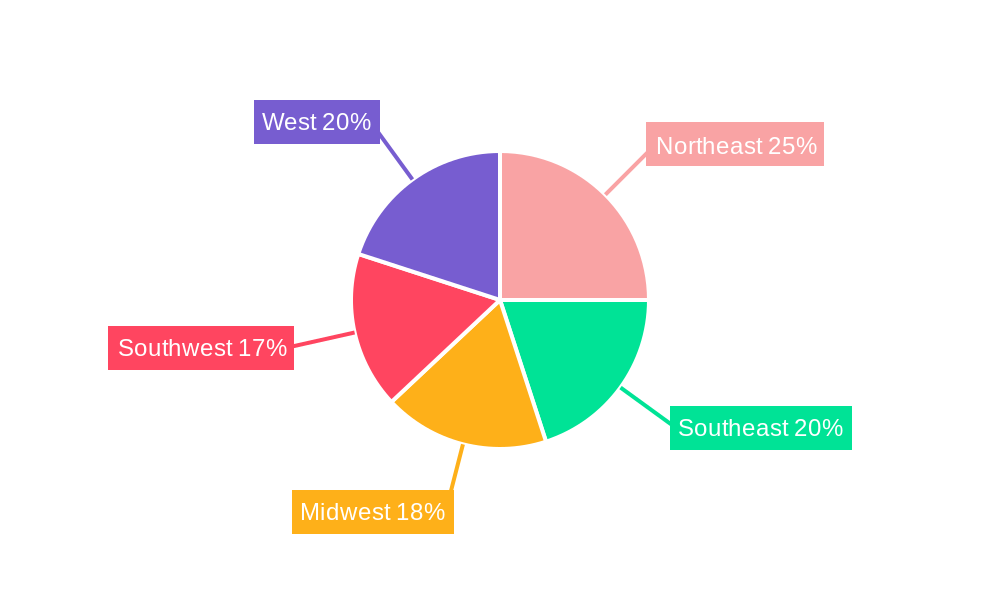
However, challenges remain. The high initial cost of installing charging infrastructure, particularly for rapid charging systems, presents a barrier to widespread adoption, especially in less populated areas. Furthermore, concerns around grid capacity and the need for smart grid integration to manage the increased energy demand from widespread EV adoption need to be addressed. Nevertheless, technological innovations such as improved battery technologies leading to faster charging times, and the increasing availability of affordable EV models, are anticipated to mitigate these challenges and sustain the market's high growth trajectory. The geographic distribution shows strong growth potential across all US regions, with variations depending on existing EV adoption rates, government incentives, and the density of urban vs. rural populations. The continued expansion of the EV ecosystem, coupled with ongoing technological advancements, positions the US EV charging systems market for considerable future growth.
US EV Charging Systems Market Report: 2019-2033
This comprehensive report provides a detailed analysis of the US EV charging systems market, offering invaluable insights for stakeholders seeking to navigate this rapidly evolving landscape. Covering the period 2019-2033, with a focus on 2025, this report meticulously examines market trends, technological advancements, and key players shaping the future of electric vehicle infrastructure in the United States. The market is projected to reach xx Million by 2033, demonstrating significant growth potential.
US EV Charging Systems Market Composition & Trends
This section delves into the intricate composition of the US EV charging systems market, analyzing market concentration, innovation drivers, regulatory frameworks, substitute products, end-user profiles, and merger & acquisition (M&A) activities. The market exhibits a moderately concentrated structure, with key players such as ChargePoint, Blink Charging, and Tesla holding significant market share. However, the presence of numerous smaller players indicates a dynamic and competitive landscape. Innovation is fueled by continuous advancements in charging technology, battery chemistry, and grid integration. The regulatory environment, including federal and state-level incentives and mandates, plays a crucial role in driving market growth. Competition from alternative transportation solutions, such as improved internal combustion engines and alternative fuels, poses a challenge. End-users encompass residential, commercial, and public entities, each with distinct charging needs and preferences. M&A activity is expected to increase, leading to further consolidation within the sector.
- Market Share Distribution (2024): ChargePoint (xx%), Blink Charging (xx%), Tesla (xx%), Others (xx%).
- M&A Deal Value (2019-2024): USD xx Million.
- Key Innovation Catalysts: Improved charging speeds, smart grid integration, and enhanced battery technologies.
- Regulatory Landscape: Federal and state-level incentives, emissions regulations, and infrastructure development plans.
US EV Charging Systems Market Industry Evolution
The US EV charging systems market has experienced significant growth over the past five years (2019-2024), driven by increasing EV adoption, government support, and technological advancements. The market exhibits a compound annual growth rate (CAGR) of xx% during the historical period. Technological innovations, such as the introduction of fast and rapid charging systems, have significantly impacted market dynamics. Consumer demand is shifting toward faster, more convenient, and reliable charging solutions. The increasing availability of public charging stations, particularly along major highways and in urban areas, is a crucial factor driving market expansion. Furthermore, the rising affordability of EVs and the growing awareness of environmental concerns contribute to market expansion. This evolution is further fueled by ongoing research into advanced charging technologies, including wireless charging and vehicle-to-grid (V2G) systems, promising to reshape the industry in the coming years. The forecast period (2025-2033) expects a CAGR of xx%, driven by anticipated growth in EV sales, expanding charging infrastructure, and continuous technological innovation. Adoption metrics, such as the number of installed charging stations and the percentage of EV ownership, are key indicators of market maturity.
Leading Regions, Countries, or Segments in US EV Charging Systems Market
The US EV charging systems market demonstrates regional variations in growth. California, Texas, and New York are currently leading states. California’s dominance is attributed to stringent emission regulations, aggressive EV adoption policies, and significant investment in charging infrastructure. Texas benefits from a large population and growing EV market. New York’s strong position reflects its urban density and substantial public transit initiatives.
- By Application Type: The Public segment is experiencing the fastest growth due to government initiatives and increased funding.
- By Equipment Type: Pillar/Charging Station/Dock holds the largest market share due to its widespread adoption.
- By Vehicle Type: Passenger Cars segment dominates the market due to the higher number of passenger EV sales.
- By Charging System Type: Fast and Rapid Charging systems are gaining traction due to their convenience and faster charging times.
Key Drivers: Government investment (e.g., USD 623 Million in January 2024 for national charging infrastructure), State-level incentives, and supportive regulations.
US EV Charging Systems Market Product Innovations
Recent innovations include the introduction of smart chargers with enhanced functionalities, such as remote monitoring and energy management features. The market also witnesses a rise in DC fast chargers, significantly reducing charging time for EVs. Performance metrics such as charging speed, power output, and reliability are key differentiators. Wallbox's Pulsar Pro and Supernova 180 represent significant advancements in both residential/commercial and DC fast charging segments. These innovations aim to address consumer demand for quicker and more convenient charging solutions.
Propelling Factors for US EV Charging Systems Market Growth
The US EV charging systems market is propelled by several factors:
- Technological advancements: Higher charging speeds, improved energy efficiency, and smart grid integration.
- Government initiatives: Significant funding for EV infrastructure development (e.g., USD 5 Billion NEVI program).
- Increasing EV adoption: Rising EV sales and consumer demand for convenient charging solutions.
- Economic factors: Decreasing battery costs and improving return on investment for charging infrastructure.
Obstacles in the US EV Charging Systems Market
Challenges facing the market include:
- High initial investment costs: Setting up charging stations requires substantial capital expenditure.
- Interoperability issues: Lack of standardization across charging systems can hamper seamless EV charging experiences.
- Grid infrastructure limitations: Existing electricity grids may struggle to handle a massive increase in charging demand.
- Supply chain disruptions: Component shortages and geopolitical events can affect the availability of charging equipment.
Future Opportunities in US EV Charging Systems Market
Future opportunities lie in:
- Wireless charging technology: Eliminating the need for physical connectors.
- Vehicle-to-grid (V2G) technology: Enabling EVs to supply power back to the grid.
- Expansion into rural areas: Providing charging infrastructure in underserved regions.
- Development of smart charging solutions: Optimizing energy usage and reducing grid strain.
Major Players in the US EV Charging Systems Market Ecosystem
- Wallbox
- ChargePoint Inc
- Blink Charging Co
- Leviton Manufacturing Co Inc
- Webasto SE
- Siemens AG
- Schneider Electric SE
- ABB Group
- Tesla Inc
- EVBox Group
- EvoCharge Inc
- Eaton Corporation
Key Developments in US EV Charging Systems Market Industry
- March 2024: Wallbox launches Pulsar Pro North America and Supernova 180 DC fast charger, expanding its product portfolio and contributing to the growth of the fast-charging ecosystem.
- January 2024: The US government announces a USD 623 Million investment in EV charging infrastructure, boosting the deployment of various charging points nationwide.
- January 2024: The US Transportation Department awards USD 148.8 Million to replace or repair 4,500 existing EV charging stations, further enhancing the national charging network.
Strategic US EV Charging Systems Market Forecast
The US EV charging systems market is poised for significant growth in the coming years. The increasing adoption of electric vehicles, coupled with supportive government policies and technological advancements, will drive market expansion. Opportunities exist in expanding charging infrastructure, developing innovative charging technologies, and improving grid integration. The market is expected to experience substantial growth, driven by both public and private sector investments. The increasing focus on sustainability and reducing carbon emissions further reinforces the market's positive outlook.
US EV Charging Systems Market Segmentation
-
1. Application Type
- 1.1. Public
- 1.2. Private (Residential and Commercial)
-
2. Equipment Type
- 2.1. Pillar/Charging Station/Dock
- 2.2. Inverter
-
2.3. Charger
- 2.3.1. AC Charger
- 2.3.2. DC Charger
- 2.4. Others (Cord, Port, etc.)
-
3. Vehicle Type
- 3.1. Passenger Cars
- 3.2. Commercial Vehicles
-
4. Charging System Type
- 4.1. Slow Charging Systems
- 4.2. Fast Charging Systems
- 4.3. Rapid Charging Systems
US EV Charging Systems Market Segmentation By Geography
-
1. North America
- 1.1. United States
- 1.2. Canada
- 1.3. Mexico
-
2. South America
- 2.1. Brazil
- 2.2. Argentina
- 2.3. Rest of South America
-
3. Europe
- 3.1. United Kingdom
- 3.2. Germany
- 3.3. France
- 3.4. Italy
- 3.5. Spain
- 3.6. Russia
- 3.7. Benelux
- 3.8. Nordics
- 3.9. Rest of Europe
-
4. Middle East & Africa
- 4.1. Turkey
- 4.2. Israel
- 4.3. GCC
- 4.4. North Africa
- 4.5. South Africa
- 4.6. Rest of Middle East & Africa
-
5. Asia Pacific
- 5.1. China
- 5.2. India
- 5.3. Japan
- 5.4. South Korea
- 5.5. ASEAN
- 5.6. Oceania
- 5.7. Rest of Asia Pacific
US EV Charging Systems Market REPORT HIGHLIGHTS
| Aspects | Details |
|---|---|
| Study Period | 2019-2033 |
| Base Year | 2024 |
| Estimated Year | 2025 |
| Forecast Period | 2025-2033 |
| Historical Period | 2019-2024 |
| Growth Rate | CAGR of 27.65% from 2019-2033 |
| Segmentation |
|
Table of Contents
- 1. Introduction
- 1.1. Research Scope
- 1.2. Market Segmentation
- 1.3. Research Methodology
- 1.4. Definitions and Assumptions
- 2. Executive Summary
- 2.1. Introduction
- 3. Market Dynamics
- 3.1. Introduction
- 3.2. Market Drivers
- 3.2.1. Aggressive Government Focus to Promote the Adoption of Electric Vehicles Fosters the Growth of the Market
- 3.3. Market Restrains
- 3.3.1. High Cost of Setting Up EV Charging Stations Hampers the Growth of the Market
- 3.4. Market Trends
- 3.4.1. Passengers Cars Segment to Gain Traction during the Forecast Period
- 4. Market Factor Analysis
- 4.1. Porters Five Forces
- 4.2. Supply/Value Chain
- 4.3. PESTEL analysis
- 4.4. Market Entropy
- 4.5. Patent/Trademark Analysis
- 5. Global US EV Charging Systems Market Analysis, Insights and Forecast, 2019-2031
- 5.1. Market Analysis, Insights and Forecast - by Application Type
- 5.1.1. Public
- 5.1.2. Private (Residential and Commercial)
- 5.2. Market Analysis, Insights and Forecast - by Equipment Type
- 5.2.1. Pillar/Charging Station/Dock
- 5.2.2. Inverter
- 5.2.3. Charger
- 5.2.3.1. AC Charger
- 5.2.3.2. DC Charger
- 5.2.4. Others (Cord, Port, etc.)
- 5.3. Market Analysis, Insights and Forecast - by Vehicle Type
- 5.3.1. Passenger Cars
- 5.3.2. Commercial Vehicles
- 5.4. Market Analysis, Insights and Forecast - by Charging System Type
- 5.4.1. Slow Charging Systems
- 5.4.2. Fast Charging Systems
- 5.4.3. Rapid Charging Systems
- 5.5. Market Analysis, Insights and Forecast - by Region
- 5.5.1. North America
- 5.5.2. South America
- 5.5.3. Europe
- 5.5.4. Middle East & Africa
- 5.5.5. Asia Pacific
- 5.1. Market Analysis, Insights and Forecast - by Application Type
- 6. North America US EV Charging Systems Market Analysis, Insights and Forecast, 2019-2031
- 6.1. Market Analysis, Insights and Forecast - by Application Type
- 6.1.1. Public
- 6.1.2. Private (Residential and Commercial)
- 6.2. Market Analysis, Insights and Forecast - by Equipment Type
- 6.2.1. Pillar/Charging Station/Dock
- 6.2.2. Inverter
- 6.2.3. Charger
- 6.2.3.1. AC Charger
- 6.2.3.2. DC Charger
- 6.2.4. Others (Cord, Port, etc.)
- 6.3. Market Analysis, Insights and Forecast - by Vehicle Type
- 6.3.1. Passenger Cars
- 6.3.2. Commercial Vehicles
- 6.4. Market Analysis, Insights and Forecast - by Charging System Type
- 6.4.1. Slow Charging Systems
- 6.4.2. Fast Charging Systems
- 6.4.3. Rapid Charging Systems
- 6.1. Market Analysis, Insights and Forecast - by Application Type
- 7. South America US EV Charging Systems Market Analysis, Insights and Forecast, 2019-2031
- 7.1. Market Analysis, Insights and Forecast - by Application Type
- 7.1.1. Public
- 7.1.2. Private (Residential and Commercial)
- 7.2. Market Analysis, Insights and Forecast - by Equipment Type
- 7.2.1. Pillar/Charging Station/Dock
- 7.2.2. Inverter
- 7.2.3. Charger
- 7.2.3.1. AC Charger
- 7.2.3.2. DC Charger
- 7.2.4. Others (Cord, Port, etc.)
- 7.3. Market Analysis, Insights and Forecast - by Vehicle Type
- 7.3.1. Passenger Cars
- 7.3.2. Commercial Vehicles
- 7.4. Market Analysis, Insights and Forecast - by Charging System Type
- 7.4.1. Slow Charging Systems
- 7.4.2. Fast Charging Systems
- 7.4.3. Rapid Charging Systems
- 7.1. Market Analysis, Insights and Forecast - by Application Type
- 8. Europe US EV Charging Systems Market Analysis, Insights and Forecast, 2019-2031
- 8.1. Market Analysis, Insights and Forecast - by Application Type
- 8.1.1. Public
- 8.1.2. Private (Residential and Commercial)
- 8.2. Market Analysis, Insights and Forecast - by Equipment Type
- 8.2.1. Pillar/Charging Station/Dock
- 8.2.2. Inverter
- 8.2.3. Charger
- 8.2.3.1. AC Charger
- 8.2.3.2. DC Charger
- 8.2.4. Others (Cord, Port, etc.)
- 8.3. Market Analysis, Insights and Forecast - by Vehicle Type
- 8.3.1. Passenger Cars
- 8.3.2. Commercial Vehicles
- 8.4. Market Analysis, Insights and Forecast - by Charging System Type
- 8.4.1. Slow Charging Systems
- 8.4.2. Fast Charging Systems
- 8.4.3. Rapid Charging Systems
- 8.1. Market Analysis, Insights and Forecast - by Application Type
- 9. Middle East & Africa US EV Charging Systems Market Analysis, Insights and Forecast, 2019-2031
- 9.1. Market Analysis, Insights and Forecast - by Application Type
- 9.1.1. Public
- 9.1.2. Private (Residential and Commercial)
- 9.2. Market Analysis, Insights and Forecast - by Equipment Type
- 9.2.1. Pillar/Charging Station/Dock
- 9.2.2. Inverter
- 9.2.3. Charger
- 9.2.3.1. AC Charger
- 9.2.3.2. DC Charger
- 9.2.4. Others (Cord, Port, etc.)
- 9.3. Market Analysis, Insights and Forecast - by Vehicle Type
- 9.3.1. Passenger Cars
- 9.3.2. Commercial Vehicles
- 9.4. Market Analysis, Insights and Forecast - by Charging System Type
- 9.4.1. Slow Charging Systems
- 9.4.2. Fast Charging Systems
- 9.4.3. Rapid Charging Systems
- 9.1. Market Analysis, Insights and Forecast - by Application Type
- 10. Asia Pacific US EV Charging Systems Market Analysis, Insights and Forecast, 2019-2031
- 10.1. Market Analysis, Insights and Forecast - by Application Type
- 10.1.1. Public
- 10.1.2. Private (Residential and Commercial)
- 10.2. Market Analysis, Insights and Forecast - by Equipment Type
- 10.2.1. Pillar/Charging Station/Dock
- 10.2.2. Inverter
- 10.2.3. Charger
- 10.2.3.1. AC Charger
- 10.2.3.2. DC Charger
- 10.2.4. Others (Cord, Port, etc.)
- 10.3. Market Analysis, Insights and Forecast - by Vehicle Type
- 10.3.1. Passenger Cars
- 10.3.2. Commercial Vehicles
- 10.4. Market Analysis, Insights and Forecast - by Charging System Type
- 10.4.1. Slow Charging Systems
- 10.4.2. Fast Charging Systems
- 10.4.3. Rapid Charging Systems
- 10.1. Market Analysis, Insights and Forecast - by Application Type
- 11. Northeast US EV Charging Systems Market Analysis, Insights and Forecast, 2019-2031
- 12. Southeast US EV Charging Systems Market Analysis, Insights and Forecast, 2019-2031
- 13. Midwest US EV Charging Systems Market Analysis, Insights and Forecast, 2019-2031
- 14. Southwest US EV Charging Systems Market Analysis, Insights and Forecast, 2019-2031
- 15. West US EV Charging Systems Market Analysis, Insights and Forecast, 2019-2031
- 16. Competitive Analysis
- 16.1. Global Market Share Analysis 2024
- 16.2. Company Profiles
- 16.2.1 Wallbo
- 16.2.1.1. Overview
- 16.2.1.2. Products
- 16.2.1.3. SWOT Analysis
- 16.2.1.4. Recent Developments
- 16.2.1.5. Financials (Based on Availability)
- 16.2.2 ChargePoint Inc
- 16.2.2.1. Overview
- 16.2.2.2. Products
- 16.2.2.3. SWOT Analysis
- 16.2.2.4. Recent Developments
- 16.2.2.5. Financials (Based on Availability)
- 16.2.3 Blink Charging Co
- 16.2.3.1. Overview
- 16.2.3.2. Products
- 16.2.3.3. SWOT Analysis
- 16.2.3.4. Recent Developments
- 16.2.3.5. Financials (Based on Availability)
- 16.2.4 Leviton Manufacturing Co Inc
- 16.2.4.1. Overview
- 16.2.4.2. Products
- 16.2.4.3. SWOT Analysis
- 16.2.4.4. Recent Developments
- 16.2.4.5. Financials (Based on Availability)
- 16.2.5 Webasto SE
- 16.2.5.1. Overview
- 16.2.5.2. Products
- 16.2.5.3. SWOT Analysis
- 16.2.5.4. Recent Developments
- 16.2.5.5. Financials (Based on Availability)
- 16.2.6 Siemens AG
- 16.2.6.1. Overview
- 16.2.6.2. Products
- 16.2.6.3. SWOT Analysis
- 16.2.6.4. Recent Developments
- 16.2.6.5. Financials (Based on Availability)
- 16.2.7 Schneider Electric SE
- 16.2.7.1. Overview
- 16.2.7.2. Products
- 16.2.7.3. SWOT Analysis
- 16.2.7.4. Recent Developments
- 16.2.7.5. Financials (Based on Availability)
- 16.2.8 ABB Group
- 16.2.8.1. Overview
- 16.2.8.2. Products
- 16.2.8.3. SWOT Analysis
- 16.2.8.4. Recent Developments
- 16.2.8.5. Financials (Based on Availability)
- 16.2.9 Tesla Inc
- 16.2.9.1. Overview
- 16.2.9.2. Products
- 16.2.9.3. SWOT Analysis
- 16.2.9.4. Recent Developments
- 16.2.9.5. Financials (Based on Availability)
- 16.2.10 EVBox Group
- 16.2.10.1. Overview
- 16.2.10.2. Products
- 16.2.10.3. SWOT Analysis
- 16.2.10.4. Recent Developments
- 16.2.10.5. Financials (Based on Availability)
- 16.2.11 EvoCharge Inc
- 16.2.11.1. Overview
- 16.2.11.2. Products
- 16.2.11.3. SWOT Analysis
- 16.2.11.4. Recent Developments
- 16.2.11.5. Financials (Based on Availability)
- 16.2.12 Eaton Corporation
- 16.2.12.1. Overview
- 16.2.12.2. Products
- 16.2.12.3. SWOT Analysis
- 16.2.12.4. Recent Developments
- 16.2.12.5. Financials (Based on Availability)
- 16.2.1 Wallbo
List of Figures
- Figure 1: Global US EV Charging Systems Market Revenue Breakdown (Million, %) by Region 2024 & 2032
- Figure 2: United states US EV Charging Systems Market Revenue (Million), by Country 2024 & 2032
- Figure 3: United states US EV Charging Systems Market Revenue Share (%), by Country 2024 & 2032
- Figure 4: North America US EV Charging Systems Market Revenue (Million), by Application Type 2024 & 2032
- Figure 5: North America US EV Charging Systems Market Revenue Share (%), by Application Type 2024 & 2032
- Figure 6: North America US EV Charging Systems Market Revenue (Million), by Equipment Type 2024 & 2032
- Figure 7: North America US EV Charging Systems Market Revenue Share (%), by Equipment Type 2024 & 2032
- Figure 8: North America US EV Charging Systems Market Revenue (Million), by Vehicle Type 2024 & 2032
- Figure 9: North America US EV Charging Systems Market Revenue Share (%), by Vehicle Type 2024 & 2032
- Figure 10: North America US EV Charging Systems Market Revenue (Million), by Charging System Type 2024 & 2032
- Figure 11: North America US EV Charging Systems Market Revenue Share (%), by Charging System Type 2024 & 2032
- Figure 12: North America US EV Charging Systems Market Revenue (Million), by Country 2024 & 2032
- Figure 13: North America US EV Charging Systems Market Revenue Share (%), by Country 2024 & 2032
- Figure 14: South America US EV Charging Systems Market Revenue (Million), by Application Type 2024 & 2032
- Figure 15: South America US EV Charging Systems Market Revenue Share (%), by Application Type 2024 & 2032
- Figure 16: South America US EV Charging Systems Market Revenue (Million), by Equipment Type 2024 & 2032
- Figure 17: South America US EV Charging Systems Market Revenue Share (%), by Equipment Type 2024 & 2032
- Figure 18: South America US EV Charging Systems Market Revenue (Million), by Vehicle Type 2024 & 2032
- Figure 19: South America US EV Charging Systems Market Revenue Share (%), by Vehicle Type 2024 & 2032
- Figure 20: South America US EV Charging Systems Market Revenue (Million), by Charging System Type 2024 & 2032
- Figure 21: South America US EV Charging Systems Market Revenue Share (%), by Charging System Type 2024 & 2032
- Figure 22: South America US EV Charging Systems Market Revenue (Million), by Country 2024 & 2032
- Figure 23: South America US EV Charging Systems Market Revenue Share (%), by Country 2024 & 2032
- Figure 24: Europe US EV Charging Systems Market Revenue (Million), by Application Type 2024 & 2032
- Figure 25: Europe US EV Charging Systems Market Revenue Share (%), by Application Type 2024 & 2032
- Figure 26: Europe US EV Charging Systems Market Revenue (Million), by Equipment Type 2024 & 2032
- Figure 27: Europe US EV Charging Systems Market Revenue Share (%), by Equipment Type 2024 & 2032
- Figure 28: Europe US EV Charging Systems Market Revenue (Million), by Vehicle Type 2024 & 2032
- Figure 29: Europe US EV Charging Systems Market Revenue Share (%), by Vehicle Type 2024 & 2032
- Figure 30: Europe US EV Charging Systems Market Revenue (Million), by Charging System Type 2024 & 2032
- Figure 31: Europe US EV Charging Systems Market Revenue Share (%), by Charging System Type 2024 & 2032
- Figure 32: Europe US EV Charging Systems Market Revenue (Million), by Country 2024 & 2032
- Figure 33: Europe US EV Charging Systems Market Revenue Share (%), by Country 2024 & 2032
- Figure 34: Middle East & Africa US EV Charging Systems Market Revenue (Million), by Application Type 2024 & 2032
- Figure 35: Middle East & Africa US EV Charging Systems Market Revenue Share (%), by Application Type 2024 & 2032
- Figure 36: Middle East & Africa US EV Charging Systems Market Revenue (Million), by Equipment Type 2024 & 2032
- Figure 37: Middle East & Africa US EV Charging Systems Market Revenue Share (%), by Equipment Type 2024 & 2032
- Figure 38: Middle East & Africa US EV Charging Systems Market Revenue (Million), by Vehicle Type 2024 & 2032
- Figure 39: Middle East & Africa US EV Charging Systems Market Revenue Share (%), by Vehicle Type 2024 & 2032
- Figure 40: Middle East & Africa US EV Charging Systems Market Revenue (Million), by Charging System Type 2024 & 2032
- Figure 41: Middle East & Africa US EV Charging Systems Market Revenue Share (%), by Charging System Type 2024 & 2032
- Figure 42: Middle East & Africa US EV Charging Systems Market Revenue (Million), by Country 2024 & 2032
- Figure 43: Middle East & Africa US EV Charging Systems Market Revenue Share (%), by Country 2024 & 2032
- Figure 44: Asia Pacific US EV Charging Systems Market Revenue (Million), by Application Type 2024 & 2032
- Figure 45: Asia Pacific US EV Charging Systems Market Revenue Share (%), by Application Type 2024 & 2032
- Figure 46: Asia Pacific US EV Charging Systems Market Revenue (Million), by Equipment Type 2024 & 2032
- Figure 47: Asia Pacific US EV Charging Systems Market Revenue Share (%), by Equipment Type 2024 & 2032
- Figure 48: Asia Pacific US EV Charging Systems Market Revenue (Million), by Vehicle Type 2024 & 2032
- Figure 49: Asia Pacific US EV Charging Systems Market Revenue Share (%), by Vehicle Type 2024 & 2032
- Figure 50: Asia Pacific US EV Charging Systems Market Revenue (Million), by Charging System Type 2024 & 2032
- Figure 51: Asia Pacific US EV Charging Systems Market Revenue Share (%), by Charging System Type 2024 & 2032
- Figure 52: Asia Pacific US EV Charging Systems Market Revenue (Million), by Country 2024 & 2032
- Figure 53: Asia Pacific US EV Charging Systems Market Revenue Share (%), by Country 2024 & 2032
List of Tables
- Table 1: Global US EV Charging Systems Market Revenue Million Forecast, by Region 2019 & 2032
- Table 2: Global US EV Charging Systems Market Revenue Million Forecast, by Application Type 2019 & 2032
- Table 3: Global US EV Charging Systems Market Revenue Million Forecast, by Equipment Type 2019 & 2032
- Table 4: Global US EV Charging Systems Market Revenue Million Forecast, by Vehicle Type 2019 & 2032
- Table 5: Global US EV Charging Systems Market Revenue Million Forecast, by Charging System Type 2019 & 2032
- Table 6: Global US EV Charging Systems Market Revenue Million Forecast, by Region 2019 & 2032
- Table 7: Global US EV Charging Systems Market Revenue Million Forecast, by Country 2019 & 2032
- Table 8: Northeast US EV Charging Systems Market Revenue (Million) Forecast, by Application 2019 & 2032
- Table 9: Southeast US EV Charging Systems Market Revenue (Million) Forecast, by Application 2019 & 2032
- Table 10: Midwest US EV Charging Systems Market Revenue (Million) Forecast, by Application 2019 & 2032
- Table 11: Southwest US EV Charging Systems Market Revenue (Million) Forecast, by Application 2019 & 2032
- Table 12: West US EV Charging Systems Market Revenue (Million) Forecast, by Application 2019 & 2032
- Table 13: Global US EV Charging Systems Market Revenue Million Forecast, by Application Type 2019 & 2032
- Table 14: Global US EV Charging Systems Market Revenue Million Forecast, by Equipment Type 2019 & 2032
- Table 15: Global US EV Charging Systems Market Revenue Million Forecast, by Vehicle Type 2019 & 2032
- Table 16: Global US EV Charging Systems Market Revenue Million Forecast, by Charging System Type 2019 & 2032
- Table 17: Global US EV Charging Systems Market Revenue Million Forecast, by Country 2019 & 2032
- Table 18: United States US EV Charging Systems Market Revenue (Million) Forecast, by Application 2019 & 2032
- Table 19: Canada US EV Charging Systems Market Revenue (Million) Forecast, by Application 2019 & 2032
- Table 20: Mexico US EV Charging Systems Market Revenue (Million) Forecast, by Application 2019 & 2032
- Table 21: Global US EV Charging Systems Market Revenue Million Forecast, by Application Type 2019 & 2032
- Table 22: Global US EV Charging Systems Market Revenue Million Forecast, by Equipment Type 2019 & 2032
- Table 23: Global US EV Charging Systems Market Revenue Million Forecast, by Vehicle Type 2019 & 2032
- Table 24: Global US EV Charging Systems Market Revenue Million Forecast, by Charging System Type 2019 & 2032
- Table 25: Global US EV Charging Systems Market Revenue Million Forecast, by Country 2019 & 2032
- Table 26: Brazil US EV Charging Systems Market Revenue (Million) Forecast, by Application 2019 & 2032
- Table 27: Argentina US EV Charging Systems Market Revenue (Million) Forecast, by Application 2019 & 2032
- Table 28: Rest of South America US EV Charging Systems Market Revenue (Million) Forecast, by Application 2019 & 2032
- Table 29: Global US EV Charging Systems Market Revenue Million Forecast, by Application Type 2019 & 2032
- Table 30: Global US EV Charging Systems Market Revenue Million Forecast, by Equipment Type 2019 & 2032
- Table 31: Global US EV Charging Systems Market Revenue Million Forecast, by Vehicle Type 2019 & 2032
- Table 32: Global US EV Charging Systems Market Revenue Million Forecast, by Charging System Type 2019 & 2032
- Table 33: Global US EV Charging Systems Market Revenue Million Forecast, by Country 2019 & 2032
- Table 34: United Kingdom US EV Charging Systems Market Revenue (Million) Forecast, by Application 2019 & 2032
- Table 35: Germany US EV Charging Systems Market Revenue (Million) Forecast, by Application 2019 & 2032
- Table 36: France US EV Charging Systems Market Revenue (Million) Forecast, by Application 2019 & 2032
- Table 37: Italy US EV Charging Systems Market Revenue (Million) Forecast, by Application 2019 & 2032
- Table 38: Spain US EV Charging Systems Market Revenue (Million) Forecast, by Application 2019 & 2032
- Table 39: Russia US EV Charging Systems Market Revenue (Million) Forecast, by Application 2019 & 2032
- Table 40: Benelux US EV Charging Systems Market Revenue (Million) Forecast, by Application 2019 & 2032
- Table 41: Nordics US EV Charging Systems Market Revenue (Million) Forecast, by Application 2019 & 2032
- Table 42: Rest of Europe US EV Charging Systems Market Revenue (Million) Forecast, by Application 2019 & 2032
- Table 43: Global US EV Charging Systems Market Revenue Million Forecast, by Application Type 2019 & 2032
- Table 44: Global US EV Charging Systems Market Revenue Million Forecast, by Equipment Type 2019 & 2032
- Table 45: Global US EV Charging Systems Market Revenue Million Forecast, by Vehicle Type 2019 & 2032
- Table 46: Global US EV Charging Systems Market Revenue Million Forecast, by Charging System Type 2019 & 2032
- Table 47: Global US EV Charging Systems Market Revenue Million Forecast, by Country 2019 & 2032
- Table 48: Turkey US EV Charging Systems Market Revenue (Million) Forecast, by Application 2019 & 2032
- Table 49: Israel US EV Charging Systems Market Revenue (Million) Forecast, by Application 2019 & 2032
- Table 50: GCC US EV Charging Systems Market Revenue (Million) Forecast, by Application 2019 & 2032
- Table 51: North Africa US EV Charging Systems Market Revenue (Million) Forecast, by Application 2019 & 2032
- Table 52: South Africa US EV Charging Systems Market Revenue (Million) Forecast, by Application 2019 & 2032
- Table 53: Rest of Middle East & Africa US EV Charging Systems Market Revenue (Million) Forecast, by Application 2019 & 2032
- Table 54: Global US EV Charging Systems Market Revenue Million Forecast, by Application Type 2019 & 2032
- Table 55: Global US EV Charging Systems Market Revenue Million Forecast, by Equipment Type 2019 & 2032
- Table 56: Global US EV Charging Systems Market Revenue Million Forecast, by Vehicle Type 2019 & 2032
- Table 57: Global US EV Charging Systems Market Revenue Million Forecast, by Charging System Type 2019 & 2032
- Table 58: Global US EV Charging Systems Market Revenue Million Forecast, by Country 2019 & 2032
- Table 59: China US EV Charging Systems Market Revenue (Million) Forecast, by Application 2019 & 2032
- Table 60: India US EV Charging Systems Market Revenue (Million) Forecast, by Application 2019 & 2032
- Table 61: Japan US EV Charging Systems Market Revenue (Million) Forecast, by Application 2019 & 2032
- Table 62: South Korea US EV Charging Systems Market Revenue (Million) Forecast, by Application 2019 & 2032
- Table 63: ASEAN US EV Charging Systems Market Revenue (Million) Forecast, by Application 2019 & 2032
- Table 64: Oceania US EV Charging Systems Market Revenue (Million) Forecast, by Application 2019 & 2032
- Table 65: Rest of Asia Pacific US EV Charging Systems Market Revenue (Million) Forecast, by Application 2019 & 2032
Frequently Asked Questions
1. What is the projected Compound Annual Growth Rate (CAGR) of the US EV Charging Systems Market?
The projected CAGR is approximately 27.65%.
2. Which companies are prominent players in the US EV Charging Systems Market?
Key companies in the market include Wallbo, ChargePoint Inc, Blink Charging Co, Leviton Manufacturing Co Inc, Webasto SE, Siemens AG, Schneider Electric SE, ABB Group, Tesla Inc, EVBox Group, EvoCharge Inc, Eaton Corporation.
3. What are the main segments of the US EV Charging Systems Market?
The market segments include Application Type, Equipment Type, Vehicle Type, Charging System Type.
4. Can you provide details about the market size?
The market size is estimated to be USD 3.88 Million as of 2022.
5. What are some drivers contributing to market growth?
Aggressive Government Focus to Promote the Adoption of Electric Vehicles Fosters the Growth of the Market.
6. What are the notable trends driving market growth?
Passengers Cars Segment to Gain Traction during the Forecast Period.
7. Are there any restraints impacting market growth?
High Cost of Setting Up EV Charging Stations Hampers the Growth of the Market.
8. Can you provide examples of recent developments in the market?
In March 2024, Wallbox announced the delivery of its smart chargers, Pulsar Pro North America, designed specifically for residential and commercial properties, which will be available to customers from the United States. Apart from the latest innovation, Wallbox also launched Supernova 180, its DC-fast EV charger, to assist in improving the state of the fast charging ecosystem in the United States.
9. What pricing options are available for accessing the report?
Pricing options include single-user, multi-user, and enterprise licenses priced at USD 3800, USD 4500, and USD 5800 respectively.
10. Is the market size provided in terms of value or volume?
The market size is provided in terms of value, measured in Million.
11. Are there any specific market keywords associated with the report?
Yes, the market keyword associated with the report is "US EV Charging Systems Market," which aids in identifying and referencing the specific market segment covered.
12. How do I determine which pricing option suits my needs best?
The pricing options vary based on user requirements and access needs. Individual users may opt for single-user licenses, while businesses requiring broader access may choose multi-user or enterprise licenses for cost-effective access to the report.
13. Are there any additional resources or data provided in the US EV Charging Systems Market report?
While the report offers comprehensive insights, it's advisable to review the specific contents or supplementary materials provided to ascertain if additional resources or data are available.
14. How can I stay updated on further developments or reports in the US EV Charging Systems Market?
To stay informed about further developments, trends, and reports in the US EV Charging Systems Market, consider subscribing to industry newsletters, following relevant companies and organizations, or regularly checking reputable industry news sources and publications.
Methodology
Step 1 - Identification of Relevant Samples Size from Population Database


Step 2 - Approaches for Defining Global Market Size (Value, Volume* & Price*)

Note*: In applicable scenarios
Step 3 - Data Sources
Primary Research
- Web Analytics
- Survey Reports
- Research Institute
- Latest Research Reports
- Opinion Leaders
Secondary Research
- Annual Reports
- White Paper
- Latest Press Release
- Industry Association
- Paid Database
- Investor Presentations

Step 4 - Data Triangulation
Involves using different sources of information in order to increase the validity of a study
These sources are likely to be stakeholders in a program - participants, other researchers, program staff, other community members, and so on.
Then we put all data in single framework & apply various statistical tools to find out the dynamic on the market.
During the analysis stage, feedback from the stakeholder groups would be compared to determine areas of agreement as well as areas of divergence
