

Key Insights
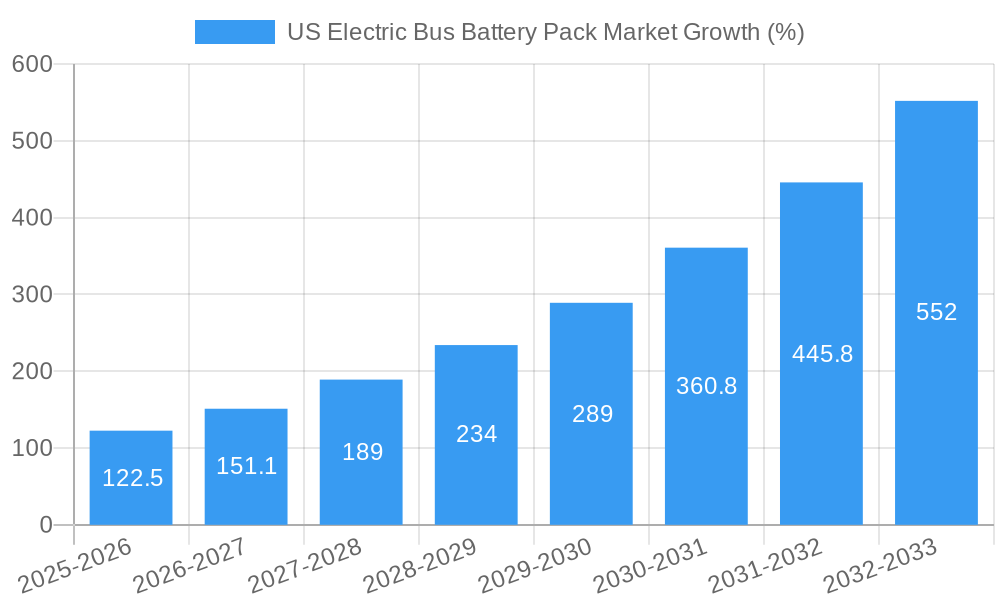
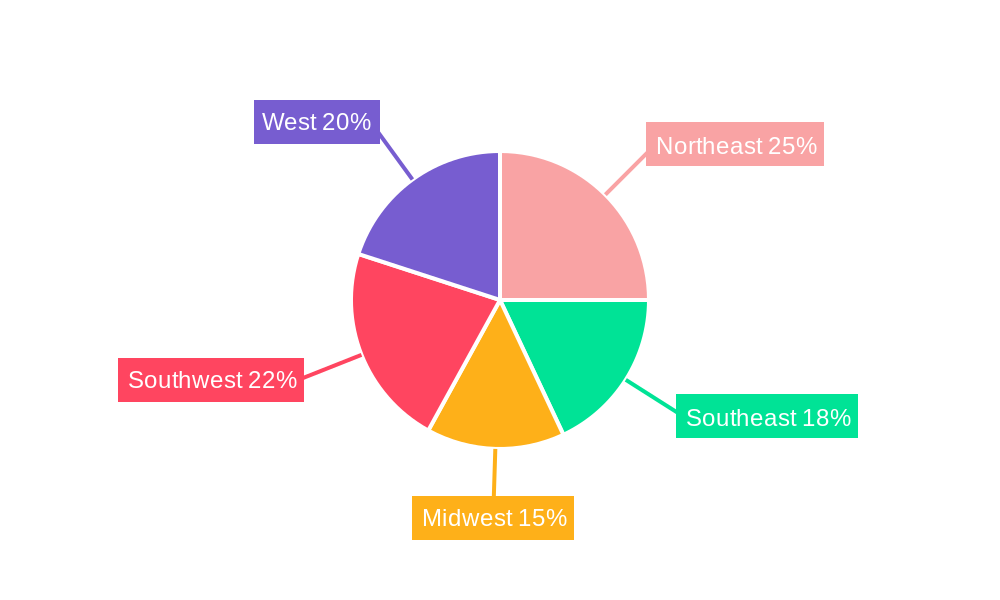
The US electric bus battery pack market is experiencing robust growth, driven by increasing government regulations promoting zero-emission transportation, expanding electric bus fleets in urban areas, and advancements in battery technology leading to improved energy density and lifespan. The market's 24.50% CAGR indicates a significant upward trajectory, projected to reach substantial value by 2033. Key market segments include cylindrical, pouch, and prismatic battery forms, with laser and wire connection methods prevalent. Material composition heavily features lithium, cobalt, manganese, nickel, and natural graphite, reflecting the current technological landscape. Battery chemistries like LFP, NCA, NMC, and NCM cater to diverse performance requirements, while capacity ranges from less than 15 kWh to over 80 kWh, accommodating varied bus sizes and operational needs. The market is segmented geographically across the US, with regions like the Northeast and West potentially showing higher adoption rates due to existing infrastructure and environmental policies. Major players like CATL, LG Energy Solution, BYD, and Samsung SDI are actively shaping the market landscape through innovation and competitive pricing.
This dynamic market is influenced by several factors. The rising cost of fossil fuels and the escalating concerns about air quality are pushing municipalities towards electrifying their public transportation systems. Technological advancements are constantly improving battery performance, extending range, and reducing charging times, making electric buses a more viable alternative. However, challenges remain, including the high initial cost of electric buses and battery packs, the limited availability of charging infrastructure in certain areas, and the need for efficient battery recycling programs to address environmental concerns. Furthermore, the market's dependence on critical raw materials like lithium and cobalt necessitates careful consideration of supply chain vulnerabilities and the exploration of alternative materials for sustainable growth. Future market development will likely hinge on addressing these challenges while capitalizing on the increasing demand for environmentally friendly public transportation.

US Electric Bus Battery Pack Market: A Comprehensive Report (2019-2033)
This insightful report provides a detailed analysis of the burgeoning US Electric Bus Battery Pack Market, offering a comprehensive overview of market trends, leading players, and future growth prospects. With a study period spanning 2019-2033, a base year of 2025, and a forecast period of 2025-2033, this report is an invaluable resource for stakeholders seeking to navigate this dynamic market. The market size is projected to reach xx Million by 2033, exhibiting a CAGR of xx% during the forecast period.
US Electric Bus Battery Pack Market Composition & Trends
The US electric bus battery pack market is experiencing significant growth fueled by government incentives, environmental concerns, and technological advancements. Market concentration is currently moderate, with key players such as BYD Company Ltd, Proterra Operating Company Inc, and LG Energy Solution Ltd holding substantial market share. However, the entry of new players and strategic alliances is increasing competition. Innovation is driven by advancements in battery chemistry (LFP, NMC, NCA), battery form factors (prismatic, cylindrical, pouch), and energy density. Stringent emission regulations are further accelerating market adoption. Substitute products, primarily diesel and compressed natural gas buses, are facing increasing pressure due to their higher operating costs and environmental impact. The end-user profile is predominantly comprised of public transportation authorities, private fleet operators, and school districts. Mergers and acquisitions (M&A) activity is expected to remain robust, with deal values potentially exceeding xx Million in the coming years.
- Market Share Distribution (2024): BYD: xx%; Proterra: xx%; LG Energy Solution: xx%; Others: xx%
- M&A Deal Value (2019-2024): xx Million
- Key Innovation Catalysts: Improved energy density, faster charging times, enhanced safety features, reduced costs.
- Regulatory Landscape: Increasingly stringent emission regulations at the federal and state levels.
US Electric Bus Battery Pack Market Industry Evolution
The US electric bus battery pack market has witnessed remarkable growth since 2019, driven by a confluence of factors including increasing electrification mandates, falling battery costs, and growing environmental awareness. Technological advancements, such as the development of higher energy density batteries and improved battery management systems, have significantly enhanced the performance and lifespan of electric buses. Consumer demand for cleaner, quieter, and more sustainable transportation options is also a key driver. The market growth trajectory is expected to remain upward, with a projected CAGR of xx% from 2025 to 2033. The adoption rate of electric buses is steadily increasing, with a projected xx% market penetration by 2033. Specific data points regarding growth rates and adoption metrics are detailed in the comprehensive report. This evolution is further shaped by the increasing focus on optimizing charging infrastructure and battery recycling programs. Furthermore, the transition towards solid-state batteries promises even greater advancements in the future, impacting various aspects, including range and lifespan.
Leading Regions, Countries, or Segments in US Electric Bus Battery Pack Market
The US electric bus battery pack market is geographically diverse, with significant growth observed across various regions. However, California, New York, and other states with aggressive emission reduction targets are leading the adoption curve. The prismatic battery form factor currently dominates the market due to its high energy density and cost-effectiveness. The wire method is widely used for battery pack assembly, while lithium and nickel are the primary materials. BEVs (Battery Electric Vehicles) constitute the largest share of the propulsion type segment. NMC and LFP chemistries are currently the most prevalent. The 40 kWh to 80 kWh capacity segment holds a significant share, catering to the majority of electric bus applications.
- Key Drivers:
- California's Zero-Emission Vehicle Mandate: Drives significant demand.
- Federal and State Incentives: Substantial financial support for electric bus adoption.
- Investment in Charging Infrastructure: Facilitates widespread deployment.
- Dominance Factors: Stringent emission regulations, supportive government policies, and the availability of charging infrastructure are key factors behind the strong performance of specific regions and segments.
US Electric Bus Battery Pack Market Product Innovations
Recent innovations include the development of solid-state batteries, which promise higher energy density, improved safety, and faster charging times. Advanced battery management systems (BMS) optimize battery performance and extend lifespan. The integration of telematics and data analytics provides valuable insights for fleet management and predictive maintenance. These advancements are leading to improved range, reduced operating costs, and increased overall efficiency of electric buses, resulting in a compelling value proposition for operators.
Propelling Factors for US Electric Bus Battery Pack Market Growth
Technological advancements in battery chemistry and design are key drivers, leading to increased energy density and reduced costs. Government regulations aimed at reducing emissions and promoting sustainable transportation are significantly boosting market demand. Economic incentives, such as tax credits and grants, are making electric buses more financially viable. Furthermore, the increasing awareness of environmental concerns among consumers and the transportation sector is further accelerating the adoption of electric buses.
Obstacles in the US Electric Bus Battery Pack Market
The high initial cost of electric buses and battery packs remains a significant barrier to wider adoption. Supply chain disruptions and the availability of critical raw materials, like lithium and cobalt, pose challenges. The development and deployment of adequate charging infrastructure require significant investment and planning. Competition from established players and the emergence of new technologies could further create competitive pressures impacting growth.
Future Opportunities in US Electric Bus Battery Pack Market
The integration of renewable energy sources for charging infrastructure presents significant opportunities. Advances in battery technology, such as solid-state batteries, are expected to further improve performance and reduce costs. The expansion of electric bus adoption into new markets, including smaller cities and rural areas, holds substantial growth potential. The development of innovative battery recycling programs to address sustainability concerns offers further market expansion prospects.
Major Players in the US Electric Bus Battery Pack Ecosystem
- Econtrols LLC
- Samsung SDI Co Ltd
- LG Energy Solution Ltd
- Imperium3 New York (IM3NY)
- XALT Energ
- TOSHIBA Corp
- Contemporary Amperex Technology Co Ltd (CATL)
- NFI Group Inc
- BYD Company Ltd
- SK Innovation Co Ltd
- Proterra Operating Company Inc
Key Developments in US Electric Bus Battery Pack Market Industry
- January 2023: Samsung SDI considers setting up another joint venture with a U.S. carmaker to expand its presence in the North American electric vehicle market. This signals a major investment in the region and increased competition.
- January 2023: Omega Seiki Mobility and IM3NY form a joint venture to bring US battery cell technology to India. This highlights the global reach of US battery technology.
- January 2023: Proterra produces its first Powered 1 EV battery at its new factory in South Carolina. This marks a significant milestone in domestic battery production and strengthens the US supply chain.
Strategic US Electric Bus Battery Pack Market Forecast
The US electric bus battery pack market is poised for sustained growth, driven by continued technological advancements, supportive government policies, and increasing environmental awareness. The forecast period will witness significant expansion, with a projected market size of xx Million by 2033, fuelled by the growing adoption of electric buses across various regions and segments. Further opportunities lie in the development of advanced battery technologies and the optimization of charging infrastructure.
US Electric Bus Battery Pack Market Segmentation
-
1. Propulsion Type
- 1.1. BEV
- 1.2. PHEV
-
2. Battery Chemistry
- 2.1. LFP
- 2.2. NCA
- 2.3. NCM
- 2.4. NMC
- 2.5. Others
-
3. Capacity
- 3.1. 15 kWh to 40 kWh
- 3.2. 40 kWh to 80 kWh
- 3.3. Above 80 kWh
- 3.4. Less than 15 kWh
-
4. Battery Form
- 4.1. Cylindrical
- 4.2. Pouch
- 4.3. Prismatic
-
5. Method
- 5.1. Laser
- 5.2. Wire
-
6. Component
- 6.1. Anode
- 6.2. Cathode
- 6.3. Electrolyte
- 6.4. Separator
-
7. Material Type
- 7.1. Cobalt
- 7.2. Lithium
- 7.3. Manganese
- 7.4. Natural Graphite
- 7.5. Nickel
- 7.6. Other Materials
US Electric Bus Battery Pack Market Segmentation By Geography
-
1. North America
- 1.1. United States
- 1.2. Canada
- 1.3. Mexico
-
2. South America
- 2.1. Brazil
- 2.2. Argentina
- 2.3. Rest of South America
-
3. Europe
- 3.1. United Kingdom
- 3.2. Germany
- 3.3. France
- 3.4. Italy
- 3.5. Spain
- 3.6. Russia
- 3.7. Benelux
- 3.8. Nordics
- 3.9. Rest of Europe
-
4. Middle East & Africa
- 4.1. Turkey
- 4.2. Israel
- 4.3. GCC
- 4.4. North Africa
- 4.5. South Africa
- 4.6. Rest of Middle East & Africa
-
5. Asia Pacific
- 5.1. China
- 5.2. India
- 5.3. Japan
- 5.4. South Korea
- 5.5. ASEAN
- 5.6. Oceania
- 5.7. Rest of Asia Pacific
US Electric Bus Battery Pack Market REPORT HIGHLIGHTS
| Aspects | Details |
|---|---|
| Study Period | 2019-2033 |
| Base Year | 2024 |
| Estimated Year | 2025 |
| Forecast Period | 2025-2033 |
| Historical Period | 2019-2024 |
| Growth Rate | CAGR of 24.50% from 2019-2033 |
| Segmentation |
|
Table of Contents
- 1. Introduction
- 1.1. Research Scope
- 1.2. Market Segmentation
- 1.3. Research Methodology
- 1.4. Definitions and Assumptions
- 2. Executive Summary
- 2.1. Introduction
- 3. Market Dynamics
- 3.1. Introduction
- 3.2. Market Drivers
- 3.2.1. Exponential Increase in Automotive Sector
- 3.3. Market Restrains
- 3.3.1. Digitization of R&D Operations in Automotive Sector
- 3.4. Market Trends
- 3.4.1. OTHER KEY INDUSTRY TRENDS COVERED IN THE REPORT
- 4. Market Factor Analysis
- 4.1. Porters Five Forces
- 4.2. Supply/Value Chain
- 4.3. PESTEL analysis
- 4.4. Market Entropy
- 4.5. Patent/Trademark Analysis
- 5. Global US Electric Bus Battery Pack Market Analysis, Insights and Forecast, 2019-2031
- 5.1. Market Analysis, Insights and Forecast - by Propulsion Type
- 5.1.1. BEV
- 5.1.2. PHEV
- 5.2. Market Analysis, Insights and Forecast - by Battery Chemistry
- 5.2.1. LFP
- 5.2.2. NCA
- 5.2.3. NCM
- 5.2.4. NMC
- 5.2.5. Others
- 5.3. Market Analysis, Insights and Forecast - by Capacity
- 5.3.1. 15 kWh to 40 kWh
- 5.3.2. 40 kWh to 80 kWh
- 5.3.3. Above 80 kWh
- 5.3.4. Less than 15 kWh
- 5.4. Market Analysis, Insights and Forecast - by Battery Form
- 5.4.1. Cylindrical
- 5.4.2. Pouch
- 5.4.3. Prismatic
- 5.5. Market Analysis, Insights and Forecast - by Method
- 5.5.1. Laser
- 5.5.2. Wire
- 5.6. Market Analysis, Insights and Forecast - by Component
- 5.6.1. Anode
- 5.6.2. Cathode
- 5.6.3. Electrolyte
- 5.6.4. Separator
- 5.7. Market Analysis, Insights and Forecast - by Material Type
- 5.7.1. Cobalt
- 5.7.2. Lithium
- 5.7.3. Manganese
- 5.7.4. Natural Graphite
- 5.7.5. Nickel
- 5.7.6. Other Materials
- 5.8. Market Analysis, Insights and Forecast - by Region
- 5.8.1. North America
- 5.8.2. South America
- 5.8.3. Europe
- 5.8.4. Middle East & Africa
- 5.8.5. Asia Pacific
- 5.1. Market Analysis, Insights and Forecast - by Propulsion Type
- 6. North America US Electric Bus Battery Pack Market Analysis, Insights and Forecast, 2019-2031
- 6.1. Market Analysis, Insights and Forecast - by Propulsion Type
- 6.1.1. BEV
- 6.1.2. PHEV
- 6.2. Market Analysis, Insights and Forecast - by Battery Chemistry
- 6.2.1. LFP
- 6.2.2. NCA
- 6.2.3. NCM
- 6.2.4. NMC
- 6.2.5. Others
- 6.3. Market Analysis, Insights and Forecast - by Capacity
- 6.3.1. 15 kWh to 40 kWh
- 6.3.2. 40 kWh to 80 kWh
- 6.3.3. Above 80 kWh
- 6.3.4. Less than 15 kWh
- 6.4. Market Analysis, Insights and Forecast - by Battery Form
- 6.4.1. Cylindrical
- 6.4.2. Pouch
- 6.4.3. Prismatic
- 6.5. Market Analysis, Insights and Forecast - by Method
- 6.5.1. Laser
- 6.5.2. Wire
- 6.6. Market Analysis, Insights and Forecast - by Component
- 6.6.1. Anode
- 6.6.2. Cathode
- 6.6.3. Electrolyte
- 6.6.4. Separator
- 6.7. Market Analysis, Insights and Forecast - by Material Type
- 6.7.1. Cobalt
- 6.7.2. Lithium
- 6.7.3. Manganese
- 6.7.4. Natural Graphite
- 6.7.5. Nickel
- 6.7.6. Other Materials
- 6.1. Market Analysis, Insights and Forecast - by Propulsion Type
- 7. South America US Electric Bus Battery Pack Market Analysis, Insights and Forecast, 2019-2031
- 7.1. Market Analysis, Insights and Forecast - by Propulsion Type
- 7.1.1. BEV
- 7.1.2. PHEV
- 7.2. Market Analysis, Insights and Forecast - by Battery Chemistry
- 7.2.1. LFP
- 7.2.2. NCA
- 7.2.3. NCM
- 7.2.4. NMC
- 7.2.5. Others
- 7.3. Market Analysis, Insights and Forecast - by Capacity
- 7.3.1. 15 kWh to 40 kWh
- 7.3.2. 40 kWh to 80 kWh
- 7.3.3. Above 80 kWh
- 7.3.4. Less than 15 kWh
- 7.4. Market Analysis, Insights and Forecast - by Battery Form
- 7.4.1. Cylindrical
- 7.4.2. Pouch
- 7.4.3. Prismatic
- 7.5. Market Analysis, Insights and Forecast - by Method
- 7.5.1. Laser
- 7.5.2. Wire
- 7.6. Market Analysis, Insights and Forecast - by Component
- 7.6.1. Anode
- 7.6.2. Cathode
- 7.6.3. Electrolyte
- 7.6.4. Separator
- 7.7. Market Analysis, Insights and Forecast - by Material Type
- 7.7.1. Cobalt
- 7.7.2. Lithium
- 7.7.3. Manganese
- 7.7.4. Natural Graphite
- 7.7.5. Nickel
- 7.7.6. Other Materials
- 7.1. Market Analysis, Insights and Forecast - by Propulsion Type
- 8. Europe US Electric Bus Battery Pack Market Analysis, Insights and Forecast, 2019-2031
- 8.1. Market Analysis, Insights and Forecast - by Propulsion Type
- 8.1.1. BEV
- 8.1.2. PHEV
- 8.2. Market Analysis, Insights and Forecast - by Battery Chemistry
- 8.2.1. LFP
- 8.2.2. NCA
- 8.2.3. NCM
- 8.2.4. NMC
- 8.2.5. Others
- 8.3. Market Analysis, Insights and Forecast - by Capacity
- 8.3.1. 15 kWh to 40 kWh
- 8.3.2. 40 kWh to 80 kWh
- 8.3.3. Above 80 kWh
- 8.3.4. Less than 15 kWh
- 8.4. Market Analysis, Insights and Forecast - by Battery Form
- 8.4.1. Cylindrical
- 8.4.2. Pouch
- 8.4.3. Prismatic
- 8.5. Market Analysis, Insights and Forecast - by Method
- 8.5.1. Laser
- 8.5.2. Wire
- 8.6. Market Analysis, Insights and Forecast - by Component
- 8.6.1. Anode
- 8.6.2. Cathode
- 8.6.3. Electrolyte
- 8.6.4. Separator
- 8.7. Market Analysis, Insights and Forecast - by Material Type
- 8.7.1. Cobalt
- 8.7.2. Lithium
- 8.7.3. Manganese
- 8.7.4. Natural Graphite
- 8.7.5. Nickel
- 8.7.6. Other Materials
- 8.1. Market Analysis, Insights and Forecast - by Propulsion Type
- 9. Middle East & Africa US Electric Bus Battery Pack Market Analysis, Insights and Forecast, 2019-2031
- 9.1. Market Analysis, Insights and Forecast - by Propulsion Type
- 9.1.1. BEV
- 9.1.2. PHEV
- 9.2. Market Analysis, Insights and Forecast - by Battery Chemistry
- 9.2.1. LFP
- 9.2.2. NCA
- 9.2.3. NCM
- 9.2.4. NMC
- 9.2.5. Others
- 9.3. Market Analysis, Insights and Forecast - by Capacity
- 9.3.1. 15 kWh to 40 kWh
- 9.3.2. 40 kWh to 80 kWh
- 9.3.3. Above 80 kWh
- 9.3.4. Less than 15 kWh
- 9.4. Market Analysis, Insights and Forecast - by Battery Form
- 9.4.1. Cylindrical
- 9.4.2. Pouch
- 9.4.3. Prismatic
- 9.5. Market Analysis, Insights and Forecast - by Method
- 9.5.1. Laser
- 9.5.2. Wire
- 9.6. Market Analysis, Insights and Forecast - by Component
- 9.6.1. Anode
- 9.6.2. Cathode
- 9.6.3. Electrolyte
- 9.6.4. Separator
- 9.7. Market Analysis, Insights and Forecast - by Material Type
- 9.7.1. Cobalt
- 9.7.2. Lithium
- 9.7.3. Manganese
- 9.7.4. Natural Graphite
- 9.7.5. Nickel
- 9.7.6. Other Materials
- 9.1. Market Analysis, Insights and Forecast - by Propulsion Type
- 10. Asia Pacific US Electric Bus Battery Pack Market Analysis, Insights and Forecast, 2019-2031
- 10.1. Market Analysis, Insights and Forecast - by Propulsion Type
- 10.1.1. BEV
- 10.1.2. PHEV
- 10.2. Market Analysis, Insights and Forecast - by Battery Chemistry
- 10.2.1. LFP
- 10.2.2. NCA
- 10.2.3. NCM
- 10.2.4. NMC
- 10.2.5. Others
- 10.3. Market Analysis, Insights and Forecast - by Capacity
- 10.3.1. 15 kWh to 40 kWh
- 10.3.2. 40 kWh to 80 kWh
- 10.3.3. Above 80 kWh
- 10.3.4. Less than 15 kWh
- 10.4. Market Analysis, Insights and Forecast - by Battery Form
- 10.4.1. Cylindrical
- 10.4.2. Pouch
- 10.4.3. Prismatic
- 10.5. Market Analysis, Insights and Forecast - by Method
- 10.5.1. Laser
- 10.5.2. Wire
- 10.6. Market Analysis, Insights and Forecast - by Component
- 10.6.1. Anode
- 10.6.2. Cathode
- 10.6.3. Electrolyte
- 10.6.4. Separator
- 10.7. Market Analysis, Insights and Forecast - by Material Type
- 10.7.1. Cobalt
- 10.7.2. Lithium
- 10.7.3. Manganese
- 10.7.4. Natural Graphite
- 10.7.5. Nickel
- 10.7.6. Other Materials
- 10.1. Market Analysis, Insights and Forecast - by Propulsion Type
- 11. Northeast US Electric Bus Battery Pack Market Analysis, Insights and Forecast, 2019-2031
- 12. Southeast US Electric Bus Battery Pack Market Analysis, Insights and Forecast, 2019-2031
- 13. Midwest US Electric Bus Battery Pack Market Analysis, Insights and Forecast, 2019-2031
- 14. Southwest US Electric Bus Battery Pack Market Analysis, Insights and Forecast, 2019-2031
- 15. West US Electric Bus Battery Pack Market Analysis, Insights and Forecast, 2019-2031
- 16. Competitive Analysis
- 16.1. Global Market Share Analysis 2024
- 16.2. Company Profiles
- 16.2.1 Econtrols LLC
- 16.2.1.1. Overview
- 16.2.1.2. Products
- 16.2.1.3. SWOT Analysis
- 16.2.1.4. Recent Developments
- 16.2.1.5. Financials (Based on Availability)
- 16.2.2 Samsung SDI Co Ltd
- 16.2.2.1. Overview
- 16.2.2.2. Products
- 16.2.2.3. SWOT Analysis
- 16.2.2.4. Recent Developments
- 16.2.2.5. Financials (Based on Availability)
- 16.2.3 LG Energy Solution Ltd
- 16.2.3.1. Overview
- 16.2.3.2. Products
- 16.2.3.3. SWOT Analysis
- 16.2.3.4. Recent Developments
- 16.2.3.5. Financials (Based on Availability)
- 16.2.4 Imperium3 New York (IM3NY)
- 16.2.4.1. Overview
- 16.2.4.2. Products
- 16.2.4.3. SWOT Analysis
- 16.2.4.4. Recent Developments
- 16.2.4.5. Financials (Based on Availability)
- 16.2.5 XALT Energ
- 16.2.5.1. Overview
- 16.2.5.2. Products
- 16.2.5.3. SWOT Analysis
- 16.2.5.4. Recent Developments
- 16.2.5.5. Financials (Based on Availability)
- 16.2.6 TOSHIBA Corp
- 16.2.6.1. Overview
- 16.2.6.2. Products
- 16.2.6.3. SWOT Analysis
- 16.2.6.4. Recent Developments
- 16.2.6.5. Financials (Based on Availability)
- 16.2.7 Contemporary Amperex Technology Co Ltd (CATL)
- 16.2.7.1. Overview
- 16.2.7.2. Products
- 16.2.7.3. SWOT Analysis
- 16.2.7.4. Recent Developments
- 16.2.7.5. Financials (Based on Availability)
- 16.2.8 NFI Group Inc
- 16.2.8.1. Overview
- 16.2.8.2. Products
- 16.2.8.3. SWOT Analysis
- 16.2.8.4. Recent Developments
- 16.2.8.5. Financials (Based on Availability)
- 16.2.9 BYD Company Ltd
- 16.2.9.1. Overview
- 16.2.9.2. Products
- 16.2.9.3. SWOT Analysis
- 16.2.9.4. Recent Developments
- 16.2.9.5. Financials (Based on Availability)
- 16.2.10 SK Innovation Co Ltd
- 16.2.10.1. Overview
- 16.2.10.2. Products
- 16.2.10.3. SWOT Analysis
- 16.2.10.4. Recent Developments
- 16.2.10.5. Financials (Based on Availability)
- 16.2.11 Proterra Operating Company Inc
- 16.2.11.1. Overview
- 16.2.11.2. Products
- 16.2.11.3. SWOT Analysis
- 16.2.11.4. Recent Developments
- 16.2.11.5. Financials (Based on Availability)
- 16.2.1 Econtrols LLC
List of Figures
- Figure 1: Global US Electric Bus Battery Pack Market Revenue Breakdown (Million, %) by Region 2024 & 2032
- Figure 2: United states US Electric Bus Battery Pack Market Revenue (Million), by Country 2024 & 2032
- Figure 3: United states US Electric Bus Battery Pack Market Revenue Share (%), by Country 2024 & 2032
- Figure 4: North America US Electric Bus Battery Pack Market Revenue (Million), by Propulsion Type 2024 & 2032
- Figure 5: North America US Electric Bus Battery Pack Market Revenue Share (%), by Propulsion Type 2024 & 2032
- Figure 6: North America US Electric Bus Battery Pack Market Revenue (Million), by Battery Chemistry 2024 & 2032
- Figure 7: North America US Electric Bus Battery Pack Market Revenue Share (%), by Battery Chemistry 2024 & 2032
- Figure 8: North America US Electric Bus Battery Pack Market Revenue (Million), by Capacity 2024 & 2032
- Figure 9: North America US Electric Bus Battery Pack Market Revenue Share (%), by Capacity 2024 & 2032
- Figure 10: North America US Electric Bus Battery Pack Market Revenue (Million), by Battery Form 2024 & 2032
- Figure 11: North America US Electric Bus Battery Pack Market Revenue Share (%), by Battery Form 2024 & 2032
- Figure 12: North America US Electric Bus Battery Pack Market Revenue (Million), by Method 2024 & 2032
- Figure 13: North America US Electric Bus Battery Pack Market Revenue Share (%), by Method 2024 & 2032
- Figure 14: North America US Electric Bus Battery Pack Market Revenue (Million), by Component 2024 & 2032
- Figure 15: North America US Electric Bus Battery Pack Market Revenue Share (%), by Component 2024 & 2032
- Figure 16: North America US Electric Bus Battery Pack Market Revenue (Million), by Material Type 2024 & 2032
- Figure 17: North America US Electric Bus Battery Pack Market Revenue Share (%), by Material Type 2024 & 2032
- Figure 18: North America US Electric Bus Battery Pack Market Revenue (Million), by Country 2024 & 2032
- Figure 19: North America US Electric Bus Battery Pack Market Revenue Share (%), by Country 2024 & 2032
- Figure 20: South America US Electric Bus Battery Pack Market Revenue (Million), by Propulsion Type 2024 & 2032
- Figure 21: South America US Electric Bus Battery Pack Market Revenue Share (%), by Propulsion Type 2024 & 2032
- Figure 22: South America US Electric Bus Battery Pack Market Revenue (Million), by Battery Chemistry 2024 & 2032
- Figure 23: South America US Electric Bus Battery Pack Market Revenue Share (%), by Battery Chemistry 2024 & 2032
- Figure 24: South America US Electric Bus Battery Pack Market Revenue (Million), by Capacity 2024 & 2032
- Figure 25: South America US Electric Bus Battery Pack Market Revenue Share (%), by Capacity 2024 & 2032
- Figure 26: South America US Electric Bus Battery Pack Market Revenue (Million), by Battery Form 2024 & 2032
- Figure 27: South America US Electric Bus Battery Pack Market Revenue Share (%), by Battery Form 2024 & 2032
- Figure 28: South America US Electric Bus Battery Pack Market Revenue (Million), by Method 2024 & 2032
- Figure 29: South America US Electric Bus Battery Pack Market Revenue Share (%), by Method 2024 & 2032
- Figure 30: South America US Electric Bus Battery Pack Market Revenue (Million), by Component 2024 & 2032
- Figure 31: South America US Electric Bus Battery Pack Market Revenue Share (%), by Component 2024 & 2032
- Figure 32: South America US Electric Bus Battery Pack Market Revenue (Million), by Material Type 2024 & 2032
- Figure 33: South America US Electric Bus Battery Pack Market Revenue Share (%), by Material Type 2024 & 2032
- Figure 34: South America US Electric Bus Battery Pack Market Revenue (Million), by Country 2024 & 2032
- Figure 35: South America US Electric Bus Battery Pack Market Revenue Share (%), by Country 2024 & 2032
- Figure 36: Europe US Electric Bus Battery Pack Market Revenue (Million), by Propulsion Type 2024 & 2032
- Figure 37: Europe US Electric Bus Battery Pack Market Revenue Share (%), by Propulsion Type 2024 & 2032
- Figure 38: Europe US Electric Bus Battery Pack Market Revenue (Million), by Battery Chemistry 2024 & 2032
- Figure 39: Europe US Electric Bus Battery Pack Market Revenue Share (%), by Battery Chemistry 2024 & 2032
- Figure 40: Europe US Electric Bus Battery Pack Market Revenue (Million), by Capacity 2024 & 2032
- Figure 41: Europe US Electric Bus Battery Pack Market Revenue Share (%), by Capacity 2024 & 2032
- Figure 42: Europe US Electric Bus Battery Pack Market Revenue (Million), by Battery Form 2024 & 2032
- Figure 43: Europe US Electric Bus Battery Pack Market Revenue Share (%), by Battery Form 2024 & 2032
- Figure 44: Europe US Electric Bus Battery Pack Market Revenue (Million), by Method 2024 & 2032
- Figure 45: Europe US Electric Bus Battery Pack Market Revenue Share (%), by Method 2024 & 2032
- Figure 46: Europe US Electric Bus Battery Pack Market Revenue (Million), by Component 2024 & 2032
- Figure 47: Europe US Electric Bus Battery Pack Market Revenue Share (%), by Component 2024 & 2032
- Figure 48: Europe US Electric Bus Battery Pack Market Revenue (Million), by Material Type 2024 & 2032
- Figure 49: Europe US Electric Bus Battery Pack Market Revenue Share (%), by Material Type 2024 & 2032
- Figure 50: Europe US Electric Bus Battery Pack Market Revenue (Million), by Country 2024 & 2032
- Figure 51: Europe US Electric Bus Battery Pack Market Revenue Share (%), by Country 2024 & 2032
- Figure 52: Middle East & Africa US Electric Bus Battery Pack Market Revenue (Million), by Propulsion Type 2024 & 2032
- Figure 53: Middle East & Africa US Electric Bus Battery Pack Market Revenue Share (%), by Propulsion Type 2024 & 2032
- Figure 54: Middle East & Africa US Electric Bus Battery Pack Market Revenue (Million), by Battery Chemistry 2024 & 2032
- Figure 55: Middle East & Africa US Electric Bus Battery Pack Market Revenue Share (%), by Battery Chemistry 2024 & 2032
- Figure 56: Middle East & Africa US Electric Bus Battery Pack Market Revenue (Million), by Capacity 2024 & 2032
- Figure 57: Middle East & Africa US Electric Bus Battery Pack Market Revenue Share (%), by Capacity 2024 & 2032
- Figure 58: Middle East & Africa US Electric Bus Battery Pack Market Revenue (Million), by Battery Form 2024 & 2032
- Figure 59: Middle East & Africa US Electric Bus Battery Pack Market Revenue Share (%), by Battery Form 2024 & 2032
- Figure 60: Middle East & Africa US Electric Bus Battery Pack Market Revenue (Million), by Method 2024 & 2032
- Figure 61: Middle East & Africa US Electric Bus Battery Pack Market Revenue Share (%), by Method 2024 & 2032
- Figure 62: Middle East & Africa US Electric Bus Battery Pack Market Revenue (Million), by Component 2024 & 2032
- Figure 63: Middle East & Africa US Electric Bus Battery Pack Market Revenue Share (%), by Component 2024 & 2032
- Figure 64: Middle East & Africa US Electric Bus Battery Pack Market Revenue (Million), by Material Type 2024 & 2032
- Figure 65: Middle East & Africa US Electric Bus Battery Pack Market Revenue Share (%), by Material Type 2024 & 2032
- Figure 66: Middle East & Africa US Electric Bus Battery Pack Market Revenue (Million), by Country 2024 & 2032
- Figure 67: Middle East & Africa US Electric Bus Battery Pack Market Revenue Share (%), by Country 2024 & 2032
- Figure 68: Asia Pacific US Electric Bus Battery Pack Market Revenue (Million), by Propulsion Type 2024 & 2032
- Figure 69: Asia Pacific US Electric Bus Battery Pack Market Revenue Share (%), by Propulsion Type 2024 & 2032
- Figure 70: Asia Pacific US Electric Bus Battery Pack Market Revenue (Million), by Battery Chemistry 2024 & 2032
- Figure 71: Asia Pacific US Electric Bus Battery Pack Market Revenue Share (%), by Battery Chemistry 2024 & 2032
- Figure 72: Asia Pacific US Electric Bus Battery Pack Market Revenue (Million), by Capacity 2024 & 2032
- Figure 73: Asia Pacific US Electric Bus Battery Pack Market Revenue Share (%), by Capacity 2024 & 2032
- Figure 74: Asia Pacific US Electric Bus Battery Pack Market Revenue (Million), by Battery Form 2024 & 2032
- Figure 75: Asia Pacific US Electric Bus Battery Pack Market Revenue Share (%), by Battery Form 2024 & 2032
- Figure 76: Asia Pacific US Electric Bus Battery Pack Market Revenue (Million), by Method 2024 & 2032
- Figure 77: Asia Pacific US Electric Bus Battery Pack Market Revenue Share (%), by Method 2024 & 2032
- Figure 78: Asia Pacific US Electric Bus Battery Pack Market Revenue (Million), by Component 2024 & 2032
- Figure 79: Asia Pacific US Electric Bus Battery Pack Market Revenue Share (%), by Component 2024 & 2032
- Figure 80: Asia Pacific US Electric Bus Battery Pack Market Revenue (Million), by Material Type 2024 & 2032
- Figure 81: Asia Pacific US Electric Bus Battery Pack Market Revenue Share (%), by Material Type 2024 & 2032
- Figure 82: Asia Pacific US Electric Bus Battery Pack Market Revenue (Million), by Country 2024 & 2032
- Figure 83: Asia Pacific US Electric Bus Battery Pack Market Revenue Share (%), by Country 2024 & 2032
List of Tables
- Table 1: Global US Electric Bus Battery Pack Market Revenue Million Forecast, by Region 2019 & 2032
- Table 2: Global US Electric Bus Battery Pack Market Revenue Million Forecast, by Propulsion Type 2019 & 2032
- Table 3: Global US Electric Bus Battery Pack Market Revenue Million Forecast, by Battery Chemistry 2019 & 2032
- Table 4: Global US Electric Bus Battery Pack Market Revenue Million Forecast, by Capacity 2019 & 2032
- Table 5: Global US Electric Bus Battery Pack Market Revenue Million Forecast, by Battery Form 2019 & 2032
- Table 6: Global US Electric Bus Battery Pack Market Revenue Million Forecast, by Method 2019 & 2032
- Table 7: Global US Electric Bus Battery Pack Market Revenue Million Forecast, by Component 2019 & 2032
- Table 8: Global US Electric Bus Battery Pack Market Revenue Million Forecast, by Material Type 2019 & 2032
- Table 9: Global US Electric Bus Battery Pack Market Revenue Million Forecast, by Region 2019 & 2032
- Table 10: Global US Electric Bus Battery Pack Market Revenue Million Forecast, by Country 2019 & 2032
- Table 11: Northeast US Electric Bus Battery Pack Market Revenue (Million) Forecast, by Application 2019 & 2032
- Table 12: Southeast US Electric Bus Battery Pack Market Revenue (Million) Forecast, by Application 2019 & 2032
- Table 13: Midwest US Electric Bus Battery Pack Market Revenue (Million) Forecast, by Application 2019 & 2032
- Table 14: Southwest US Electric Bus Battery Pack Market Revenue (Million) Forecast, by Application 2019 & 2032
- Table 15: West US Electric Bus Battery Pack Market Revenue (Million) Forecast, by Application 2019 & 2032
- Table 16: Global US Electric Bus Battery Pack Market Revenue Million Forecast, by Propulsion Type 2019 & 2032
- Table 17: Global US Electric Bus Battery Pack Market Revenue Million Forecast, by Battery Chemistry 2019 & 2032
- Table 18: Global US Electric Bus Battery Pack Market Revenue Million Forecast, by Capacity 2019 & 2032
- Table 19: Global US Electric Bus Battery Pack Market Revenue Million Forecast, by Battery Form 2019 & 2032
- Table 20: Global US Electric Bus Battery Pack Market Revenue Million Forecast, by Method 2019 & 2032
- Table 21: Global US Electric Bus Battery Pack Market Revenue Million Forecast, by Component 2019 & 2032
- Table 22: Global US Electric Bus Battery Pack Market Revenue Million Forecast, by Material Type 2019 & 2032
- Table 23: Global US Electric Bus Battery Pack Market Revenue Million Forecast, by Country 2019 & 2032
- Table 24: United States US Electric Bus Battery Pack Market Revenue (Million) Forecast, by Application 2019 & 2032
- Table 25: Canada US Electric Bus Battery Pack Market Revenue (Million) Forecast, by Application 2019 & 2032
- Table 26: Mexico US Electric Bus Battery Pack Market Revenue (Million) Forecast, by Application 2019 & 2032
- Table 27: Global US Electric Bus Battery Pack Market Revenue Million Forecast, by Propulsion Type 2019 & 2032
- Table 28: Global US Electric Bus Battery Pack Market Revenue Million Forecast, by Battery Chemistry 2019 & 2032
- Table 29: Global US Electric Bus Battery Pack Market Revenue Million Forecast, by Capacity 2019 & 2032
- Table 30: Global US Electric Bus Battery Pack Market Revenue Million Forecast, by Battery Form 2019 & 2032
- Table 31: Global US Electric Bus Battery Pack Market Revenue Million Forecast, by Method 2019 & 2032
- Table 32: Global US Electric Bus Battery Pack Market Revenue Million Forecast, by Component 2019 & 2032
- Table 33: Global US Electric Bus Battery Pack Market Revenue Million Forecast, by Material Type 2019 & 2032
- Table 34: Global US Electric Bus Battery Pack Market Revenue Million Forecast, by Country 2019 & 2032
- Table 35: Brazil US Electric Bus Battery Pack Market Revenue (Million) Forecast, by Application 2019 & 2032
- Table 36: Argentina US Electric Bus Battery Pack Market Revenue (Million) Forecast, by Application 2019 & 2032
- Table 37: Rest of South America US Electric Bus Battery Pack Market Revenue (Million) Forecast, by Application 2019 & 2032
- Table 38: Global US Electric Bus Battery Pack Market Revenue Million Forecast, by Propulsion Type 2019 & 2032
- Table 39: Global US Electric Bus Battery Pack Market Revenue Million Forecast, by Battery Chemistry 2019 & 2032
- Table 40: Global US Electric Bus Battery Pack Market Revenue Million Forecast, by Capacity 2019 & 2032
- Table 41: Global US Electric Bus Battery Pack Market Revenue Million Forecast, by Battery Form 2019 & 2032
- Table 42: Global US Electric Bus Battery Pack Market Revenue Million Forecast, by Method 2019 & 2032
- Table 43: Global US Electric Bus Battery Pack Market Revenue Million Forecast, by Component 2019 & 2032
- Table 44: Global US Electric Bus Battery Pack Market Revenue Million Forecast, by Material Type 2019 & 2032
- Table 45: Global US Electric Bus Battery Pack Market Revenue Million Forecast, by Country 2019 & 2032
- Table 46: United Kingdom US Electric Bus Battery Pack Market Revenue (Million) Forecast, by Application 2019 & 2032
- Table 47: Germany US Electric Bus Battery Pack Market Revenue (Million) Forecast, by Application 2019 & 2032
- Table 48: France US Electric Bus Battery Pack Market Revenue (Million) Forecast, by Application 2019 & 2032
- Table 49: Italy US Electric Bus Battery Pack Market Revenue (Million) Forecast, by Application 2019 & 2032
- Table 50: Spain US Electric Bus Battery Pack Market Revenue (Million) Forecast, by Application 2019 & 2032
- Table 51: Russia US Electric Bus Battery Pack Market Revenue (Million) Forecast, by Application 2019 & 2032
- Table 52: Benelux US Electric Bus Battery Pack Market Revenue (Million) Forecast, by Application 2019 & 2032
- Table 53: Nordics US Electric Bus Battery Pack Market Revenue (Million) Forecast, by Application 2019 & 2032
- Table 54: Rest of Europe US Electric Bus Battery Pack Market Revenue (Million) Forecast, by Application 2019 & 2032
- Table 55: Global US Electric Bus Battery Pack Market Revenue Million Forecast, by Propulsion Type 2019 & 2032
- Table 56: Global US Electric Bus Battery Pack Market Revenue Million Forecast, by Battery Chemistry 2019 & 2032
- Table 57: Global US Electric Bus Battery Pack Market Revenue Million Forecast, by Capacity 2019 & 2032
- Table 58: Global US Electric Bus Battery Pack Market Revenue Million Forecast, by Battery Form 2019 & 2032
- Table 59: Global US Electric Bus Battery Pack Market Revenue Million Forecast, by Method 2019 & 2032
- Table 60: Global US Electric Bus Battery Pack Market Revenue Million Forecast, by Component 2019 & 2032
- Table 61: Global US Electric Bus Battery Pack Market Revenue Million Forecast, by Material Type 2019 & 2032
- Table 62: Global US Electric Bus Battery Pack Market Revenue Million Forecast, by Country 2019 & 2032
- Table 63: Turkey US Electric Bus Battery Pack Market Revenue (Million) Forecast, by Application 2019 & 2032
- Table 64: Israel US Electric Bus Battery Pack Market Revenue (Million) Forecast, by Application 2019 & 2032
- Table 65: GCC US Electric Bus Battery Pack Market Revenue (Million) Forecast, by Application 2019 & 2032
- Table 66: North Africa US Electric Bus Battery Pack Market Revenue (Million) Forecast, by Application 2019 & 2032
- Table 67: South Africa US Electric Bus Battery Pack Market Revenue (Million) Forecast, by Application 2019 & 2032
- Table 68: Rest of Middle East & Africa US Electric Bus Battery Pack Market Revenue (Million) Forecast, by Application 2019 & 2032
- Table 69: Global US Electric Bus Battery Pack Market Revenue Million Forecast, by Propulsion Type 2019 & 2032
- Table 70: Global US Electric Bus Battery Pack Market Revenue Million Forecast, by Battery Chemistry 2019 & 2032
- Table 71: Global US Electric Bus Battery Pack Market Revenue Million Forecast, by Capacity 2019 & 2032
- Table 72: Global US Electric Bus Battery Pack Market Revenue Million Forecast, by Battery Form 2019 & 2032
- Table 73: Global US Electric Bus Battery Pack Market Revenue Million Forecast, by Method 2019 & 2032
- Table 74: Global US Electric Bus Battery Pack Market Revenue Million Forecast, by Component 2019 & 2032
- Table 75: Global US Electric Bus Battery Pack Market Revenue Million Forecast, by Material Type 2019 & 2032
- Table 76: Global US Electric Bus Battery Pack Market Revenue Million Forecast, by Country 2019 & 2032
- Table 77: China US Electric Bus Battery Pack Market Revenue (Million) Forecast, by Application 2019 & 2032
- Table 78: India US Electric Bus Battery Pack Market Revenue (Million) Forecast, by Application 2019 & 2032
- Table 79: Japan US Electric Bus Battery Pack Market Revenue (Million) Forecast, by Application 2019 & 2032
- Table 80: South Korea US Electric Bus Battery Pack Market Revenue (Million) Forecast, by Application 2019 & 2032
- Table 81: ASEAN US Electric Bus Battery Pack Market Revenue (Million) Forecast, by Application 2019 & 2032
- Table 82: Oceania US Electric Bus Battery Pack Market Revenue (Million) Forecast, by Application 2019 & 2032
- Table 83: Rest of Asia Pacific US Electric Bus Battery Pack Market Revenue (Million) Forecast, by Application 2019 & 2032
Frequently Asked Questions
1. What is the projected Compound Annual Growth Rate (CAGR) of the US Electric Bus Battery Pack Market?
The projected CAGR is approximately 24.50%.
2. Which companies are prominent players in the US Electric Bus Battery Pack Market?
Key companies in the market include Econtrols LLC, Samsung SDI Co Ltd, LG Energy Solution Ltd, Imperium3 New York (IM3NY), XALT Energ, TOSHIBA Corp, Contemporary Amperex Technology Co Ltd (CATL), NFI Group Inc, BYD Company Ltd, SK Innovation Co Ltd, Proterra Operating Company Inc.
3. What are the main segments of the US Electric Bus Battery Pack Market?
The market segments include Propulsion Type, Battery Chemistry, Capacity, Battery Form, Method, Component, Material Type.
4. Can you provide details about the market size?
The market size is estimated to be USD XX Million as of 2022.
5. What are some drivers contributing to market growth?
Exponential Increase in Automotive Sector.
6. What are the notable trends driving market growth?
OTHER KEY INDUSTRY TRENDS COVERED IN THE REPORT.
7. Are there any restraints impacting market growth?
Digitization of R&D Operations in Automotive Sector.
8. Can you provide examples of recent developments in the market?
January 2023: Samsung SDI is considering setting up another joint venture with a U.S. carmaker to expand its presence in the rapidly growing North American electric vehicle market.January 2023: Omega Seiki Mobility and iM3NY have formed a joint venture to bring US battery cell technology to India.January 2023: Proterra Powered EV battery was manufactured at the company's new Powered 1 battery production factory in Greer, South Carolina, marking the first one produced at the factory.
9. What pricing options are available for accessing the report?
Pricing options include single-user, multi-user, and enterprise licenses priced at USD 3800, USD 4500, and USD 5800 respectively.
10. Is the market size provided in terms of value or volume?
The market size is provided in terms of value, measured in Million.
11. Are there any specific market keywords associated with the report?
Yes, the market keyword associated with the report is "US Electric Bus Battery Pack Market," which aids in identifying and referencing the specific market segment covered.
12. How do I determine which pricing option suits my needs best?
The pricing options vary based on user requirements and access needs. Individual users may opt for single-user licenses, while businesses requiring broader access may choose multi-user or enterprise licenses for cost-effective access to the report.
13. Are there any additional resources or data provided in the US Electric Bus Battery Pack Market report?
While the report offers comprehensive insights, it's advisable to review the specific contents or supplementary materials provided to ascertain if additional resources or data are available.
14. How can I stay updated on further developments or reports in the US Electric Bus Battery Pack Market?
To stay informed about further developments, trends, and reports in the US Electric Bus Battery Pack Market, consider subscribing to industry newsletters, following relevant companies and organizations, or regularly checking reputable industry news sources and publications.
Methodology
Step 1 - Identification of Relevant Samples Size from Population Database


Step 2 - Approaches for Defining Global Market Size (Value, Volume* & Price*)

Note*: In applicable scenarios
Step 3 - Data Sources
Primary Research
- Web Analytics
- Survey Reports
- Research Institute
- Latest Research Reports
- Opinion Leaders
Secondary Research
- Annual Reports
- White Paper
- Latest Press Release
- Industry Association
- Paid Database
- Investor Presentations

Step 4 - Data Triangulation
Involves using different sources of information in order to increase the validity of a study
These sources are likely to be stakeholders in a program - participants, other researchers, program staff, other community members, and so on.
Then we put all data in single framework & apply various statistical tools to find out the dynamic on the market.
During the analysis stage, feedback from the stakeholder groups would be compared to determine areas of agreement as well as areas of divergence
