

Key Insights
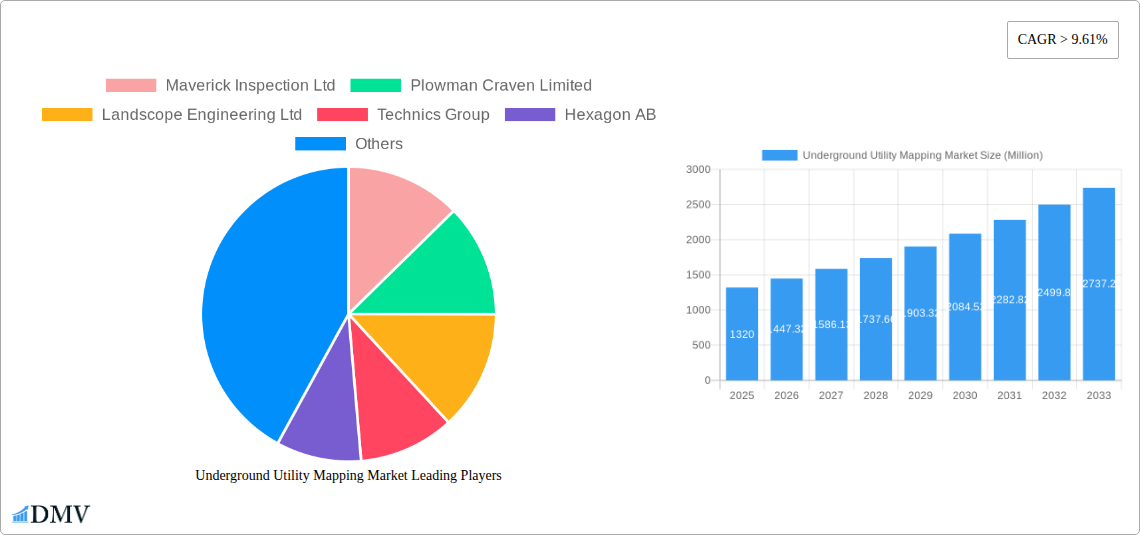
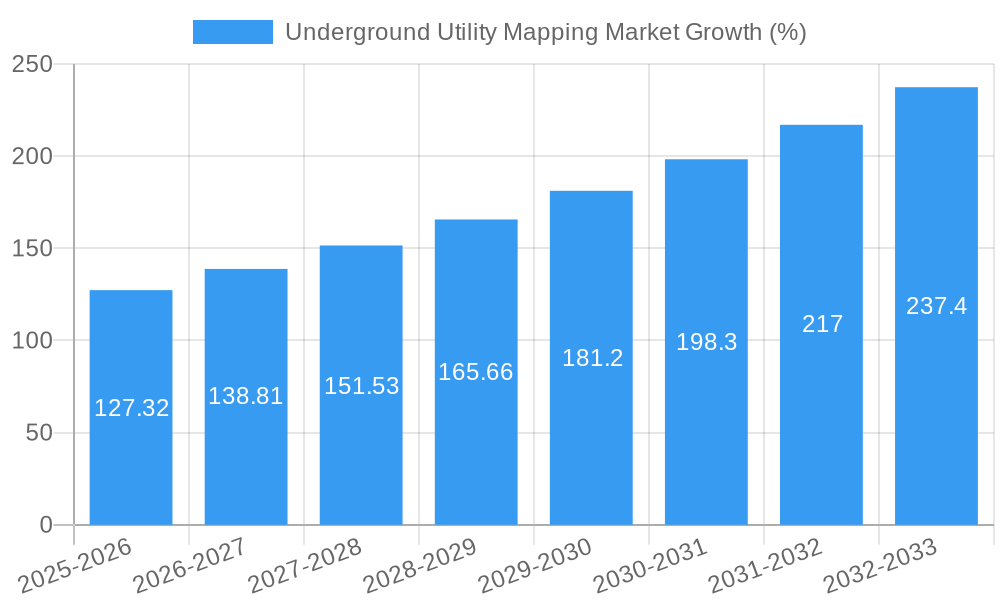
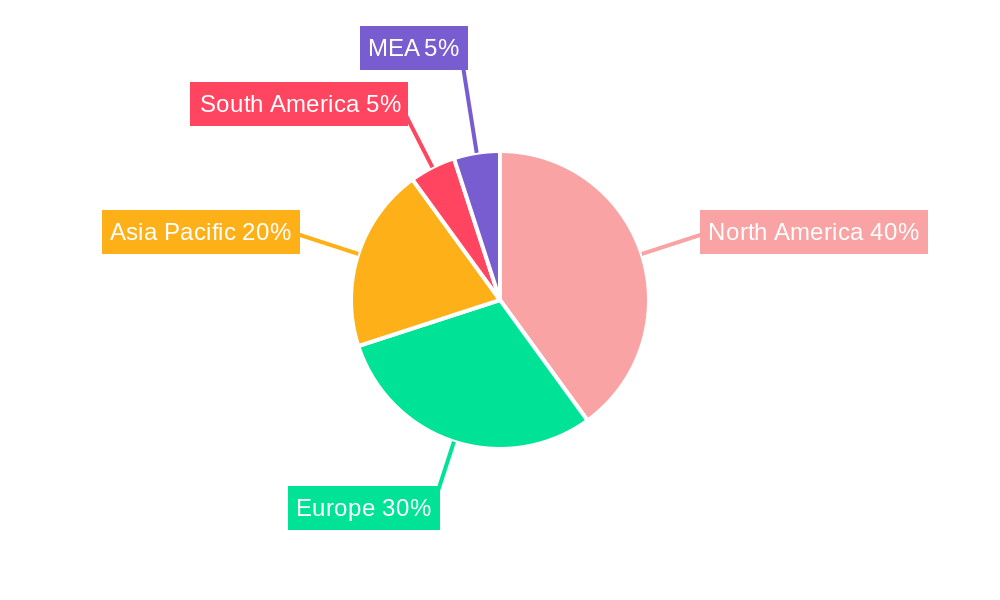
The Underground Utility Mapping market is experiencing robust growth, projected to reach a market size of $1.32 billion in 2025 and maintain a Compound Annual Growth Rate (CAGR) exceeding 9.61% from 2025 to 2033. This expansion is fueled by several key factors. Increasing urbanization and infrastructure development necessitate accurate and detailed mapping of underground utilities to prevent costly damages during excavation projects. Furthermore, stringent government regulations concerning utility safety and the rising adoption of advanced technologies like LiDAR, ground-penetrating radar (GPR), and GIS software are driving market growth. The demand for efficient and reliable utility mapping solutions is particularly high in sectors like public safety, oil and gas, building and construction, and telecommunications, where precise location data is crucial for operational efficiency and risk mitigation. The market is segmented by component type (solutions and services) and end-user industry, with solutions comprising a significant portion. North America currently holds a substantial market share, but the Asia-Pacific region is poised for rapid growth driven by significant infrastructure investment. Competitive dynamics are shaped by a blend of established players like Hexagon AB and emerging technology providers offering innovative mapping solutions.
The market’s growth trajectory is expected to remain positive throughout the forecast period, driven by continuous technological advancements and a rising focus on sustainable infrastructure development. While potential restraints like high initial investment costs for advanced technologies and the need for skilled professionals to operate sophisticated equipment exist, the overall market outlook remains optimistic. The increasing integration of AI and machine learning in utility mapping solutions is anticipated to improve accuracy, efficiency, and data analysis capabilities, further boosting market adoption. The expansion of smart city initiatives globally is also expected to fuel market expansion by increasing the demand for detailed and updated utility maps. Continuous innovation in data acquisition and processing techniques is expected to reshape the competitive landscape and provide opportunities for both established players and new entrants.
Underground Utility Mapping Market: A Comprehensive Report (2019-2033)
This insightful report provides a detailed analysis of the Underground Utility Mapping Market, encompassing market size, growth trends, competitive landscape, and future opportunities. Covering the period from 2019 to 2033, with a base year of 2025, this report offers invaluable insights for stakeholders seeking to understand and capitalize on this rapidly evolving market. The global market is projected to reach xx Million by 2033, showcasing significant growth potential.
Underground Utility Mapping Market Market Composition & Trends
The Underground Utility Mapping Market is characterized by a moderately concentrated landscape with key players vying for market share. Market concentration is influenced by technological advancements, regulatory compliance requirements, and the increasing demand for efficient utility management. Innovation in technologies like AI, machine learning, and advanced sensor systems are driving market growth. Stringent regulations concerning excavation safety are fostering demand for accurate utility mapping solutions. Substitute products, while existing, often lack the precision and comprehensive data offered by advanced utility mapping technologies. The end-user profile is diverse, encompassing public safety, oil & gas, building & construction, telecommunication, and electricity sectors.
- Market Share Distribution: Hexagon AB and Vivax-Metrotech Corp hold a significant share, estimated at xx% and xx% respectively in 2025. Other major players like GSSI Geophysical Survey Systems Inc and Maverick Inspection Ltd share the remaining market.
- M&A Activities: The past five years have witnessed a moderate level of M&A activity, with deal values averaging around xx Million per transaction. These activities are driven by the need to expand geographical reach and technological capabilities.
Underground Utility Mapping Market Industry Evolution
The Underground Utility Mapping Market has experienced substantial growth over the historical period (2019-2024), driven primarily by increased urbanization, infrastructure development, and growing awareness of excavation safety. The market is poised for continued growth, with a projected Compound Annual Growth Rate (CAGR) of xx% during the forecast period (2025-2033). Technological advancements, such as the integration of AI and machine learning algorithms, are enhancing the accuracy and efficiency of mapping processes. This leads to higher adoption rates across various end-user industries. The shift towards digitalization and the demand for real-time data access are further bolstering market expansion. Consumer demand is increasingly focused on solutions offering comprehensive data visualization, integration capabilities with existing systems, and reduced project completion times.
Leading Regions, Countries, or Segments in Underground Utility Mapping Market
North America currently dominates the Underground Utility Mapping Market, driven by substantial investments in infrastructure projects and stringent safety regulations. Europe and Asia-Pacific are also showing promising growth potential.
By Component Type:
- Solutions: This segment holds the largest market share due to the high demand for comprehensive and accurate underground utility mapping solutions.
- Services: This segment is experiencing steady growth, driven by the need for expertise in data interpretation and project management.
By End-user Industry:
- Building and Construction: This segment is a significant contributor to market growth due to the increasing number of construction projects globally and the need to avoid damaging underground utilities.
- Public Safety: Growing concerns over public safety during excavation works are driving the adoption of advanced mapping solutions within this sector.
- Oil and Gas: The sector’s stringent safety protocols and the necessity for accurate mapping of pipelines are key growth drivers.
Key Drivers:
- Government Regulations: Stringent regulations mandating accurate utility mapping before excavation are a significant growth driver.
- Investment in Infrastructure: Large-scale infrastructure projects across various regions fuel the demand for advanced mapping technologies.
- Technological Advancements: The integration of AI, machine learning, and advanced sensor technologies is enhancing the efficiency and accuracy of utility mapping.
Underground Utility Mapping Market Product Innovations
Recent product innovations focus on integrating AI-powered image analysis and machine learning for improved accuracy, automated data processing, and real-time data visualization. These advancements significantly enhance the speed and efficiency of underground utility mapping, leading to reduced project costs and improved safety. Unique selling propositions include integrated data management platforms, seamless integration with GIS systems, and enhanced data visualization capabilities.
Propelling Factors for Underground Utility Mapping Market Growth
The market's growth is propelled by several factors, including increasing urbanization, stringent safety regulations related to underground utility damage, rising infrastructure development spending, and the growing adoption of advanced technologies like LiDAR, GPR, and AI. The need for efficient resource management and reduced project delays also contributes to market growth. Government initiatives promoting safe excavation practices further enhance market expansion.
Obstacles in the Underground Utility Mapping Market Market
Challenges include the high initial investment costs associated with advanced technologies, the complexity of integrating various data sources, and the potential for inaccuracies due to outdated or incomplete utility data. Supply chain disruptions and competition from established players also pose significant obstacles. The lack of standardized data formats and protocols across different regions can create integration complexities and hinder market growth.
Future Opportunities in Underground Utility Mapping Market
Future opportunities lie in the expansion into emerging markets, the development of integrated solutions combining various mapping technologies, and the incorporation of advanced analytics capabilities for predictive maintenance and risk assessment. The increasing focus on sustainability and the need for efficient infrastructure management will further drive market expansion. The integration of drone technology and IoT devices for real-time monitoring holds considerable potential.
Major Players in the Underground Utility Mapping Market Ecosystem
- Maverick Inspection Ltd
- Plowman Craven Limited
- Landscope Engineering Ltd
- Technics Group
- Hexagon AB
- Red Laser Scanning
- Vivax-Metrotech Corp
- GSSI Geophysical Survey Systems Inc
- multiVIEW Locates Inc
- Geospatial Corporation
Key Developments in Underground Utility Mapping Market Industry
- March 2024: WSB LLC partnered with 4M Analytics to leverage AI for improved data integrity and real-time digital delivery of utility mapping data for infrastructure projects. This partnership significantly improves data accuracy and accessibility.
- February 2024: Exodigo announced its participation in the GOPHURRS program, providing accurate subsurface maps for power line undergrounding. This initiative demonstrates the growing importance of accurate mapping in large-scale infrastructure projects.
Strategic Underground Utility Mapping Market Market Forecast
The Underground Utility Mapping Market is poised for significant growth driven by increasing urbanization, infrastructure investments, stringent safety regulations, and technological advancements. The integration of AI and machine learning will continue to improve accuracy and efficiency, while new applications in emerging markets will further expand market potential. The market's future growth trajectory is strongly positive, promising substantial opportunities for market players.
Underground Utility Mapping Market Segmentation
-
1. Component Type
-
1.1. Solutions
- 1.1.1. Ground Penetrating Radar
- 1.1.2. Electromagnetic Locators
- 1.1.3. Other Solutions
- 1.2. Services
-
1.1. Solutions
-
2. End-user Industry
- 2.1. Public Safety
- 2.2. Oil and Gas
- 2.3. Building and Construction
- 2.4. Telecommunication
- 2.5. Electricity
- 2.6. Other End-user Industries
Underground Utility Mapping Market Segmentation By Geography
- 1. North America
- 2. Europe
- 3. Asia
- 4. Australia and New Zealand
- 5. Latin America
- 6. Middle East and Africa
Underground Utility Mapping Market REPORT HIGHLIGHTS
| Aspects | Details |
|---|---|
| Study Period | 2019-2033 |
| Base Year | 2024 |
| Estimated Year | 2025 |
| Forecast Period | 2025-2033 |
| Historical Period | 2019-2024 |
| Growth Rate | CAGR of > 9.61% from 2019-2033 |
| Segmentation |
|
Table of Contents
- 1. Introduction
- 1.1. Research Scope
- 1.2. Market Segmentation
- 1.3. Research Methodology
- 1.4. Definitions and Assumptions
- 2. Executive Summary
- 2.1. Introduction
- 3. Market Dynamics
- 3.1. Introduction
- 3.2. Market Drivers
- 3.2.1. Emerging Technologies Combined With Utility Maps to Improve the Exploration Activities; Increasing Availability of Detecting Applications and Increased Return on Marketing Spending
- 3.3. Market Restrains
- 3.3.1. High Initial Investment Cost To Hinder Market Growth
- 3.4. Market Trends
- 3.4.1. Ground Penetrating Radar is Expected to be the Largest Component Type Solution
- 4. Market Factor Analysis
- 4.1. Porters Five Forces
- 4.2. Supply/Value Chain
- 4.3. PESTEL analysis
- 4.4. Market Entropy
- 4.5. Patent/Trademark Analysis
- 5. Global Underground Utility Mapping Market Analysis, Insights and Forecast, 2019-2031
- 5.1. Market Analysis, Insights and Forecast - by Component Type
- 5.1.1. Solutions
- 5.1.1.1. Ground Penetrating Radar
- 5.1.1.2. Electromagnetic Locators
- 5.1.1.3. Other Solutions
- 5.1.2. Services
- 5.1.1. Solutions
- 5.2. Market Analysis, Insights and Forecast - by End-user Industry
- 5.2.1. Public Safety
- 5.2.2. Oil and Gas
- 5.2.3. Building and Construction
- 5.2.4. Telecommunication
- 5.2.5. Electricity
- 5.2.6. Other End-user Industries
- 5.3. Market Analysis, Insights and Forecast - by Region
- 5.3.1. North America
- 5.3.2. Europe
- 5.3.3. Asia
- 5.3.4. Australia and New Zealand
- 5.3.5. Latin America
- 5.3.6. Middle East and Africa
- 5.1. Market Analysis, Insights and Forecast - by Component Type
- 6. North America Underground Utility Mapping Market Analysis, Insights and Forecast, 2019-2031
- 6.1. Market Analysis, Insights and Forecast - by Component Type
- 6.1.1. Solutions
- 6.1.1.1. Ground Penetrating Radar
- 6.1.1.2. Electromagnetic Locators
- 6.1.1.3. Other Solutions
- 6.1.2. Services
- 6.1.1. Solutions
- 6.2. Market Analysis, Insights and Forecast - by End-user Industry
- 6.2.1. Public Safety
- 6.2.2. Oil and Gas
- 6.2.3. Building and Construction
- 6.2.4. Telecommunication
- 6.2.5. Electricity
- 6.2.6. Other End-user Industries
- 6.1. Market Analysis, Insights and Forecast - by Component Type
- 7. Europe Underground Utility Mapping Market Analysis, Insights and Forecast, 2019-2031
- 7.1. Market Analysis, Insights and Forecast - by Component Type
- 7.1.1. Solutions
- 7.1.1.1. Ground Penetrating Radar
- 7.1.1.2. Electromagnetic Locators
- 7.1.1.3. Other Solutions
- 7.1.2. Services
- 7.1.1. Solutions
- 7.2. Market Analysis, Insights and Forecast - by End-user Industry
- 7.2.1. Public Safety
- 7.2.2. Oil and Gas
- 7.2.3. Building and Construction
- 7.2.4. Telecommunication
- 7.2.5. Electricity
- 7.2.6. Other End-user Industries
- 7.1. Market Analysis, Insights and Forecast - by Component Type
- 8. Asia Underground Utility Mapping Market Analysis, Insights and Forecast, 2019-2031
- 8.1. Market Analysis, Insights and Forecast - by Component Type
- 8.1.1. Solutions
- 8.1.1.1. Ground Penetrating Radar
- 8.1.1.2. Electromagnetic Locators
- 8.1.1.3. Other Solutions
- 8.1.2. Services
- 8.1.1. Solutions
- 8.2. Market Analysis, Insights and Forecast - by End-user Industry
- 8.2.1. Public Safety
- 8.2.2. Oil and Gas
- 8.2.3. Building and Construction
- 8.2.4. Telecommunication
- 8.2.5. Electricity
- 8.2.6. Other End-user Industries
- 8.1. Market Analysis, Insights and Forecast - by Component Type
- 9. Australia and New Zealand Underground Utility Mapping Market Analysis, Insights and Forecast, 2019-2031
- 9.1. Market Analysis, Insights and Forecast - by Component Type
- 9.1.1. Solutions
- 9.1.1.1. Ground Penetrating Radar
- 9.1.1.2. Electromagnetic Locators
- 9.1.1.3. Other Solutions
- 9.1.2. Services
- 9.1.1. Solutions
- 9.2. Market Analysis, Insights and Forecast - by End-user Industry
- 9.2.1. Public Safety
- 9.2.2. Oil and Gas
- 9.2.3. Building and Construction
- 9.2.4. Telecommunication
- 9.2.5. Electricity
- 9.2.6. Other End-user Industries
- 9.1. Market Analysis, Insights and Forecast - by Component Type
- 10. Latin America Underground Utility Mapping Market Analysis, Insights and Forecast, 2019-2031
- 10.1. Market Analysis, Insights and Forecast - by Component Type
- 10.1.1. Solutions
- 10.1.1.1. Ground Penetrating Radar
- 10.1.1.2. Electromagnetic Locators
- 10.1.1.3. Other Solutions
- 10.1.2. Services
- 10.1.1. Solutions
- 10.2. Market Analysis, Insights and Forecast - by End-user Industry
- 10.2.1. Public Safety
- 10.2.2. Oil and Gas
- 10.2.3. Building and Construction
- 10.2.4. Telecommunication
- 10.2.5. Electricity
- 10.2.6. Other End-user Industries
- 10.1. Market Analysis, Insights and Forecast - by Component Type
- 11. Middle East and Africa Underground Utility Mapping Market Analysis, Insights and Forecast, 2019-2031
- 11.1. Market Analysis, Insights and Forecast - by Component Type
- 11.1.1. Solutions
- 11.1.1.1. Ground Penetrating Radar
- 11.1.1.2. Electromagnetic Locators
- 11.1.1.3. Other Solutions
- 11.1.2. Services
- 11.1.1. Solutions
- 11.2. Market Analysis, Insights and Forecast - by End-user Industry
- 11.2.1. Public Safety
- 11.2.2. Oil and Gas
- 11.2.3. Building and Construction
- 11.2.4. Telecommunication
- 11.2.5. Electricity
- 11.2.6. Other End-user Industries
- 11.1. Market Analysis, Insights and Forecast - by Component Type
- 12. North America Underground Utility Mapping Market Analysis, Insights and Forecast, 2019-2031
- 12.1. Market Analysis, Insights and Forecast - By Country/Sub-region
- 12.1.1 United States
- 12.1.2 Canada
- 12.1.3 Mexico
- 13. Europe Underground Utility Mapping Market Analysis, Insights and Forecast, 2019-2031
- 13.1. Market Analysis, Insights and Forecast - By Country/Sub-region
- 13.1.1 Germany
- 13.1.2 United Kingdom
- 13.1.3 France
- 13.1.4 Spain
- 13.1.5 Italy
- 13.1.6 Spain
- 13.1.7 Belgium
- 13.1.8 Netherland
- 13.1.9 Nordics
- 13.1.10 Rest of Europe
- 14. Asia Pacific Underground Utility Mapping Market Analysis, Insights and Forecast, 2019-2031
- 14.1. Market Analysis, Insights and Forecast - By Country/Sub-region
- 14.1.1 China
- 14.1.2 Japan
- 14.1.3 India
- 14.1.4 South Korea
- 14.1.5 Southeast Asia
- 14.1.6 Australia
- 14.1.7 Indonesia
- 14.1.8 Phillipes
- 14.1.9 Singapore
- 14.1.10 Thailandc
- 14.1.11 Rest of Asia Pacific
- 15. South America Underground Utility Mapping Market Analysis, Insights and Forecast, 2019-2031
- 15.1. Market Analysis, Insights and Forecast - By Country/Sub-region
- 15.1.1 Brazil
- 15.1.2 Argentina
- 15.1.3 Peru
- 15.1.4 Chile
- 15.1.5 Colombia
- 15.1.6 Ecuador
- 15.1.7 Venezuela
- 15.1.8 Rest of South America
- 16. North America Underground Utility Mapping Market Analysis, Insights and Forecast, 2019-2031
- 16.1. Market Analysis, Insights and Forecast - By Country/Sub-region
- 16.1.1 United States
- 16.1.2 Canada
- 16.1.3 Mexico
- 17. MEA Underground Utility Mapping Market Analysis, Insights and Forecast, 2019-2031
- 17.1. Market Analysis, Insights and Forecast - By Country/Sub-region
- 17.1.1 United Arab Emirates
- 17.1.2 Saudi Arabia
- 17.1.3 South Africa
- 17.1.4 Rest of Middle East and Africa
- 18. Competitive Analysis
- 18.1. Global Market Share Analysis 2024
- 18.2. Company Profiles
- 18.2.1 Maverick Inspection Ltd
- 18.2.1.1. Overview
- 18.2.1.2. Products
- 18.2.1.3. SWOT Analysis
- 18.2.1.4. Recent Developments
- 18.2.1.5. Financials (Based on Availability)
- 18.2.2 Plowman Craven Limited
- 18.2.2.1. Overview
- 18.2.2.2. Products
- 18.2.2.3. SWOT Analysis
- 18.2.2.4. Recent Developments
- 18.2.2.5. Financials (Based on Availability)
- 18.2.3 Landscope Engineering Ltd
- 18.2.3.1. Overview
- 18.2.3.2. Products
- 18.2.3.3. SWOT Analysis
- 18.2.3.4. Recent Developments
- 18.2.3.5. Financials (Based on Availability)
- 18.2.4 Technics Group
- 18.2.4.1. Overview
- 18.2.4.2. Products
- 18.2.4.3. SWOT Analysis
- 18.2.4.4. Recent Developments
- 18.2.4.5. Financials (Based on Availability)
- 18.2.5 Hexagon AB
- 18.2.5.1. Overview
- 18.2.5.2. Products
- 18.2.5.3. SWOT Analysis
- 18.2.5.4. Recent Developments
- 18.2.5.5. Financials (Based on Availability)
- 18.2.6 Red Laser Scanning
- 18.2.6.1. Overview
- 18.2.6.2. Products
- 18.2.6.3. SWOT Analysis
- 18.2.6.4. Recent Developments
- 18.2.6.5. Financials (Based on Availability)
- 18.2.7 Vivax-Metrotech Corp
- 18.2.7.1. Overview
- 18.2.7.2. Products
- 18.2.7.3. SWOT Analysis
- 18.2.7.4. Recent Developments
- 18.2.7.5. Financials (Based on Availability)
- 18.2.8 GSSI Geophysical Survey Systems Inc
- 18.2.8.1. Overview
- 18.2.8.2. Products
- 18.2.8.3. SWOT Analysis
- 18.2.8.4. Recent Developments
- 18.2.8.5. Financials (Based on Availability)
- 18.2.9 multiVIEW Locates Inc
- 18.2.9.1. Overview
- 18.2.9.2. Products
- 18.2.9.3. SWOT Analysis
- 18.2.9.4. Recent Developments
- 18.2.9.5. Financials (Based on Availability)
- 18.2.10 Geospatial Corporation
- 18.2.10.1. Overview
- 18.2.10.2. Products
- 18.2.10.3. SWOT Analysis
- 18.2.10.4. Recent Developments
- 18.2.10.5. Financials (Based on Availability)
- 18.2.1 Maverick Inspection Ltd
List of Figures
- Figure 1: Global Underground Utility Mapping Market Revenue Breakdown (Million, %) by Region 2024 & 2032
- Figure 2: North America Underground Utility Mapping Market Revenue (Million), by Country 2024 & 2032
- Figure 3: North America Underground Utility Mapping Market Revenue Share (%), by Country 2024 & 2032
- Figure 4: Europe Underground Utility Mapping Market Revenue (Million), by Country 2024 & 2032
- Figure 5: Europe Underground Utility Mapping Market Revenue Share (%), by Country 2024 & 2032
- Figure 6: Asia Pacific Underground Utility Mapping Market Revenue (Million), by Country 2024 & 2032
- Figure 7: Asia Pacific Underground Utility Mapping Market Revenue Share (%), by Country 2024 & 2032
- Figure 8: South America Underground Utility Mapping Market Revenue (Million), by Country 2024 & 2032
- Figure 9: South America Underground Utility Mapping Market Revenue Share (%), by Country 2024 & 2032
- Figure 10: North America Underground Utility Mapping Market Revenue (Million), by Country 2024 & 2032
- Figure 11: North America Underground Utility Mapping Market Revenue Share (%), by Country 2024 & 2032
- Figure 12: MEA Underground Utility Mapping Market Revenue (Million), by Country 2024 & 2032
- Figure 13: MEA Underground Utility Mapping Market Revenue Share (%), by Country 2024 & 2032
- Figure 14: North America Underground Utility Mapping Market Revenue (Million), by Component Type 2024 & 2032
- Figure 15: North America Underground Utility Mapping Market Revenue Share (%), by Component Type 2024 & 2032
- Figure 16: North America Underground Utility Mapping Market Revenue (Million), by End-user Industry 2024 & 2032
- Figure 17: North America Underground Utility Mapping Market Revenue Share (%), by End-user Industry 2024 & 2032
- Figure 18: North America Underground Utility Mapping Market Revenue (Million), by Country 2024 & 2032
- Figure 19: North America Underground Utility Mapping Market Revenue Share (%), by Country 2024 & 2032
- Figure 20: Europe Underground Utility Mapping Market Revenue (Million), by Component Type 2024 & 2032
- Figure 21: Europe Underground Utility Mapping Market Revenue Share (%), by Component Type 2024 & 2032
- Figure 22: Europe Underground Utility Mapping Market Revenue (Million), by End-user Industry 2024 & 2032
- Figure 23: Europe Underground Utility Mapping Market Revenue Share (%), by End-user Industry 2024 & 2032
- Figure 24: Europe Underground Utility Mapping Market Revenue (Million), by Country 2024 & 2032
- Figure 25: Europe Underground Utility Mapping Market Revenue Share (%), by Country 2024 & 2032
- Figure 26: Asia Underground Utility Mapping Market Revenue (Million), by Component Type 2024 & 2032
- Figure 27: Asia Underground Utility Mapping Market Revenue Share (%), by Component Type 2024 & 2032
- Figure 28: Asia Underground Utility Mapping Market Revenue (Million), by End-user Industry 2024 & 2032
- Figure 29: Asia Underground Utility Mapping Market Revenue Share (%), by End-user Industry 2024 & 2032
- Figure 30: Asia Underground Utility Mapping Market Revenue (Million), by Country 2024 & 2032
- Figure 31: Asia Underground Utility Mapping Market Revenue Share (%), by Country 2024 & 2032
- Figure 32: Australia and New Zealand Underground Utility Mapping Market Revenue (Million), by Component Type 2024 & 2032
- Figure 33: Australia and New Zealand Underground Utility Mapping Market Revenue Share (%), by Component Type 2024 & 2032
- Figure 34: Australia and New Zealand Underground Utility Mapping Market Revenue (Million), by End-user Industry 2024 & 2032
- Figure 35: Australia and New Zealand Underground Utility Mapping Market Revenue Share (%), by End-user Industry 2024 & 2032
- Figure 36: Australia and New Zealand Underground Utility Mapping Market Revenue (Million), by Country 2024 & 2032
- Figure 37: Australia and New Zealand Underground Utility Mapping Market Revenue Share (%), by Country 2024 & 2032
- Figure 38: Latin America Underground Utility Mapping Market Revenue (Million), by Component Type 2024 & 2032
- Figure 39: Latin America Underground Utility Mapping Market Revenue Share (%), by Component Type 2024 & 2032
- Figure 40: Latin America Underground Utility Mapping Market Revenue (Million), by End-user Industry 2024 & 2032
- Figure 41: Latin America Underground Utility Mapping Market Revenue Share (%), by End-user Industry 2024 & 2032
- Figure 42: Latin America Underground Utility Mapping Market Revenue (Million), by Country 2024 & 2032
- Figure 43: Latin America Underground Utility Mapping Market Revenue Share (%), by Country 2024 & 2032
- Figure 44: Middle East and Africa Underground Utility Mapping Market Revenue (Million), by Component Type 2024 & 2032
- Figure 45: Middle East and Africa Underground Utility Mapping Market Revenue Share (%), by Component Type 2024 & 2032
- Figure 46: Middle East and Africa Underground Utility Mapping Market Revenue (Million), by End-user Industry 2024 & 2032
- Figure 47: Middle East and Africa Underground Utility Mapping Market Revenue Share (%), by End-user Industry 2024 & 2032
- Figure 48: Middle East and Africa Underground Utility Mapping Market Revenue (Million), by Country 2024 & 2032
- Figure 49: Middle East and Africa Underground Utility Mapping Market Revenue Share (%), by Country 2024 & 2032
List of Tables
- Table 1: Global Underground Utility Mapping Market Revenue Million Forecast, by Region 2019 & 2032
- Table 2: Global Underground Utility Mapping Market Revenue Million Forecast, by Component Type 2019 & 2032
- Table 3: Global Underground Utility Mapping Market Revenue Million Forecast, by End-user Industry 2019 & 2032
- Table 4: Global Underground Utility Mapping Market Revenue Million Forecast, by Region 2019 & 2032
- Table 5: Global Underground Utility Mapping Market Revenue Million Forecast, by Country 2019 & 2032
- Table 6: United States Underground Utility Mapping Market Revenue (Million) Forecast, by Application 2019 & 2032
- Table 7: Canada Underground Utility Mapping Market Revenue (Million) Forecast, by Application 2019 & 2032
- Table 8: Mexico Underground Utility Mapping Market Revenue (Million) Forecast, by Application 2019 & 2032
- Table 9: Global Underground Utility Mapping Market Revenue Million Forecast, by Country 2019 & 2032
- Table 10: Germany Underground Utility Mapping Market Revenue (Million) Forecast, by Application 2019 & 2032
- Table 11: United Kingdom Underground Utility Mapping Market Revenue (Million) Forecast, by Application 2019 & 2032
- Table 12: France Underground Utility Mapping Market Revenue (Million) Forecast, by Application 2019 & 2032
- Table 13: Spain Underground Utility Mapping Market Revenue (Million) Forecast, by Application 2019 & 2032
- Table 14: Italy Underground Utility Mapping Market Revenue (Million) Forecast, by Application 2019 & 2032
- Table 15: Spain Underground Utility Mapping Market Revenue (Million) Forecast, by Application 2019 & 2032
- Table 16: Belgium Underground Utility Mapping Market Revenue (Million) Forecast, by Application 2019 & 2032
- Table 17: Netherland Underground Utility Mapping Market Revenue (Million) Forecast, by Application 2019 & 2032
- Table 18: Nordics Underground Utility Mapping Market Revenue (Million) Forecast, by Application 2019 & 2032
- Table 19: Rest of Europe Underground Utility Mapping Market Revenue (Million) Forecast, by Application 2019 & 2032
- Table 20: Global Underground Utility Mapping Market Revenue Million Forecast, by Country 2019 & 2032
- Table 21: China Underground Utility Mapping Market Revenue (Million) Forecast, by Application 2019 & 2032
- Table 22: Japan Underground Utility Mapping Market Revenue (Million) Forecast, by Application 2019 & 2032
- Table 23: India Underground Utility Mapping Market Revenue (Million) Forecast, by Application 2019 & 2032
- Table 24: South Korea Underground Utility Mapping Market Revenue (Million) Forecast, by Application 2019 & 2032
- Table 25: Southeast Asia Underground Utility Mapping Market Revenue (Million) Forecast, by Application 2019 & 2032
- Table 26: Australia Underground Utility Mapping Market Revenue (Million) Forecast, by Application 2019 & 2032
- Table 27: Indonesia Underground Utility Mapping Market Revenue (Million) Forecast, by Application 2019 & 2032
- Table 28: Phillipes Underground Utility Mapping Market Revenue (Million) Forecast, by Application 2019 & 2032
- Table 29: Singapore Underground Utility Mapping Market Revenue (Million) Forecast, by Application 2019 & 2032
- Table 30: Thailandc Underground Utility Mapping Market Revenue (Million) Forecast, by Application 2019 & 2032
- Table 31: Rest of Asia Pacific Underground Utility Mapping Market Revenue (Million) Forecast, by Application 2019 & 2032
- Table 32: Global Underground Utility Mapping Market Revenue Million Forecast, by Country 2019 & 2032
- Table 33: Brazil Underground Utility Mapping Market Revenue (Million) Forecast, by Application 2019 & 2032
- Table 34: Argentina Underground Utility Mapping Market Revenue (Million) Forecast, by Application 2019 & 2032
- Table 35: Peru Underground Utility Mapping Market Revenue (Million) Forecast, by Application 2019 & 2032
- Table 36: Chile Underground Utility Mapping Market Revenue (Million) Forecast, by Application 2019 & 2032
- Table 37: Colombia Underground Utility Mapping Market Revenue (Million) Forecast, by Application 2019 & 2032
- Table 38: Ecuador Underground Utility Mapping Market Revenue (Million) Forecast, by Application 2019 & 2032
- Table 39: Venezuela Underground Utility Mapping Market Revenue (Million) Forecast, by Application 2019 & 2032
- Table 40: Rest of South America Underground Utility Mapping Market Revenue (Million) Forecast, by Application 2019 & 2032
- Table 41: Global Underground Utility Mapping Market Revenue Million Forecast, by Country 2019 & 2032
- Table 42: United States Underground Utility Mapping Market Revenue (Million) Forecast, by Application 2019 & 2032
- Table 43: Canada Underground Utility Mapping Market Revenue (Million) Forecast, by Application 2019 & 2032
- Table 44: Mexico Underground Utility Mapping Market Revenue (Million) Forecast, by Application 2019 & 2032
- Table 45: Global Underground Utility Mapping Market Revenue Million Forecast, by Country 2019 & 2032
- Table 46: United Arab Emirates Underground Utility Mapping Market Revenue (Million) Forecast, by Application 2019 & 2032
- Table 47: Saudi Arabia Underground Utility Mapping Market Revenue (Million) Forecast, by Application 2019 & 2032
- Table 48: South Africa Underground Utility Mapping Market Revenue (Million) Forecast, by Application 2019 & 2032
- Table 49: Rest of Middle East and Africa Underground Utility Mapping Market Revenue (Million) Forecast, by Application 2019 & 2032
- Table 50: Global Underground Utility Mapping Market Revenue Million Forecast, by Component Type 2019 & 2032
- Table 51: Global Underground Utility Mapping Market Revenue Million Forecast, by End-user Industry 2019 & 2032
- Table 52: Global Underground Utility Mapping Market Revenue Million Forecast, by Country 2019 & 2032
- Table 53: Global Underground Utility Mapping Market Revenue Million Forecast, by Component Type 2019 & 2032
- Table 54: Global Underground Utility Mapping Market Revenue Million Forecast, by End-user Industry 2019 & 2032
- Table 55: Global Underground Utility Mapping Market Revenue Million Forecast, by Country 2019 & 2032
- Table 56: Global Underground Utility Mapping Market Revenue Million Forecast, by Component Type 2019 & 2032
- Table 57: Global Underground Utility Mapping Market Revenue Million Forecast, by End-user Industry 2019 & 2032
- Table 58: Global Underground Utility Mapping Market Revenue Million Forecast, by Country 2019 & 2032
- Table 59: Global Underground Utility Mapping Market Revenue Million Forecast, by Component Type 2019 & 2032
- Table 60: Global Underground Utility Mapping Market Revenue Million Forecast, by End-user Industry 2019 & 2032
- Table 61: Global Underground Utility Mapping Market Revenue Million Forecast, by Country 2019 & 2032
- Table 62: Global Underground Utility Mapping Market Revenue Million Forecast, by Component Type 2019 & 2032
- Table 63: Global Underground Utility Mapping Market Revenue Million Forecast, by End-user Industry 2019 & 2032
- Table 64: Global Underground Utility Mapping Market Revenue Million Forecast, by Country 2019 & 2032
- Table 65: Global Underground Utility Mapping Market Revenue Million Forecast, by Component Type 2019 & 2032
- Table 66: Global Underground Utility Mapping Market Revenue Million Forecast, by End-user Industry 2019 & 2032
- Table 67: Global Underground Utility Mapping Market Revenue Million Forecast, by Country 2019 & 2032
Frequently Asked Questions
1. What is the projected Compound Annual Growth Rate (CAGR) of the Underground Utility Mapping Market?
The projected CAGR is approximately > 9.61%.
2. Which companies are prominent players in the Underground Utility Mapping Market?
Key companies in the market include Maverick Inspection Ltd, Plowman Craven Limited, Landscope Engineering Ltd, Technics Group, Hexagon AB, Red Laser Scanning, Vivax-Metrotech Corp, GSSI Geophysical Survey Systems Inc, multiVIEW Locates Inc, Geospatial Corporation.
3. What are the main segments of the Underground Utility Mapping Market?
The market segments include Component Type, End-user Industry.
4. Can you provide details about the market size?
The market size is estimated to be USD 1.32 Million as of 2022.
5. What are some drivers contributing to market growth?
Emerging Technologies Combined With Utility Maps to Improve the Exploration Activities; Increasing Availability of Detecting Applications and Increased Return on Marketing Spending.
6. What are the notable trends driving market growth?
Ground Penetrating Radar is Expected to be the Largest Component Type Solution.
7. Are there any restraints impacting market growth?
High Initial Investment Cost To Hinder Market Growth.
8. Can you provide examples of recent developments in the market?
March 2024: WSB LLC (“WSB”), one of the nation’s fastest-growing infrastructure engineering and consulting firms, partnered with 4M Analytics, the nation’s leading subsurface utility AI mapping and analytics solution. This partnership is intended to support infrastructure projects across the United States, focusing on data integrity and real-time digital delivery. Leveraging artificial intelligence, computer vision, and change detection techniques, 4M Analytics synthesizes, digitizes, and geo-locates millions of utility data sources into a single platform and visually validates each line using vertical and horizontal imagery dating back to the 1940s. This enables ‘real-time’ access to the utility landscape for infrastructure projects through an intuitive user interface. The mapping resources will decrease the time it takes to locate underground utilities for owners, civil engineering firms, general contractors, subsurface utility engineering firms, and many other utility stakeholders.
9. What pricing options are available for accessing the report?
Pricing options include single-user, multi-user, and enterprise licenses priced at USD 4750, USD 5250, and USD 8750 respectively.
10. Is the market size provided in terms of value or volume?
The market size is provided in terms of value, measured in Million.
11. Are there any specific market keywords associated with the report?
Yes, the market keyword associated with the report is "Underground Utility Mapping Market," which aids in identifying and referencing the specific market segment covered.
12. How do I determine which pricing option suits my needs best?
The pricing options vary based on user requirements and access needs. Individual users may opt for single-user licenses, while businesses requiring broader access may choose multi-user or enterprise licenses for cost-effective access to the report.
13. Are there any additional resources or data provided in the Underground Utility Mapping Market report?
While the report offers comprehensive insights, it's advisable to review the specific contents or supplementary materials provided to ascertain if additional resources or data are available.
14. How can I stay updated on further developments or reports in the Underground Utility Mapping Market?
To stay informed about further developments, trends, and reports in the Underground Utility Mapping Market, consider subscribing to industry newsletters, following relevant companies and organizations, or regularly checking reputable industry news sources and publications.
Methodology
Step 1 - Identification of Relevant Samples Size from Population Database


Step 2 - Approaches for Defining Global Market Size (Value, Volume* & Price*)

Note*: In applicable scenarios
Step 3 - Data Sources
Primary Research
- Web Analytics
- Survey Reports
- Research Institute
- Latest Research Reports
- Opinion Leaders
Secondary Research
- Annual Reports
- White Paper
- Latest Press Release
- Industry Association
- Paid Database
- Investor Presentations

Step 4 - Data Triangulation
Involves using different sources of information in order to increase the validity of a study
These sources are likely to be stakeholders in a program - participants, other researchers, program staff, other community members, and so on.
Then we put all data in single framework & apply various statistical tools to find out the dynamic on the market.
During the analysis stage, feedback from the stakeholder groups would be compared to determine areas of agreement as well as areas of divergence
