

Key Insights
The synthetic monitoring market is experiencing robust growth, driven by the increasing reliance on digital services and the critical need for proactive performance assurance across diverse applications and platforms. The market's Compound Annual Growth Rate (CAGR) of 15.30% from 2019 to 2024 indicates a significant upward trajectory. This expansion is fueled by several key factors. Firstly, the rising adoption of cloud computing and microservices architectures necessitates sophisticated monitoring solutions to ensure seamless application performance and uptime. Secondly, the growing complexity of digital infrastructures, including hybrid and multi-cloud deployments, creates a heightened demand for tools capable of effectively monitoring and managing performance across distributed systems. Thirdly, the increasing emphasis on digital transformation across various sectors, including BFSI, IT & Telecommunications, and Retail, is directly correlated with increased investment in synthetic monitoring solutions. Finally, stringent regulatory compliance requirements in sectors like finance and healthcare necessitate robust monitoring to ensure data security and operational resilience.
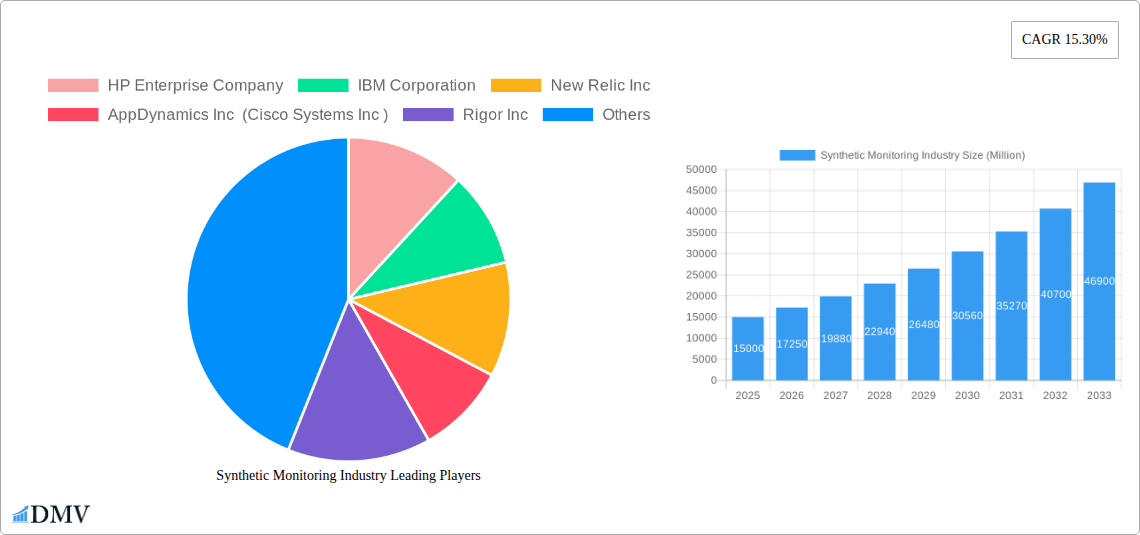
The market segmentation reveals a diverse landscape with API Monitoring, Website Monitoring, and Mobile Application Monitoring as leading types. Among end-user verticals, BFSI and IT & Telecommunication sectors demonstrate significant adoption rates, reflecting their dependence on uninterrupted digital services. While North America currently holds a substantial market share, the Asia-Pacific region is projected to witness significant growth due to the expanding digital economy and increasing adoption of cloud services. Competition is fierce, with established players like HP Enterprise, IBM, and Oracle alongside agile newcomers constantly innovating to provide comprehensive and increasingly sophisticated solutions. The forecast period (2025-2033) promises continued growth, driven by advancements in artificial intelligence and machine learning for improved performance analysis and predictive capabilities. This will lead to more intelligent and automated monitoring processes, thereby further boosting market expansion.
Synthetic Monitoring Industry Market Report: 2019-2033
This comprehensive report provides a detailed analysis of the Synthetic Monitoring industry, projecting a market value of $XX Million by 2033. It covers market size, growth drivers, competitive landscape, and future opportunities, offering invaluable insights for stakeholders. The study period spans 2019-2033, with 2025 serving as the base and estimated year. The report meticulously analyzes key segments like API, website, and mobile application monitoring, across diverse end-user verticals, including BFSI, IT & Telecommunication, Retail, and more.
Synthetic Monitoring Industry Market Composition & Trends
This section delves into the competitive dynamics of the Synthetic Monitoring market, evaluating market concentration, innovation drivers, regulatory influences, substitute products, and end-user profiles. The analysis includes mergers and acquisitions (M&A) activity, providing insights into market share distribution and deal values. The market is characterized by a moderately concentrated landscape, with key players vying for market dominance. Innovation is primarily driven by advancements in AI, machine learning, and cloud computing, enabling more sophisticated and efficient monitoring solutions.
- Market Concentration: The top 5 players account for approximately XX% of the market share in 2025.
- M&A Activity: Significant M&A activity was observed during the historical period (2019-2024), with deal values totaling approximately $XX Million. These activities have reshaped the competitive landscape and fueled innovation.
- Regulatory Landscape: Data privacy regulations (e.g., GDPR, CCPA) are increasingly influencing the market, driving demand for compliant monitoring solutions.
- Substitute Products: While traditional methods of monitoring exist, the advantages of synthetic monitoring in terms of proactive issue detection and improved performance analysis make it the preferred choice.
- End-User Profiles: The report segments end-users across various industries, analyzing their specific needs and adoption rates. The BFSI sector exhibits high adoption due to stringent regulatory requirements and the critical nature of uptime.
Synthetic Monitoring Industry Industry Evolution
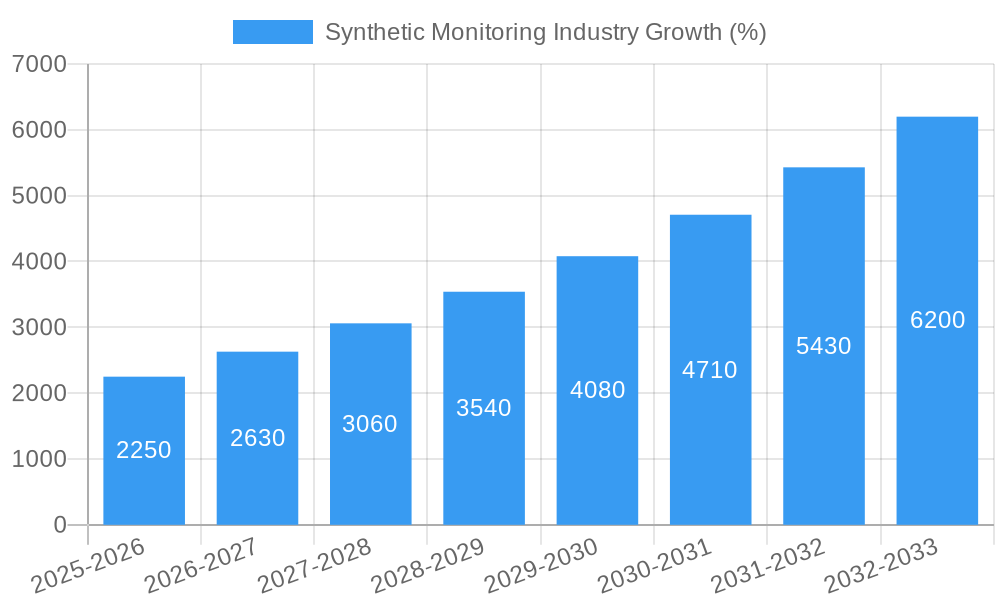
The Synthetic Monitoring industry has witnessed robust growth throughout the historical period (2019-2024), fueled by increasing digital transformation and the rising reliance on web and mobile applications. The market experienced a Compound Annual Growth Rate (CAGR) of XX% from 2019 to 2024, reaching a value of $XX Million in 2024. This growth is expected to continue into the forecast period (2025-2033), driven by factors such as:
- Technological Advancements: The integration of AI, machine learning, and automation into synthetic monitoring platforms is enhancing accuracy and efficiency.
- Shifting Consumer Demands: Consumers expect seamless digital experiences, putting immense pressure on businesses to ensure application uptime and performance, leading to increased demand for synthetic monitoring tools.
- Cloud Adoption: The shift towards cloud-based infrastructure is driving the adoption of cloud-based synthetic monitoring solutions.
Leading Regions, Countries, or Segments in Synthetic Monitoring Industry
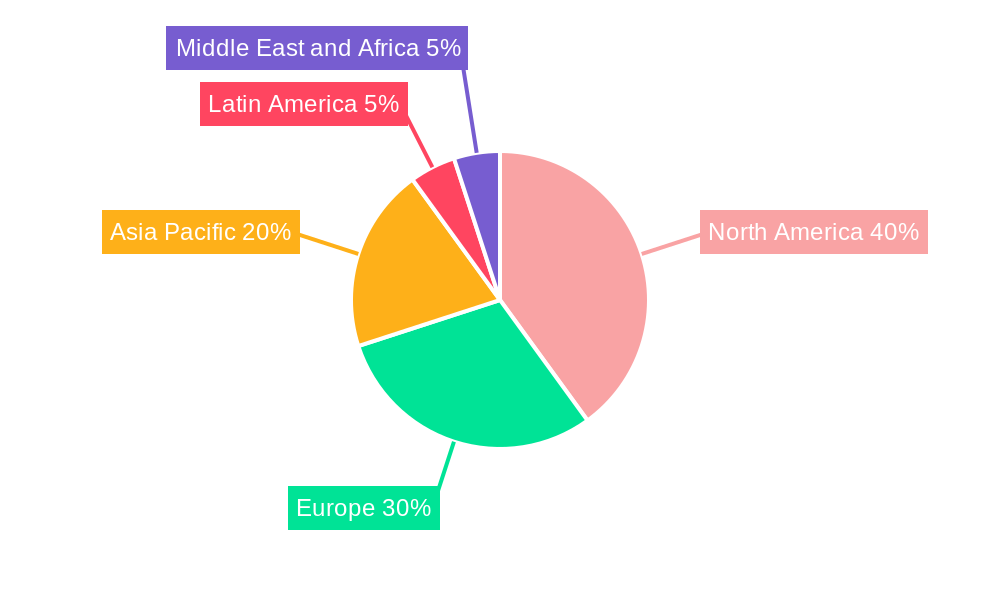
North America currently dominates the Synthetic Monitoring market, followed by Europe and Asia Pacific. This dominance is attributed to factors such as early adoption of digital technologies, robust IT infrastructure, and a high concentration of key players.
By Type:
- Website Monitoring: This segment continues to hold a significant share, driven by the importance of website uptime for businesses of all sizes.
- API Monitoring: Growing API adoption across various industries has fueled the growth of this segment.
- Mobile Application Monitoring: The increasing penetration of smartphones and the proliferation of mobile applications contribute to the substantial growth in this area.
By End-User Vertical:
- BFSI: High adoption rates due to stringent compliance requirements and the critical nature of uninterrupted financial services.
- IT and Telecommunication: High demand for monitoring solutions to maintain the uptime and performance of complex IT infrastructures.
- Retail: The increasing reliance on e-commerce drives adoption for monitoring online stores and transactional platforms.
Key Drivers: High investment in digital transformation initiatives, stringent regulatory compliance requirements, and increasing adoption of cloud-based technologies.
Synthetic Monitoring Industry Product Innovations
Recent years have seen significant innovation in Synthetic Monitoring, including the development of AI-powered monitoring tools, improved dashboards, and the integration of synthetic testing into DevOps pipelines. These innovations aim to enhance the accuracy, efficiency, and actionable insights provided by synthetic monitoring platforms, allowing businesses to proactively identify and resolve performance issues, ultimately leading to improved customer experience and operational efficiency. Unique selling propositions include advanced analytics, automated remediation, and seamless integration with existing IT infrastructure.
Propelling Factors for Synthetic Monitoring Industry Growth
Several factors are driving growth in the synthetic monitoring market, including:
- Increased digital transformation initiatives: Businesses are increasingly reliant on digital technologies, necessitating robust monitoring solutions.
- Rising demand for enhanced customer experience: Seamless digital experiences are critical for customer satisfaction and loyalty.
- Stringent regulatory compliance requirements: Industries like BFSI have stringent compliance requirements that necessitates robust monitoring solutions.
Obstacles in the Synthetic Monitoring Industry Market
Despite the growth potential, certain challenges hinder market expansion:
- High initial investment costs: Implementing synthetic monitoring solutions can be expensive, especially for smaller businesses.
- Complex integration with existing systems: Integration with legacy systems can be challenging and time-consuming.
- Skills gap: The lack of skilled professionals to manage and interpret synthetic monitoring data poses a challenge.
Future Opportunities in Synthetic Monitoring Industry
Emerging opportunities include:
- Expansion into new markets: Growing adoption in developing economies presents significant growth potential.
- Integration with emerging technologies: Integration with IoT and edge computing will expand the scope of synthetic monitoring.
- Development of advanced analytics: Sophisticated analytics can provide more proactive insights into potential issues.
Major Players in the Synthetic Monitoring Industry Ecosystem
- HP Enterprise Company
- IBM Corporation
- New Relic Inc
- AppDynamics Inc (Cisco Systems Inc)
- Rigor Inc
- Smart Bear Software Inc
- Broadcom Inc
- BMC Software Inc
- Monitis Inc
- Oracle Corporation
- Apica AB
- Dell Technologies Inc
- Dynatrace LLC
- SolarWinds Inc
Key Developments in Synthetic Monitoring Industry Industry
- June 2022: SmartBear Software enhanced its BitBar platform with web browser testing capabilities, improving mobile app testing. This improves the quality and consistency of digital customer experiences.
- December 2022: Broadcom Inc. launched CA 1 flexible storage, offering secure and cost-effective mainframe data storage for hybrid IT environments. This boosts efficiency and security in data management, impacting the entire IT landscape.
Strategic Synthetic Monitoring Industry Market Forecast
The Synthetic Monitoring market is poised for continued robust growth, driven by increasing digitalization and the demand for high-performing, reliable digital experiences. The forecast period (2025-2033) anticipates significant expansion, fueled by technological advancements, increased adoption across diverse sectors, and ongoing innovation within the industry. The market's potential is substantial, presenting attractive opportunities for existing and new players.
Synthetic Monitoring Industry Segmentation
-
1. Type
- 1.1. API Monitoring
- 1.2. Website Monitoring
- 1.3. Mobile Application Monitoring
-
2. End-User Vertical
- 2.1. BFSI
- 2.2. IT and Telecommunication
- 2.3. Retail
- 2.4. Government
- 2.5. Manufacturing and Automotive
- 2.6. Military and Defense
- 2.7. Other End-user Verticals
Synthetic Monitoring Industry Segmentation By Geography
- 1. North America
- 2. Europe
- 3. Asia Pacific
- 4. Latin America
- 5. Middle East and Africa
Synthetic Monitoring Industry REPORT HIGHLIGHTS
| Aspects | Details |
|---|---|
| Study Period | 2019-2033 |
| Base Year | 2024 |
| Estimated Year | 2025 |
| Forecast Period | 2025-2033 |
| Historical Period | 2019-2024 |
| Growth Rate | CAGR of 15.30% from 2019-2033 |
| Segmentation |
|
Table of Contents
- 1. Introduction
- 1.1. Research Scope
- 1.2. Market Segmentation
- 1.3. Research Methodology
- 1.4. Definitions and Assumptions
- 2. Executive Summary
- 2.1. Introduction
- 3. Market Dynamics
- 3.1. Introduction
- 3.2. Market Drivers
- 3.2.1. Increasing Need for Monitoring Service Level Agreement (SLA) Targets; Rising Demand for Application Performance Management; Increasing Need for DevOPs
- 3.3. Market Restrains
- 3.3.1. Increased Demand for Outsourcing and Automation in Pharmaceutical Manufacturing
- 3.4. Market Trends
- 3.4.1. IT and Telecommunications is Expected to Show Significant Growth
- 4. Market Factor Analysis
- 4.1. Porters Five Forces
- 4.2. Supply/Value Chain
- 4.3. PESTEL analysis
- 4.4. Market Entropy
- 4.5. Patent/Trademark Analysis
- 5. Global Synthetic Monitoring Industry Analysis, Insights and Forecast, 2019-2031
- 5.1. Market Analysis, Insights and Forecast - by Type
- 5.1.1. API Monitoring
- 5.1.2. Website Monitoring
- 5.1.3. Mobile Application Monitoring
- 5.2. Market Analysis, Insights and Forecast - by End-User Vertical
- 5.2.1. BFSI
- 5.2.2. IT and Telecommunication
- 5.2.3. Retail
- 5.2.4. Government
- 5.2.5. Manufacturing and Automotive
- 5.2.6. Military and Defense
- 5.2.7. Other End-user Verticals
- 5.3. Market Analysis, Insights and Forecast - by Region
- 5.3.1. North America
- 5.3.2. Europe
- 5.3.3. Asia Pacific
- 5.3.4. Latin America
- 5.3.5. Middle East and Africa
- 5.1. Market Analysis, Insights and Forecast - by Type
- 6. North America Synthetic Monitoring Industry Analysis, Insights and Forecast, 2019-2031
- 6.1. Market Analysis, Insights and Forecast - by Type
- 6.1.1. API Monitoring
- 6.1.2. Website Monitoring
- 6.1.3. Mobile Application Monitoring
- 6.2. Market Analysis, Insights and Forecast - by End-User Vertical
- 6.2.1. BFSI
- 6.2.2. IT and Telecommunication
- 6.2.3. Retail
- 6.2.4. Government
- 6.2.5. Manufacturing and Automotive
- 6.2.6. Military and Defense
- 6.2.7. Other End-user Verticals
- 6.1. Market Analysis, Insights and Forecast - by Type
- 7. Europe Synthetic Monitoring Industry Analysis, Insights and Forecast, 2019-2031
- 7.1. Market Analysis, Insights and Forecast - by Type
- 7.1.1. API Monitoring
- 7.1.2. Website Monitoring
- 7.1.3. Mobile Application Monitoring
- 7.2. Market Analysis, Insights and Forecast - by End-User Vertical
- 7.2.1. BFSI
- 7.2.2. IT and Telecommunication
- 7.2.3. Retail
- 7.2.4. Government
- 7.2.5. Manufacturing and Automotive
- 7.2.6. Military and Defense
- 7.2.7. Other End-user Verticals
- 7.1. Market Analysis, Insights and Forecast - by Type
- 8. Asia Pacific Synthetic Monitoring Industry Analysis, Insights and Forecast, 2019-2031
- 8.1. Market Analysis, Insights and Forecast - by Type
- 8.1.1. API Monitoring
- 8.1.2. Website Monitoring
- 8.1.3. Mobile Application Monitoring
- 8.2. Market Analysis, Insights and Forecast - by End-User Vertical
- 8.2.1. BFSI
- 8.2.2. IT and Telecommunication
- 8.2.3. Retail
- 8.2.4. Government
- 8.2.5. Manufacturing and Automotive
- 8.2.6. Military and Defense
- 8.2.7. Other End-user Verticals
- 8.1. Market Analysis, Insights and Forecast - by Type
- 9. Latin America Synthetic Monitoring Industry Analysis, Insights and Forecast, 2019-2031
- 9.1. Market Analysis, Insights and Forecast - by Type
- 9.1.1. API Monitoring
- 9.1.2. Website Monitoring
- 9.1.3. Mobile Application Monitoring
- 9.2. Market Analysis, Insights and Forecast - by End-User Vertical
- 9.2.1. BFSI
- 9.2.2. IT and Telecommunication
- 9.2.3. Retail
- 9.2.4. Government
- 9.2.5. Manufacturing and Automotive
- 9.2.6. Military and Defense
- 9.2.7. Other End-user Verticals
- 9.1. Market Analysis, Insights and Forecast - by Type
- 10. Middle East and Africa Synthetic Monitoring Industry Analysis, Insights and Forecast, 2019-2031
- 10.1. Market Analysis, Insights and Forecast - by Type
- 10.1.1. API Monitoring
- 10.1.2. Website Monitoring
- 10.1.3. Mobile Application Monitoring
- 10.2. Market Analysis, Insights and Forecast - by End-User Vertical
- 10.2.1. BFSI
- 10.2.2. IT and Telecommunication
- 10.2.3. Retail
- 10.2.4. Government
- 10.2.5. Manufacturing and Automotive
- 10.2.6. Military and Defense
- 10.2.7. Other End-user Verticals
- 10.1. Market Analysis, Insights and Forecast - by Type
- 11. North America Synthetic Monitoring Industry Analysis, Insights and Forecast, 2019-2031
- 11.1. Market Analysis, Insights and Forecast - By Country/Sub-region
- 11.1.1.
- 12. Europe Synthetic Monitoring Industry Analysis, Insights and Forecast, 2019-2031
- 12.1. Market Analysis, Insights and Forecast - By Country/Sub-region
- 12.1.1.
- 13. Asia Pacific Synthetic Monitoring Industry Analysis, Insights and Forecast, 2019-2031
- 13.1. Market Analysis, Insights and Forecast - By Country/Sub-region
- 13.1.1.
- 14. Latin America Synthetic Monitoring Industry Analysis, Insights and Forecast, 2019-2031
- 14.1. Market Analysis, Insights and Forecast - By Country/Sub-region
- 14.1.1.
- 15. Middle East and Africa Synthetic Monitoring Industry Analysis, Insights and Forecast, 2019-2031
- 15.1. Market Analysis, Insights and Forecast - By Country/Sub-region
- 15.1.1.
- 16. Competitive Analysis
- 16.1. Global Market Share Analysis 2024
- 16.2. Company Profiles
- 16.2.1 HP Enterprise Company
- 16.2.1.1. Overview
- 16.2.1.2. Products
- 16.2.1.3. SWOT Analysis
- 16.2.1.4. Recent Developments
- 16.2.1.5. Financials (Based on Availability)
- 16.2.2 IBM Corporation
- 16.2.2.1. Overview
- 16.2.2.2. Products
- 16.2.2.3. SWOT Analysis
- 16.2.2.4. Recent Developments
- 16.2.2.5. Financials (Based on Availability)
- 16.2.3 New Relic Inc
- 16.2.3.1. Overview
- 16.2.3.2. Products
- 16.2.3.3. SWOT Analysis
- 16.2.3.4. Recent Developments
- 16.2.3.5. Financials (Based on Availability)
- 16.2.4 AppDynamics Inc (Cisco Systems Inc )
- 16.2.4.1. Overview
- 16.2.4.2. Products
- 16.2.4.3. SWOT Analysis
- 16.2.4.4. Recent Developments
- 16.2.4.5. Financials (Based on Availability)
- 16.2.5 Rigor Inc
- 16.2.5.1. Overview
- 16.2.5.2. Products
- 16.2.5.3. SWOT Analysis
- 16.2.5.4. Recent Developments
- 16.2.5.5. Financials (Based on Availability)
- 16.2.6 Smart Bear Software Inc
- 16.2.6.1. Overview
- 16.2.6.2. Products
- 16.2.6.3. SWOT Analysis
- 16.2.6.4. Recent Developments
- 16.2.6.5. Financials (Based on Availability)
- 16.2.7 Broadcom Inc
- 16.2.7.1. Overview
- 16.2.7.2. Products
- 16.2.7.3. SWOT Analysis
- 16.2.7.4. Recent Developments
- 16.2.7.5. Financials (Based on Availability)
- 16.2.8 BMC Software Inc
- 16.2.8.1. Overview
- 16.2.8.2. Products
- 16.2.8.3. SWOT Analysis
- 16.2.8.4. Recent Developments
- 16.2.8.5. Financials (Based on Availability)
- 16.2.9 Monitis Inc
- 16.2.9.1. Overview
- 16.2.9.2. Products
- 16.2.9.3. SWOT Analysis
- 16.2.9.4. Recent Developments
- 16.2.9.5. Financials (Based on Availability)
- 16.2.10 Oracle Corporation
- 16.2.10.1. Overview
- 16.2.10.2. Products
- 16.2.10.3. SWOT Analysis
- 16.2.10.4. Recent Developments
- 16.2.10.5. Financials (Based on Availability)
- 16.2.11 Apica AB
- 16.2.11.1. Overview
- 16.2.11.2. Products
- 16.2.11.3. SWOT Analysis
- 16.2.11.4. Recent Developments
- 16.2.11.5. Financials (Based on Availability)
- 16.2.12 Dell Technologies Inc
- 16.2.12.1. Overview
- 16.2.12.2. Products
- 16.2.12.3. SWOT Analysis
- 16.2.12.4. Recent Developments
- 16.2.12.5. Financials (Based on Availability)
- 16.2.13 Dynatrace LLC
- 16.2.13.1. Overview
- 16.2.13.2. Products
- 16.2.13.3. SWOT Analysis
- 16.2.13.4. Recent Developments
- 16.2.13.5. Financials (Based on Availability)
- 16.2.14 SolarWinds Inc
- 16.2.14.1. Overview
- 16.2.14.2. Products
- 16.2.14.3. SWOT Analysis
- 16.2.14.4. Recent Developments
- 16.2.14.5. Financials (Based on Availability)
- 16.2.1 HP Enterprise Company
List of Figures
- Figure 1: Global Synthetic Monitoring Industry Revenue Breakdown (Million, %) by Region 2024 & 2032
- Figure 2: North America Synthetic Monitoring Industry Revenue (Million), by Country 2024 & 2032
- Figure 3: North America Synthetic Monitoring Industry Revenue Share (%), by Country 2024 & 2032
- Figure 4: Europe Synthetic Monitoring Industry Revenue (Million), by Country 2024 & 2032
- Figure 5: Europe Synthetic Monitoring Industry Revenue Share (%), by Country 2024 & 2032
- Figure 6: Asia Pacific Synthetic Monitoring Industry Revenue (Million), by Country 2024 & 2032
- Figure 7: Asia Pacific Synthetic Monitoring Industry Revenue Share (%), by Country 2024 & 2032
- Figure 8: Latin America Synthetic Monitoring Industry Revenue (Million), by Country 2024 & 2032
- Figure 9: Latin America Synthetic Monitoring Industry Revenue Share (%), by Country 2024 & 2032
- Figure 10: Middle East and Africa Synthetic Monitoring Industry Revenue (Million), by Country 2024 & 2032
- Figure 11: Middle East and Africa Synthetic Monitoring Industry Revenue Share (%), by Country 2024 & 2032
- Figure 12: North America Synthetic Monitoring Industry Revenue (Million), by Type 2024 & 2032
- Figure 13: North America Synthetic Monitoring Industry Revenue Share (%), by Type 2024 & 2032
- Figure 14: North America Synthetic Monitoring Industry Revenue (Million), by End-User Vertical 2024 & 2032
- Figure 15: North America Synthetic Monitoring Industry Revenue Share (%), by End-User Vertical 2024 & 2032
- Figure 16: North America Synthetic Monitoring Industry Revenue (Million), by Country 2024 & 2032
- Figure 17: North America Synthetic Monitoring Industry Revenue Share (%), by Country 2024 & 2032
- Figure 18: Europe Synthetic Monitoring Industry Revenue (Million), by Type 2024 & 2032
- Figure 19: Europe Synthetic Monitoring Industry Revenue Share (%), by Type 2024 & 2032
- Figure 20: Europe Synthetic Monitoring Industry Revenue (Million), by End-User Vertical 2024 & 2032
- Figure 21: Europe Synthetic Monitoring Industry Revenue Share (%), by End-User Vertical 2024 & 2032
- Figure 22: Europe Synthetic Monitoring Industry Revenue (Million), by Country 2024 & 2032
- Figure 23: Europe Synthetic Monitoring Industry Revenue Share (%), by Country 2024 & 2032
- Figure 24: Asia Pacific Synthetic Monitoring Industry Revenue (Million), by Type 2024 & 2032
- Figure 25: Asia Pacific Synthetic Monitoring Industry Revenue Share (%), by Type 2024 & 2032
- Figure 26: Asia Pacific Synthetic Monitoring Industry Revenue (Million), by End-User Vertical 2024 & 2032
- Figure 27: Asia Pacific Synthetic Monitoring Industry Revenue Share (%), by End-User Vertical 2024 & 2032
- Figure 28: Asia Pacific Synthetic Monitoring Industry Revenue (Million), by Country 2024 & 2032
- Figure 29: Asia Pacific Synthetic Monitoring Industry Revenue Share (%), by Country 2024 & 2032
- Figure 30: Latin America Synthetic Monitoring Industry Revenue (Million), by Type 2024 & 2032
- Figure 31: Latin America Synthetic Monitoring Industry Revenue Share (%), by Type 2024 & 2032
- Figure 32: Latin America Synthetic Monitoring Industry Revenue (Million), by End-User Vertical 2024 & 2032
- Figure 33: Latin America Synthetic Monitoring Industry Revenue Share (%), by End-User Vertical 2024 & 2032
- Figure 34: Latin America Synthetic Monitoring Industry Revenue (Million), by Country 2024 & 2032
- Figure 35: Latin America Synthetic Monitoring Industry Revenue Share (%), by Country 2024 & 2032
- Figure 36: Middle East and Africa Synthetic Monitoring Industry Revenue (Million), by Type 2024 & 2032
- Figure 37: Middle East and Africa Synthetic Monitoring Industry Revenue Share (%), by Type 2024 & 2032
- Figure 38: Middle East and Africa Synthetic Monitoring Industry Revenue (Million), by End-User Vertical 2024 & 2032
- Figure 39: Middle East and Africa Synthetic Monitoring Industry Revenue Share (%), by End-User Vertical 2024 & 2032
- Figure 40: Middle East and Africa Synthetic Monitoring Industry Revenue (Million), by Country 2024 & 2032
- Figure 41: Middle East and Africa Synthetic Monitoring Industry Revenue Share (%), by Country 2024 & 2032
List of Tables
- Table 1: Global Synthetic Monitoring Industry Revenue Million Forecast, by Region 2019 & 2032
- Table 2: Global Synthetic Monitoring Industry Revenue Million Forecast, by Type 2019 & 2032
- Table 3: Global Synthetic Monitoring Industry Revenue Million Forecast, by End-User Vertical 2019 & 2032
- Table 4: Global Synthetic Monitoring Industry Revenue Million Forecast, by Region 2019 & 2032
- Table 5: Global Synthetic Monitoring Industry Revenue Million Forecast, by Country 2019 & 2032
- Table 6: Synthetic Monitoring Industry Revenue (Million) Forecast, by Application 2019 & 2032
- Table 7: Global Synthetic Monitoring Industry Revenue Million Forecast, by Country 2019 & 2032
- Table 8: Synthetic Monitoring Industry Revenue (Million) Forecast, by Application 2019 & 2032
- Table 9: Global Synthetic Monitoring Industry Revenue Million Forecast, by Country 2019 & 2032
- Table 10: Synthetic Monitoring Industry Revenue (Million) Forecast, by Application 2019 & 2032
- Table 11: Global Synthetic Monitoring Industry Revenue Million Forecast, by Country 2019 & 2032
- Table 12: Synthetic Monitoring Industry Revenue (Million) Forecast, by Application 2019 & 2032
- Table 13: Global Synthetic Monitoring Industry Revenue Million Forecast, by Country 2019 & 2032
- Table 14: Synthetic Monitoring Industry Revenue (Million) Forecast, by Application 2019 & 2032
- Table 15: Global Synthetic Monitoring Industry Revenue Million Forecast, by Type 2019 & 2032
- Table 16: Global Synthetic Monitoring Industry Revenue Million Forecast, by End-User Vertical 2019 & 2032
- Table 17: Global Synthetic Monitoring Industry Revenue Million Forecast, by Country 2019 & 2032
- Table 18: Global Synthetic Monitoring Industry Revenue Million Forecast, by Type 2019 & 2032
- Table 19: Global Synthetic Monitoring Industry Revenue Million Forecast, by End-User Vertical 2019 & 2032
- Table 20: Global Synthetic Monitoring Industry Revenue Million Forecast, by Country 2019 & 2032
- Table 21: Global Synthetic Monitoring Industry Revenue Million Forecast, by Type 2019 & 2032
- Table 22: Global Synthetic Monitoring Industry Revenue Million Forecast, by End-User Vertical 2019 & 2032
- Table 23: Global Synthetic Monitoring Industry Revenue Million Forecast, by Country 2019 & 2032
- Table 24: Global Synthetic Monitoring Industry Revenue Million Forecast, by Type 2019 & 2032
- Table 25: Global Synthetic Monitoring Industry Revenue Million Forecast, by End-User Vertical 2019 & 2032
- Table 26: Global Synthetic Monitoring Industry Revenue Million Forecast, by Country 2019 & 2032
- Table 27: Global Synthetic Monitoring Industry Revenue Million Forecast, by Type 2019 & 2032
- Table 28: Global Synthetic Monitoring Industry Revenue Million Forecast, by End-User Vertical 2019 & 2032
- Table 29: Global Synthetic Monitoring Industry Revenue Million Forecast, by Country 2019 & 2032
Frequently Asked Questions
1. What is the projected Compound Annual Growth Rate (CAGR) of the Synthetic Monitoring Industry?
The projected CAGR is approximately 15.30%.
2. Which companies are prominent players in the Synthetic Monitoring Industry?
Key companies in the market include HP Enterprise Company, IBM Corporation, New Relic Inc, AppDynamics Inc (Cisco Systems Inc ), Rigor Inc, Smart Bear Software Inc, Broadcom Inc, BMC Software Inc, Monitis Inc , Oracle Corporation, Apica AB, Dell Technologies Inc, Dynatrace LLC, SolarWinds Inc.
3. What are the main segments of the Synthetic Monitoring Industry?
The market segments include Type, End-User Vertical.
4. Can you provide details about the market size?
The market size is estimated to be USD XX Million as of 2022.
5. What are some drivers contributing to market growth?
Increasing Need for Monitoring Service Level Agreement (SLA) Targets; Rising Demand for Application Performance Management; Increasing Need for DevOPs.
6. What are the notable trends driving market growth?
IT and Telecommunications is Expected to Show Significant Growth.
7. Are there any restraints impacting market growth?
Increased Demand for Outsourcing and Automation in Pharmaceutical Manufacturing.
8. Can you provide examples of recent developments in the market?
December 2022: Broadcom Inc. announced the availability of a new solution that enables enterprises to store their mainframe data anywhere they choose, including the Cloud. Broadcom's CA 1 flexible storage solution provides secure, cost-effective mainframe data storage options for hybrid IT environments, enabling customers to achieve dramatic cost savings and protect against ransomware.
9. What pricing options are available for accessing the report?
Pricing options include single-user, multi-user, and enterprise licenses priced at USD 4750, USD 5250, and USD 8750 respectively.
10. Is the market size provided in terms of value or volume?
The market size is provided in terms of value, measured in Million.
11. Are there any specific market keywords associated with the report?
Yes, the market keyword associated with the report is "Synthetic Monitoring Industry," which aids in identifying and referencing the specific market segment covered.
12. How do I determine which pricing option suits my needs best?
The pricing options vary based on user requirements and access needs. Individual users may opt for single-user licenses, while businesses requiring broader access may choose multi-user or enterprise licenses for cost-effective access to the report.
13. Are there any additional resources or data provided in the Synthetic Monitoring Industry report?
While the report offers comprehensive insights, it's advisable to review the specific contents or supplementary materials provided to ascertain if additional resources or data are available.
14. How can I stay updated on further developments or reports in the Synthetic Monitoring Industry?
To stay informed about further developments, trends, and reports in the Synthetic Monitoring Industry, consider subscribing to industry newsletters, following relevant companies and organizations, or regularly checking reputable industry news sources and publications.
Methodology
Step 1 - Identification of Relevant Samples Size from Population Database


Step 2 - Approaches for Defining Global Market Size (Value, Volume* & Price*)

Note*: In applicable scenarios
Step 3 - Data Sources
Primary Research
- Web Analytics
- Survey Reports
- Research Institute
- Latest Research Reports
- Opinion Leaders
Secondary Research
- Annual Reports
- White Paper
- Latest Press Release
- Industry Association
- Paid Database
- Investor Presentations

Step 4 - Data Triangulation
Involves using different sources of information in order to increase the validity of a study
These sources are likely to be stakeholders in a program - participants, other researchers, program staff, other community members, and so on.
Then we put all data in single framework & apply various statistical tools to find out the dynamic on the market.
During the analysis stage, feedback from the stakeholder groups would be compared to determine areas of agreement as well as areas of divergence
