


Key Insights
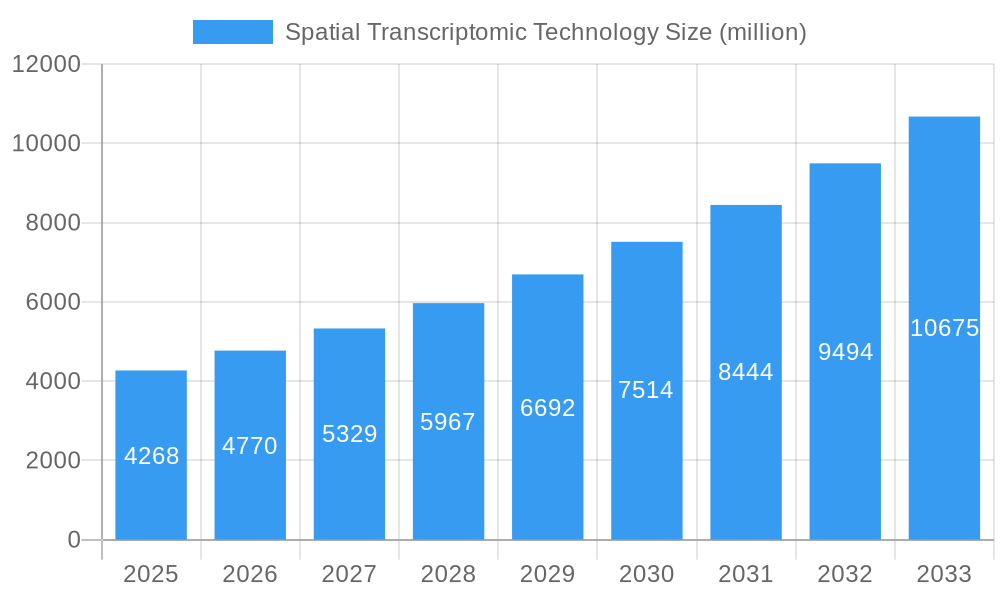
The Spatial Transcriptomic Technology market is experiencing robust expansion, with a projected market size of \$4,268 million. This growth is fueled by an impressive Compound Annual Growth Rate (CAGR) of 11.8%, indicating a dynamic and rapidly evolving landscape. The market's trajectory is significantly propelled by advancements in understanding complex biological processes at a granular level. Key applications in Pathology, Immunology, Developmental Biology, Oncology, and Neuroscience are driving demand as researchers seek to unravel spatial gene expression patterns for more precise diagnostics and targeted therapeutics. The increasing need for high-resolution tissue analysis in drug discovery and development further underpins this growth. Innovations in technologies such as Spatial Transcriptome Technology Leveraging In Situ Capture and Spatial Transcriptome Technology Based on In Situ Hybridization are making intricate molecular profiling more accessible and efficient, thereby broadening the market's reach. Emerging trends point towards the integration of spatial transcriptomics with other omics technologies, promising a more comprehensive view of cellular microenvironments and their influence on disease progression.
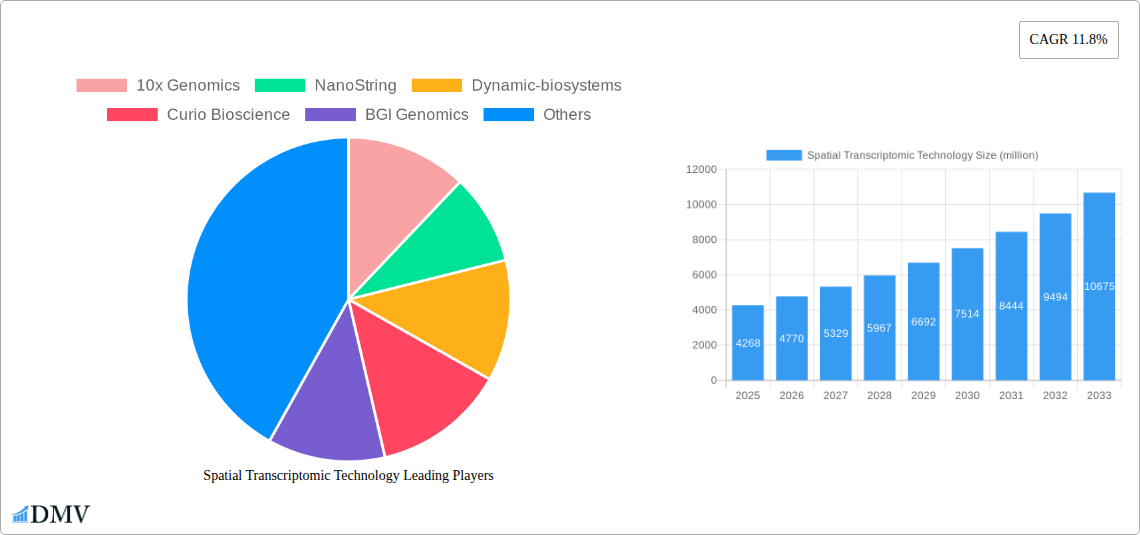
Spatial Transcriptomic Technology Market Size (In Billion)

The market's momentum is further bolstered by a wave of technological innovation and increasing investments in life sciences research. Leading companies like 10x Genomics and NanoString are at the forefront, developing cutting-edge solutions that enable deeper biological insights. While the market exhibits strong growth drivers, potential restraints such as the high cost of specialized equipment and the need for sophisticated bioinformatics analysis are present. However, ongoing technological refinements and the potential for cost reduction with wider adoption are expected to mitigate these challenges. Geographically, North America and Europe are anticipated to dominate the market due to established research infrastructure and significant R&D spending. The Asia Pacific region, particularly China and Japan, is emerging as a significant growth hub, driven by increasing government support for life sciences and a burgeoning biotechnology sector. The forecast period, from 2025 to 2033, is poised to witness substantial market expansion, transforming our understanding of biology and revolutionizing disease treatment paradigms.
Spatial Transcriptomic Technology Company Market Share
Spatial Transcriptomic Technology Market Composition & Trends
The global spatial transcriptomic technology market is a dynamic and rapidly evolving landscape, projected to reach a valuation exceeding one million US dollars by the forecast year of 2025. Market concentration is moderately fragmented, with key players like 10x Genomics, NanoString, Vizgen Inc., and Curio Bioscience vying for significant market share. Innovation catalysts are primarily driven by advancements in in situ capture and in situ hybridization techniques, enabling unprecedented resolution in cellular and molecular profiling. The regulatory landscape, while still maturing, is increasingly favorable for novel diagnostic and research tools, with a growing emphasis on precision medicine applications. Substitute products, primarily bulk RNA sequencing, are gradually being superseded by spatial technologies that offer superior spatial context. End-user profiles are diverse, encompassing academic research institutions, pharmaceutical and biotechnology companies, and clinical pathology labs. Merger and acquisition (M&A) activities are expected to gain momentum, with estimated deal values reaching one million US dollars, as larger entities seek to integrate cutting-edge spatial solutions into their portfolios. Key trends indicate a strong upward trajectory, fueled by increasing investment in life sciences and a growing demand for detailed cellular atlases.
- Market Share Distribution: Dominated by a few key innovators, with significant potential for emerging players.
- M&A Deal Values: Expected to exceed one million US dollars as consolidation drives market maturity.
- Innovation Catalysts: Novel probe design, improved imaging modalities, and advanced computational analysis.
- End-User Segments: Academic research (40%), Pharmaceutical & Biotechnology (35%), Clinical Diagnostics (20%), Others (5%).
Spatial Transcriptomic Technology Industry Evolution
The spatial transcriptomic technology industry has undergone a transformative evolution, moving from niche academic research tools to mainstream platforms with immense clinical and biological significance. From the historical period of 2019-2024, characterized by early-stage adoption and proof-of-concept studies, the market has witnessed a significant acceleration. The study period, spanning 2019-2033, encapsulates this rapid growth trajectory. The base year of 2025 signifies a pivotal point where widespread commercialization and clinical integration are becoming realities. Technological advancements, particularly in spatial transcriptome technology leveraging in situ capture and spatial transcriptome technology based on in situ hybridization, have been the primary engine of this evolution. These technologies have moved beyond simply identifying gene expression to precisely mapping it within its native tissue environment, providing invaluable spatial context. This has unlocked new avenues for understanding complex biological processes and disease mechanisms. Market growth rates have been consistently high, often exceeding one million percent year-over-year in nascent stages and projected to maintain robust double-digit growth throughout the forecast period of 2025-2033. Adoption metrics, such as the number of research publications and the increasing integration into preclinical and clinical workflows, underscore this pervasive impact. Shifting consumer demands, driven by the pursuit of personalized medicine and a deeper understanding of cellular heterogeneity, have further propelled the industry forward. The ability to visualize gene expression patterns in relation to cellular morphology and microenvironment is revolutionizing fields from oncology to neuroscience. Companies like BGI Genomics and AtlasXomics Inc. are at the forefront, developing innovative solutions that are making these powerful technologies more accessible and scalable. The industry is no longer defined by its technical complexity but by its demonstrable impact on biological discovery and therapeutic development. This sustained growth is further supported by increasing investments from venture capital and strategic partnerships between technology providers and pharmaceutical giants. The demand for high-resolution, spatially resolved molecular data is expected to continue its exponential rise, solidifying spatial transcriptomics as a cornerstone of modern biological research and diagnostics.
Leading Regions, Countries, or Segments in Spatial Transcriptomic Technology
The global spatial transcriptomic technology market is witnessing dominant growth driven by a confluence of factors, with North America, particularly the United States, emerging as the leading region. This dominance is intricately linked to robust investment in life sciences research, a highly developed biotechnology sector, and a strong presence of pioneering companies such as 10x Genomics and Vizgen Inc. The United States consistently exhibits high adoption rates for novel technologies, supported by significant government funding for research institutions and a thriving venture capital ecosystem that actively fuels innovation in the spatial transcriptome technology leveraging in situ capture space. Furthermore, the established infrastructure for clinical trials and the increasing integration of spatial transcriptomics into oncology and pathology research pipelines solidify its leading position.
Within the application segments, Oncology stands out as a major driver of market expansion. The ability of spatial transcriptomics to dissect the tumor microenvironment, identify immune cell infiltration patterns, and understand drug resistance mechanisms is invaluable for developing targeted therapies and improving patient outcomes. This is closely followed by Immunology, where spatial insights into immune cell interactions and signaling pathways are crucial for understanding autoimmune diseases, infectious diseases, and vaccine development. Neuroscience is also a rapidly growing segment, benefiting from the technology's capacity to map neuronal connectivity and gene expression patterns in the complex brain architecture.
In terms of technology type, Spatial Transcriptome Technology Leveraging In Situ Capture is currently at the forefront, offering high resolution and detailed spatial information. However, Spatial Transcriptome Technology Based on In Situ Hybridization is rapidly gaining traction due to its established workflows and broad applicability, particularly in diagnostics.
Key drivers for this regional and segmental dominance include:
- Investment Trends: Substantial government and private sector funding in the US, particularly in areas like cancer research and precision medicine.
- Regulatory Support: Favorable regulatory pathways for novel diagnostic and therapeutic development leveraging spatial data.
- Academic Excellence: Leading universities and research institutes at the forefront of spatial biology discovery, fostering innovation and talent.
- Biotechnology Hubs: Concentration of major biotech companies and research organizations driving demand and adoption.
- Clinical Translation: Growing focus on translating spatial transcriptomic findings into clinical applications, especially in oncology and pathology.
The sustained growth in these leading regions and segments is indicative of the profound impact spatial transcriptomics is having on biological discovery and its increasing translation into clinical practice.
Spatial Transcriptomic Technology Product Innovations
Product innovations in spatial transcriptomic technology are rapidly enhancing resolution, throughput, and accessibility. Leading companies are continuously refining in situ capture and in situ hybridization techniques, enabling single-cell and even subcellular resolution of gene expression within intact tissues. These advancements allow for unprecedented insights into cellular heterogeneity, cell-cell interactions, and tissue architecture. Key developments include novel probe designs for broader transcript coverage, improved imaging modalities for faster and more sensitive detection, and integrated computational pipelines for streamlined data analysis. For instance, platforms now offer capabilities to profile tens of thousands of genes per cell with millions of transcripts detected, providing rich datasets for downstream analysis. These innovations are crucial for unraveling complex biological processes in fields such as pathology, immunology, and neuroscience.
Propelling Factors for Spatial Transcriptomic Technology Growth
The exponential growth of the spatial transcriptomic technology market is propelled by several key factors. Foremost is the relentless pace of technological advancements, particularly in in situ capture and in situ hybridization, which are providing higher resolution, greater sensitivity, and expanded throughput. Economically, increasing global investments in life sciences research and development, coupled with a growing demand for precision medicine approaches in oncology and neuroscience, are creating a fertile ground for adoption. Regulatory bodies are also becoming more receptive to data generated by spatial transcriptomics for drug discovery and diagnostics, further fueling market expansion. The intrinsic need to understand the spatial context of biological processes, which bulk sequencing cannot provide, is a fundamental driver.
Obstacles in the Spatial Transcriptomic Technology Market
Despite its immense potential, the spatial transcriptomic technology market faces several significant obstacles. High upfront costs associated with sophisticated instrumentation and reagents can be a barrier for some research institutions and smaller biotech firms. Regulatory challenges persist as standardized protocols and validation frameworks for clinical applications are still under development. Supply chain disruptions for specialized reagents and consumables can also impact accessibility and scalability. Furthermore, intense competitive pressures among established players and emerging startups necessitate continuous innovation and cost optimization to maintain market share. The complexity of data analysis and the need for specialized bioinformatics expertise also represent a hurdle for widespread adoption.
Future Opportunities in Spatial Transcriptomic Technology
The future of spatial transcriptomic technology is ripe with emerging opportunities. Expansion into new geographic markets, particularly in Asia-Pacific and emerging economies, presents significant growth potential. The development of more affordable and user-friendly platforms will broaden accessibility, driving adoption across a wider range of research and clinical settings. Furthermore, the integration of spatial transcriptomics with other multi-omics approaches, such as single-cell proteomics and epigenomics, will unlock even deeper biological insights. The growing demand for detailed cellular atlases in drug discovery and development, especially in immunology and oncology, will continue to fuel innovation and market expansion. The increasing focus on infectious diseases and rare genetic disorders also presents new avenues for application.
Major Players in the Spatial Transcriptomic Technology Ecosystem
- 10x Genomics
- NanoString
- Dynamic-biosystems
- Curio Bioscience
- BGI Genomics
- Laboratory of Computational Biology
- Salus BioMed
- AtlasXomics Inc.
- uwGuLab
- Vizgen Inc
Key Developments in Spatial Transcriptomic Technology Industry
- 2019: Launch of early-generation spatial transcriptomic platforms, demonstrating proof-of-concept for in situ gene expression profiling.
- 2020: Increased adoption of spatial transcriptomics in oncology research for tumor microenvironment analysis.
- 2021: Significant advancements in probe design and imaging technologies, enhancing resolution and sensitivity.
- 2022: Emergence of new players and increased venture capital funding in the spatial biology sector.
- 2023: Growing integration of spatial transcriptomic data into preclinical drug development pipelines.
- 2024: Focus on developing more streamlined workflows and user-friendly interfaces for broader accessibility.
- 2025 (Projected): Increased clinical validation studies and early-stage translation into diagnostic applications.
Strategic Spatial Transcriptomic Technology Market Forecast
The strategic market forecast for spatial transcriptomic technology indicates sustained robust growth, driven by ongoing technological innovation and increasing demand for high-resolution biological data. The in situ capture and in situ hybridization segments are poised for significant expansion, fueled by their critical roles in understanding complex disease mechanisms in oncology, immunology, and neuroscience. Emerging applications in developmental biology and other research areas will further diversify the market. Continued investment in research and development, coupled with strategic partnerships and potential M&A activities, will solidify the market's trajectory. The increasing translation of spatial insights into clinical diagnostics and therapeutics represents a key growth catalyst, promising a future where spatial transcriptomics is an indispensable tool in personalized medicine.
Spatial Transcriptomic Technology Segmentation
-
1. Application
- 1.1. Pathology
- 1.2. Immunology
- 1.3. Developmental Biology
- 1.4. Oncology
- 1.5. Neuroscience
- 1.6. Other
-
2. Type
- 2.1. Spatial Transcriptome Technology Leveraging In Situ Capture
- 2.2. Spatial Transcriptome Technology Based on In Situ Hybridization
- 2.3. Other
Spatial Transcriptomic Technology Segmentation By Geography
-
1. North America
- 1.1. United States
- 1.2. Canada
- 1.3. Mexico
-
2. South America
- 2.1. Brazil
- 2.2. Argentina
- 2.3. Rest of South America
-
3. Europe
- 3.1. United Kingdom
- 3.2. Germany
- 3.3. France
- 3.4. Italy
- 3.5. Spain
- 3.6. Russia
- 3.7. Benelux
- 3.8. Nordics
- 3.9. Rest of Europe
-
4. Middle East & Africa
- 4.1. Turkey
- 4.2. Israel
- 4.3. GCC
- 4.4. North Africa
- 4.5. South Africa
- 4.6. Rest of Middle East & Africa
-
5. Asia Pacific
- 5.1. China
- 5.2. India
- 5.3. Japan
- 5.4. South Korea
- 5.5. ASEAN
- 5.6. Oceania
- 5.7. Rest of Asia Pacific
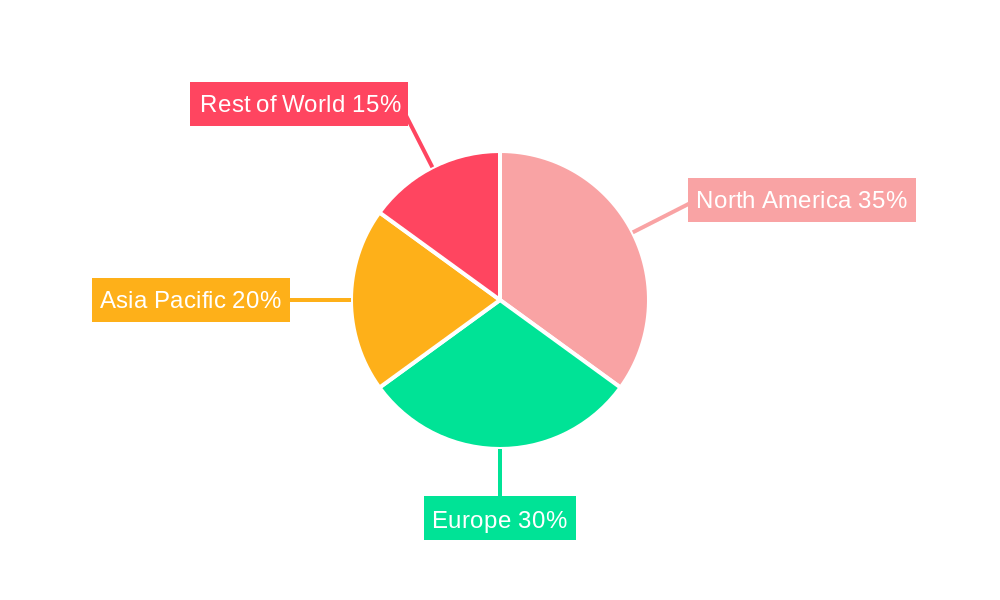
Spatial Transcriptomic Technology Regional Market Share
Geographic Coverage of Spatial Transcriptomic Technology
Spatial Transcriptomic Technology REPORT HIGHLIGHTS
| Aspects | Details |
|---|---|
| Study Period | 2020-2034 |
| Base Year | 2025 |
| Estimated Year | 2026 |
| Forecast Period | 2026-2034 |
| Historical Period | 2020-2025 |
| Growth Rate | CAGR of 14.38% from 2020-2034 |
| Segmentation |
|
Table of Contents
- 1. Introduction
- 1.1. Research Scope
- 1.2. Market Segmentation
- 1.3. Research Objective
- 1.4. Definitions and Assumptions
- 2. Executive Summary
- 2.1. Market Snapshot
- 3. Market Dynamics
- 3.1. Market Drivers
- 3.2. Market Restrains
- 3.3. Market Trends
- 3.4. Market Opportunities
- 4. Market Factor Analysis
- 4.1. Porters Five Forces
- 4.1.1. Bargaining Power of Suppliers
- 4.1.2. Bargaining Power of Buyers
- 4.1.3. Threat of New Entrants
- 4.1.4. Threat of Substitutes
- 4.1.5. Competitive Rivalry
- 4.2. PESTEL analysis
- 4.3. BCG Analysis
- 4.3.1. Stars (High Growth, High Market Share)
- 4.3.2. Cash Cows (Low Growth, High Market Share)
- 4.3.3. Question Mark (High Growth, Low Market Share)
- 4.3.4. Dogs (Low Growth, Low Market Share)
- 4.4. Ansoff Matrix Analysis
- 4.5. Supply Chain Analysis
- 4.6. Regulatory Landscape
- 4.7. Current Market Potential and Opportunity Assessment (TAM–SAM–SOM Framework)
- 4.8. DMV Analyst Note
- 4.1. Porters Five Forces
- 5. Market Analysis, Insights and Forecast 2021-2033
- 5.1. Market Analysis, Insights and Forecast - by Application
- 5.1.1. Pathology
- 5.1.2. Immunology
- 5.1.3. Developmental Biology
- 5.1.4. Oncology
- 5.1.5. Neuroscience
- 5.1.6. Other
- 5.2. Market Analysis, Insights and Forecast - by Type
- 5.2.1. Spatial Transcriptome Technology Leveraging In Situ Capture
- 5.2.2. Spatial Transcriptome Technology Based on In Situ Hybridization
- 5.2.3. Other
- 5.3. Market Analysis, Insights and Forecast - by Region
- 5.3.1. North America
- 5.3.2. South America
- 5.3.3. Europe
- 5.3.4. Middle East & Africa
- 5.3.5. Asia Pacific
- 5.1. Market Analysis, Insights and Forecast - by Application
- 6. Global Spatial Transcriptomic Technology Analysis, Insights and Forecast, 2021-2033
- 6.1. Market Analysis, Insights and Forecast - by Application
- 6.1.1. Pathology
- 6.1.2. Immunology
- 6.1.3. Developmental Biology
- 6.1.4. Oncology
- 6.1.5. Neuroscience
- 6.1.6. Other
- 6.2. Market Analysis, Insights and Forecast - by Type
- 6.2.1. Spatial Transcriptome Technology Leveraging In Situ Capture
- 6.2.2. Spatial Transcriptome Technology Based on In Situ Hybridization
- 6.2.3. Other
- 6.1. Market Analysis, Insights and Forecast - by Application
- 7. North America Spatial Transcriptomic Technology Analysis, Insights and Forecast, 2020-2032
- 7.1. Market Analysis, Insights and Forecast - by Application
- 7.1.1. Pathology
- 7.1.2. Immunology
- 7.1.3. Developmental Biology
- 7.1.4. Oncology
- 7.1.5. Neuroscience
- 7.1.6. Other
- 7.2. Market Analysis, Insights and Forecast - by Type
- 7.2.1. Spatial Transcriptome Technology Leveraging In Situ Capture
- 7.2.2. Spatial Transcriptome Technology Based on In Situ Hybridization
- 7.2.3. Other
- 7.1. Market Analysis, Insights and Forecast - by Application
- 8. South America Spatial Transcriptomic Technology Analysis, Insights and Forecast, 2020-2032
- 8.1. Market Analysis, Insights and Forecast - by Application
- 8.1.1. Pathology
- 8.1.2. Immunology
- 8.1.3. Developmental Biology
- 8.1.4. Oncology
- 8.1.5. Neuroscience
- 8.1.6. Other
- 8.2. Market Analysis, Insights and Forecast - by Type
- 8.2.1. Spatial Transcriptome Technology Leveraging In Situ Capture
- 8.2.2. Spatial Transcriptome Technology Based on In Situ Hybridization
- 8.2.3. Other
- 8.1. Market Analysis, Insights and Forecast - by Application
- 9. Europe Spatial Transcriptomic Technology Analysis, Insights and Forecast, 2020-2032
- 9.1. Market Analysis, Insights and Forecast - by Application
- 9.1.1. Pathology
- 9.1.2. Immunology
- 9.1.3. Developmental Biology
- 9.1.4. Oncology
- 9.1.5. Neuroscience
- 9.1.6. Other
- 9.2. Market Analysis, Insights and Forecast - by Type
- 9.2.1. Spatial Transcriptome Technology Leveraging In Situ Capture
- 9.2.2. Spatial Transcriptome Technology Based on In Situ Hybridization
- 9.2.3. Other
- 9.1. Market Analysis, Insights and Forecast - by Application
- 10. Middle East & Africa Spatial Transcriptomic Technology Analysis, Insights and Forecast, 2020-2032
- 10.1. Market Analysis, Insights and Forecast - by Application
- 10.1.1. Pathology
- 10.1.2. Immunology
- 10.1.3. Developmental Biology
- 10.1.4. Oncology
- 10.1.5. Neuroscience
- 10.1.6. Other
- 10.2. Market Analysis, Insights and Forecast - by Type
- 10.2.1. Spatial Transcriptome Technology Leveraging In Situ Capture
- 10.2.2. Spatial Transcriptome Technology Based on In Situ Hybridization
- 10.2.3. Other
- 10.1. Market Analysis, Insights and Forecast - by Application
- 11. Asia Pacific Spatial Transcriptomic Technology Analysis, Insights and Forecast, 2020-2032
- 11.1. Market Analysis, Insights and Forecast - by Application
- 11.1.1. Pathology
- 11.1.2. Immunology
- 11.1.3. Developmental Biology
- 11.1.4. Oncology
- 11.1.5. Neuroscience
- 11.1.6. Other
- 11.2. Market Analysis, Insights and Forecast - by Type
- 11.2.1. Spatial Transcriptome Technology Leveraging In Situ Capture
- 11.2.2. Spatial Transcriptome Technology Based on In Situ Hybridization
- 11.2.3. Other
- 11.1. Market Analysis, Insights and Forecast - by Application
- 12. Competitive Analysis
- 12.1. Company Profiles
- 12.1.1 10x Genomics
- 12.1.1.1. Company Overview
- 12.1.1.2. Products
- 12.1.1.3. Company Financials
- 12.1.1.4. SWOT Analysis
- 12.1.2 NanoString
- 12.1.2.1. Company Overview
- 12.1.2.2. Products
- 12.1.2.3. Company Financials
- 12.1.2.4. SWOT Analysis
- 12.1.3 Dynamic-biosystems
- 12.1.3.1. Company Overview
- 12.1.3.2. Products
- 12.1.3.3. Company Financials
- 12.1.3.4. SWOT Analysis
- 12.1.4 Curio Bioscience
- 12.1.4.1. Company Overview
- 12.1.4.2. Products
- 12.1.4.3. Company Financials
- 12.1.4.4. SWOT Analysis
- 12.1.5 BGI Genomics
- 12.1.5.1. Company Overview
- 12.1.5.2. Products
- 12.1.5.3. Company Financials
- 12.1.5.4. SWOT Analysis
- 12.1.6 Laboratory of Computational Biology
- 12.1.6.1. Company Overview
- 12.1.6.2. Products
- 12.1.6.3. Company Financials
- 12.1.6.4. SWOT Analysis
- 12.1.7 Salus BioMed
- 12.1.7.1. Company Overview
- 12.1.7.2. Products
- 12.1.7.3. Company Financials
- 12.1.7.4. SWOT Analysis
- 12.1.8 AtlasXomics Inc.
- 12.1.8.1. Company Overview
- 12.1.8.2. Products
- 12.1.8.3. Company Financials
- 12.1.8.4. SWOT Analysis
- 12.1.9 uwGuLab
- 12.1.9.1. Company Overview
- 12.1.9.2. Products
- 12.1.9.3. Company Financials
- 12.1.9.4. SWOT Analysis
- 12.1.10 Vizgen Inc
- 12.1.10.1. Company Overview
- 12.1.10.2. Products
- 12.1.10.3. Company Financials
- 12.1.10.4. SWOT Analysis
- 12.1.1 10x Genomics
- 12.2. Market Entropy
- 12.2.1 Company's Key Areas Served
- 12.2.2 Recent Developments
- 12.3. Company Market Share Analysis 2025
- 12.3.1 Top 5 Companies Market Share Analysis
- 12.3.2 Top 3 Companies Market Share Analysis
- 12.4. List of Potential Customers
- 13. Research Methodology
List of Figures
- Figure 1: Global Spatial Transcriptomic Technology Revenue Breakdown (million, %) by Region 2025 & 2033
- Figure 2: North America Spatial Transcriptomic Technology Revenue (million), by Application 2025 & 2033
- Figure 3: North America Spatial Transcriptomic Technology Revenue Share (%), by Application 2025 & 2033
- Figure 4: North America Spatial Transcriptomic Technology Revenue (million), by Type 2025 & 2033
- Figure 5: North America Spatial Transcriptomic Technology Revenue Share (%), by Type 2025 & 2033
- Figure 6: North America Spatial Transcriptomic Technology Revenue (million), by Country 2025 & 2033
- Figure 7: North America Spatial Transcriptomic Technology Revenue Share (%), by Country 2025 & 2033
- Figure 8: South America Spatial Transcriptomic Technology Revenue (million), by Application 2025 & 2033
- Figure 9: South America Spatial Transcriptomic Technology Revenue Share (%), by Application 2025 & 2033
- Figure 10: South America Spatial Transcriptomic Technology Revenue (million), by Type 2025 & 2033
- Figure 11: South America Spatial Transcriptomic Technology Revenue Share (%), by Type 2025 & 2033
- Figure 12: South America Spatial Transcriptomic Technology Revenue (million), by Country 2025 & 2033
- Figure 13: South America Spatial Transcriptomic Technology Revenue Share (%), by Country 2025 & 2033
- Figure 14: Europe Spatial Transcriptomic Technology Revenue (million), by Application 2025 & 2033
- Figure 15: Europe Spatial Transcriptomic Technology Revenue Share (%), by Application 2025 & 2033
- Figure 16: Europe Spatial Transcriptomic Technology Revenue (million), by Type 2025 & 2033
- Figure 17: Europe Spatial Transcriptomic Technology Revenue Share (%), by Type 2025 & 2033
- Figure 18: Europe Spatial Transcriptomic Technology Revenue (million), by Country 2025 & 2033
- Figure 19: Europe Spatial Transcriptomic Technology Revenue Share (%), by Country 2025 & 2033
- Figure 20: Middle East & Africa Spatial Transcriptomic Technology Revenue (million), by Application 2025 & 2033
- Figure 21: Middle East & Africa Spatial Transcriptomic Technology Revenue Share (%), by Application 2025 & 2033
- Figure 22: Middle East & Africa Spatial Transcriptomic Technology Revenue (million), by Type 2025 & 2033
- Figure 23: Middle East & Africa Spatial Transcriptomic Technology Revenue Share (%), by Type 2025 & 2033
- Figure 24: Middle East & Africa Spatial Transcriptomic Technology Revenue (million), by Country 2025 & 2033
- Figure 25: Middle East & Africa Spatial Transcriptomic Technology Revenue Share (%), by Country 2025 & 2033
- Figure 26: Asia Pacific Spatial Transcriptomic Technology Revenue (million), by Application 2025 & 2033
- Figure 27: Asia Pacific Spatial Transcriptomic Technology Revenue Share (%), by Application 2025 & 2033
- Figure 28: Asia Pacific Spatial Transcriptomic Technology Revenue (million), by Type 2025 & 2033
- Figure 29: Asia Pacific Spatial Transcriptomic Technology Revenue Share (%), by Type 2025 & 2033
- Figure 30: Asia Pacific Spatial Transcriptomic Technology Revenue (million), by Country 2025 & 2033
- Figure 31: Asia Pacific Spatial Transcriptomic Technology Revenue Share (%), by Country 2025 & 2033
List of Tables
- Table 1: Global Spatial Transcriptomic Technology Revenue million Forecast, by Application 2020 & 2033
- Table 2: Global Spatial Transcriptomic Technology Revenue million Forecast, by Type 2020 & 2033
- Table 3: Global Spatial Transcriptomic Technology Revenue million Forecast, by Region 2020 & 2033
- Table 4: Global Spatial Transcriptomic Technology Revenue million Forecast, by Application 2020 & 2033
- Table 5: Global Spatial Transcriptomic Technology Revenue million Forecast, by Type 2020 & 2033
- Table 6: Global Spatial Transcriptomic Technology Revenue million Forecast, by Country 2020 & 2033
- Table 7: United States Spatial Transcriptomic Technology Revenue (million) Forecast, by Application 2020 & 2033
- Table 8: Canada Spatial Transcriptomic Technology Revenue (million) Forecast, by Application 2020 & 2033
- Table 9: Mexico Spatial Transcriptomic Technology Revenue (million) Forecast, by Application 2020 & 2033
- Table 10: Global Spatial Transcriptomic Technology Revenue million Forecast, by Application 2020 & 2033
- Table 11: Global Spatial Transcriptomic Technology Revenue million Forecast, by Type 2020 & 2033
- Table 12: Global Spatial Transcriptomic Technology Revenue million Forecast, by Country 2020 & 2033
- Table 13: Brazil Spatial Transcriptomic Technology Revenue (million) Forecast, by Application 2020 & 2033
- Table 14: Argentina Spatial Transcriptomic Technology Revenue (million) Forecast, by Application 2020 & 2033
- Table 15: Rest of South America Spatial Transcriptomic Technology Revenue (million) Forecast, by Application 2020 & 2033
- Table 16: Global Spatial Transcriptomic Technology Revenue million Forecast, by Application 2020 & 2033
- Table 17: Global Spatial Transcriptomic Technology Revenue million Forecast, by Type 2020 & 2033
- Table 18: Global Spatial Transcriptomic Technology Revenue million Forecast, by Country 2020 & 2033
- Table 19: United Kingdom Spatial Transcriptomic Technology Revenue (million) Forecast, by Application 2020 & 2033
- Table 20: Germany Spatial Transcriptomic Technology Revenue (million) Forecast, by Application 2020 & 2033
- Table 21: France Spatial Transcriptomic Technology Revenue (million) Forecast, by Application 2020 & 2033
- Table 22: Italy Spatial Transcriptomic Technology Revenue (million) Forecast, by Application 2020 & 2033
- Table 23: Spain Spatial Transcriptomic Technology Revenue (million) Forecast, by Application 2020 & 2033
- Table 24: Russia Spatial Transcriptomic Technology Revenue (million) Forecast, by Application 2020 & 2033
- Table 25: Benelux Spatial Transcriptomic Technology Revenue (million) Forecast, by Application 2020 & 2033
- Table 26: Nordics Spatial Transcriptomic Technology Revenue (million) Forecast, by Application 2020 & 2033
- Table 27: Rest of Europe Spatial Transcriptomic Technology Revenue (million) Forecast, by Application 2020 & 2033
- Table 28: Global Spatial Transcriptomic Technology Revenue million Forecast, by Application 2020 & 2033
- Table 29: Global Spatial Transcriptomic Technology Revenue million Forecast, by Type 2020 & 2033
- Table 30: Global Spatial Transcriptomic Technology Revenue million Forecast, by Country 2020 & 2033
- Table 31: Turkey Spatial Transcriptomic Technology Revenue (million) Forecast, by Application 2020 & 2033
- Table 32: Israel Spatial Transcriptomic Technology Revenue (million) Forecast, by Application 2020 & 2033
- Table 33: GCC Spatial Transcriptomic Technology Revenue (million) Forecast, by Application 2020 & 2033
- Table 34: North Africa Spatial Transcriptomic Technology Revenue (million) Forecast, by Application 2020 & 2033
- Table 35: South Africa Spatial Transcriptomic Technology Revenue (million) Forecast, by Application 2020 & 2033
- Table 36: Rest of Middle East & Africa Spatial Transcriptomic Technology Revenue (million) Forecast, by Application 2020 & 2033
- Table 37: Global Spatial Transcriptomic Technology Revenue million Forecast, by Application 2020 & 2033
- Table 38: Global Spatial Transcriptomic Technology Revenue million Forecast, by Type 2020 & 2033
- Table 39: Global Spatial Transcriptomic Technology Revenue million Forecast, by Country 2020 & 2033
- Table 40: China Spatial Transcriptomic Technology Revenue (million) Forecast, by Application 2020 & 2033
- Table 41: India Spatial Transcriptomic Technology Revenue (million) Forecast, by Application 2020 & 2033
- Table 42: Japan Spatial Transcriptomic Technology Revenue (million) Forecast, by Application 2020 & 2033
- Table 43: South Korea Spatial Transcriptomic Technology Revenue (million) Forecast, by Application 2020 & 2033
- Table 44: ASEAN Spatial Transcriptomic Technology Revenue (million) Forecast, by Application 2020 & 2033
- Table 45: Oceania Spatial Transcriptomic Technology Revenue (million) Forecast, by Application 2020 & 2033
- Table 46: Rest of Asia Pacific Spatial Transcriptomic Technology Revenue (million) Forecast, by Application 2020 & 2033
Frequently Asked Questions
1. What is the projected Compound Annual Growth Rate (CAGR) of the Spatial Transcriptomic Technology?
The projected CAGR is approximately 14.38%.
2. Which companies are prominent players in the Spatial Transcriptomic Technology?
Key companies in the market include 10x Genomics, NanoString, Dynamic-biosystems, Curio Bioscience, BGI Genomics, Laboratory of Computational Biology, Salus BioMed, AtlasXomics Inc., uwGuLab, Vizgen Inc.
3. What are the main segments of the Spatial Transcriptomic Technology?
The market segments include Application, Type.
4. Can you provide details about the market size?
The market size is estimated to be USD 265.93 million as of 2022.
5. What are some drivers contributing to market growth?
N/A
6. What are the notable trends driving market growth?
N/A
7. Are there any restraints impacting market growth?
N/A
8. Can you provide examples of recent developments in the market?
N/A
9. What pricing options are available for accessing the report?
Pricing options include single-user, multi-user, and enterprise licenses priced at USD 2900.00, USD 4350.00, and USD 5800.00 respectively.
10. Is the market size provided in terms of value or volume?
The market size is provided in terms of value, measured in million.
11. Are there any specific market keywords associated with the report?
Yes, the market keyword associated with the report is "Spatial Transcriptomic Technology," which aids in identifying and referencing the specific market segment covered.
12. How do I determine which pricing option suits my needs best?
The pricing options vary based on user requirements and access needs. Individual users may opt for single-user licenses, while businesses requiring broader access may choose multi-user or enterprise licenses for cost-effective access to the report.
13. Are there any additional resources or data provided in the Spatial Transcriptomic Technology report?
While the report offers comprehensive insights, it's advisable to review the specific contents or supplementary materials provided to ascertain if additional resources or data are available.
14. How can I stay updated on further developments or reports in the Spatial Transcriptomic Technology?
To stay informed about further developments, trends, and reports in the Spatial Transcriptomic Technology, consider subscribing to industry newsletters, following relevant companies and organizations, or regularly checking reputable industry news sources and publications.
Methodology
Step 1 - Identification of Relevant Samples Size from Population Database



Step 2 - Approaches for Defining Global Market Size (Value, Volume* & Price*)

Note*: In applicable scenarios
Step 3 - Data Sources
Primary Research
- Web Analytics
- Survey Reports
- Research Institute
- Latest Research Reports
- Opinion Leaders
Secondary Research
- Annual Reports
- White Paper
- Latest Press Release
- Industry Association
- Paid Database
- Investor Presentations

Step 4 - Data Triangulation
Involves using different sources of information in order to increase the validity of a study
These sources are likely to be stakeholders in a program - participants, other researchers, program staff, other community members, and so on.
Then we put all data in single framework & apply various statistical tools to find out the dynamic on the market.
During the analysis stage, feedback from the stakeholder groups would be compared to determine areas of agreement as well as areas of divergence