

Key Insights
The global smart healthcare market is poised for significant expansion, driven by the increasing burden of chronic diseases, widespread telehealth adoption, and the imperative for enhanced patient care and outcomes. With a projected Compound Annual Growth Rate (CAGR) of 13.41%, the market, valued at $252.39 billion in the base year of 2025, is expected to witness robust growth through 2033. Key growth catalysts include advancements in artificial intelligence (AI), the Internet of Things (IoT), and big data analytics, which are instrumental in developing innovative solutions for disease management, remote patient monitoring, and personalized medicine. The integration of smart devices, such as wearables and implantable sensors, provides continuous health data, enabling proactive interventions and optimizing treatment efficacy. Furthermore, supportive government initiatives promoting digital health and escalating global healthcare expenditure are contributing to market expansion. The market is segmented by product type (telemedicine, electronic health records, mHealth), application (storage and inventory management, monitoring, treatment), and end-user (hospitals, home care settings). While North America currently leads due to its advanced healthcare infrastructure and high adoption rates, the Asia-Pacific region is anticipated to exhibit substantial growth driven by increasing healthcare investments and a burgeoning middle class. Challenges such as data security and privacy concerns, high implementation costs, and the necessity for robust regulatory frameworks require careful consideration.
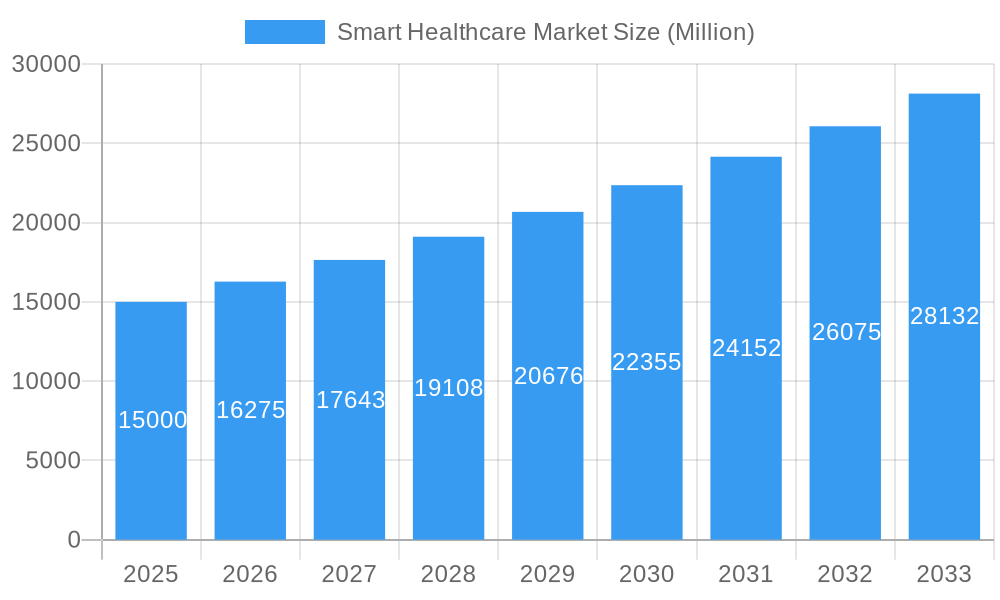
Smart Healthcare Market Market Size (In Billion)
The long-term outlook for the smart healthcare market remains exceptionally positive. Ongoing development of sophisticated and user-friendly technologies, coupled with declining costs and improving connectivity, will further propel market growth. Strategic collaborations between technology firms and healthcare providers are vital for fostering innovation and accelerating the integration of smart healthcare solutions into existing systems. The escalating focus on preventive care and personalized medicine will fuel demand for smart healthcare technologies that facilitate early disease detection, remote patient monitoring, and tailored treatment plans, ultimately leading to improved patient outcomes and enhanced healthcare efficiency. The market will continuously witness innovation in AI-powered diagnostics, predictive analytics, and novel smart medical devices, cementing its role as a transformative force in the healthcare industry.
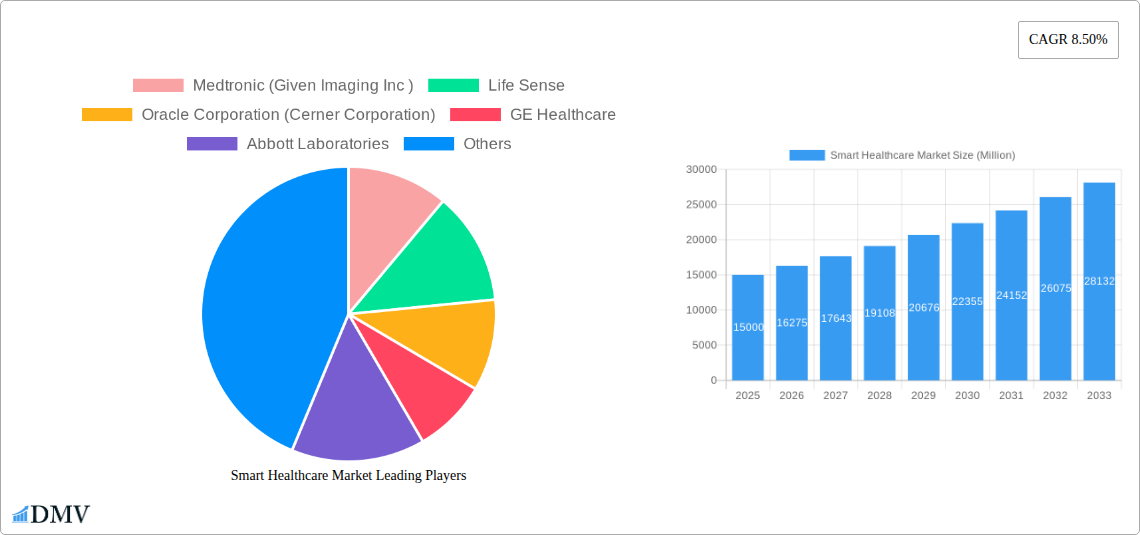
Smart Healthcare Market Company Market Share
Smart Healthcare Market: A Comprehensive Report (2019-2033)
This insightful report provides a comprehensive analysis of the Smart Healthcare market, projecting robust growth from 2025 to 2033. We delve deep into market dynamics, technological advancements, and key players shaping this transformative sector, offering crucial insights for stakeholders seeking to navigate this rapidly evolving landscape. The report covers a detailed analysis from 2019 to 2024, with a focus on the projected figures for 2025 to 2033.
Smart Healthcare Market Composition & Trends
The global Smart Healthcare market, valued at xx Million in 2025, is characterized by a moderately concentrated landscape, with key players like Medtronic, GE Healthcare, and Philips holding significant market share. Innovation is driven by advancements in Artificial Intelligence (AI), Internet of Things (IoT), and Big Data analytics, leading to the development of sophisticated telemedicine platforms, advanced electronic health records (EHRs), and personalized smart medical devices. The regulatory landscape, while evolving, plays a vital role in shaping market adoption, particularly concerning data privacy and security. Substitute products, while limited, are emerging in niche areas, primarily focused on cost-effective solutions. The market's growth trajectory is influenced by factors like the rising prevalence of chronic diseases, aging populations, and increasing demand for accessible and affordable healthcare. Furthermore, Mergers & Acquisitions (M&A) activity has been significant, with deals totaling xx Million in 2024, indicating the strategic importance of the sector.
- Market Share Distribution (2024): Medtronic: xx%, GE Healthcare: xx%, Philips: xx%, Others: xx%
- M&A Deal Value (2019-2024): xx Million
- Key M&A Activities: Strategic acquisitions focusing on expanding product portfolios and geographic reach.
Smart Healthcare Market Industry Evolution
The Smart Healthcare market has witnessed exponential growth, driven by several factors. From 2019 to 2024, the market experienced a Compound Annual Growth Rate (CAGR) of xx%, largely propelled by increasing investments in digital health infrastructure, rising adoption of telehealth services, and the growing demand for remote patient monitoring solutions. Technological advancements, including the development of sophisticated AI-powered diagnostic tools, wearable health trackers, and personalized medicine applications, have further accelerated market expansion. Consumer demand is shifting towards proactive and personalized healthcare solutions, fostering the adoption of smart devices and connected health platforms. We project a CAGR of xx% from 2025 to 2033, driven by the continued integration of AI, IoT, and cloud computing technologies. This will lead to improved patient outcomes, reduced healthcare costs, and enhanced efficiency across healthcare systems. Market penetration of key technologies, such as telemedicine and EHRs, is projected to increase significantly in the forecast period.
Leading Regions, Countries, or Segments in Smart Healthcare Market
North America currently dominates the Smart Healthcare market, driven by significant investments in technological infrastructure, supportive regulatory frameworks, and high healthcare expenditure. However, the Asia-Pacific region is emerging as a key growth area, fueled by increasing government initiatives to improve healthcare accessibility and affordability, and a rapidly expanding middle class.
- By Product Type:
- Telemedicine: High growth potential due to rising demand for remote consultations and monitoring.
- Electronic Health Records (EHRs): Significant market share driven by government mandates and interoperability needs.
- mHealth: Rapid expansion driven by smartphone penetration and the development of user-friendly health apps.
- Key Drivers (North America):
- High healthcare expenditure
- Robust technological infrastructure
- Favorable regulatory environment
- Key Drivers (Asia-Pacific):
- Increasing government investments in healthcare infrastructure
- Rising smartphone and internet penetration
- Growing middle class with increased healthcare spending
Smart Healthcare Market Product Innovations
Recent innovations include AI-powered diagnostic tools that offer faster and more accurate diagnoses, advanced wearable sensors capable of continuously monitoring vital signs, and smart pills and syringes that enhance drug delivery and patient compliance. These innovations are characterized by enhanced accuracy, personalized treatment plans, and improved patient engagement. The integration of IoT and cloud computing technologies allows for seamless data exchange and real-time monitoring, boosting efficiency and effectiveness.
Propelling Factors for Smart Healthcare Market Growth
Several key factors propel the growth of the smart healthcare market. Technological advancements like AI, IoT, and big data analytics are central, enabling more accurate diagnoses, personalized treatment, and proactive healthcare management. Economic incentives such as cost reduction from remote monitoring and preventative care also play a significant role. Favorable government regulations and initiatives supporting digital health adoption accelerate market penetration, while increasing awareness of health and wellness among consumers drives demand for smart health solutions.
Obstacles in the Smart Healthcare Market
The Smart Healthcare market faces several obstacles. Stringent data privacy and security regulations increase implementation complexity and cost. Supply chain disruptions, especially concerning semiconductor components, can impact the availability and affordability of devices. Furthermore, intense competition among established players and emerging startups increases pricing pressure and necessitates continuous innovation to maintain market share.
Future Opportunities in Smart Healthcare Market
Future opportunities lie in expanding into underserved markets, particularly in developing nations, and in developing innovative solutions for chronic disease management. The integration of advanced technologies like extended reality (XR) and blockchain offers potential for enhanced patient engagement and data security. Growing consumer demand for personalized healthcare and preventative care will further drive market expansion.
Major Players in the Smart Healthcare Market Ecosystem
- Medtronic (Medtronic)
- Life Sense
- Oracle Corporation (Oracle) (Cerner Corporation)
- GE Healthcare (GE Healthcare)
- Abbott Laboratories (Abbott Laboratories)
- Siemens Healthineers AG (Siemens Healthineers)
- Next Gen Healthcare
- Koninklijke Philips NV (Philips)
- McKesson Corporation (McKesson)
- Olympus Corporation (Olympus)
- Capsule Technologies Inc
- Samsung Healthcare (Samsung Healthcare)
Key Developments in Smart Healthcare Market Industry
- March 2022: Intuitive MB launched its medical building operating system, leveraging IoT, AI, and machine learning for "smart" hospitals.
- March 2022: Commonwealth Bank introduced "Smart Health," a terminal improving payments and claims for Australian private health insurers.
Strategic Smart Healthcare Market Forecast
The Smart Healthcare market is poised for significant growth, driven by technological innovation and increasing healthcare expenditure globally. The convergence of AI, IoT, and big data analytics will continue to transform healthcare delivery, leading to enhanced efficiency, improved patient outcomes, and new revenue streams for market participants. The rising adoption of remote patient monitoring, personalized medicine, and proactive healthcare solutions will fuel market expansion, creating significant opportunities for businesses operating in this dynamic sector. The forecast period shows strong potential for continued growth and innovation, with considerable market penetration across various segments and regions.
Smart Healthcare Market Segmentation
-
1. Product Type
- 1.1. Telemedicine
- 1.2. Electronic Health Records
- 1.3. mHealth
- 1.4. Smart Pills and Syringes
- 1.5. Smart RFID Cabinets
- 1.6. Other Product Types
-
2. Application
- 2.1. Storage and Inventory Management
- 2.2. Monitoring
- 2.3. Treatment
- 2.4. Other Applications
-
3. End User
- 3.1. Hospitals
- 3.2. Home Care Settings
- 3.3. Other End Users
Smart Healthcare Market Segmentation By Geography
-
1. North America
- 1.1. United States
- 1.2. Canada
- 1.3. Mexico
-
2. Europe
- 2.1. Germany
- 2.2. United Kingdom
- 2.3. France
- 2.4. Spain
- 2.5. Italy
- 2.6. Rest of Europe
-
3. Asia Pacific
- 3.1. China
- 3.2. Japan
- 3.3. India
- 3.4. Australia
- 3.5. South Korea
- 3.6. Rest of Asia Pacific
-
4. Middle East and Africa
- 4.1. GCC
- 4.2. South Africa
- 4.3. Rest of Middle East and Africa
-
5. South America
- 5.1. Brazil
- 5.2. Argentina
- 5.3. Rest of South America
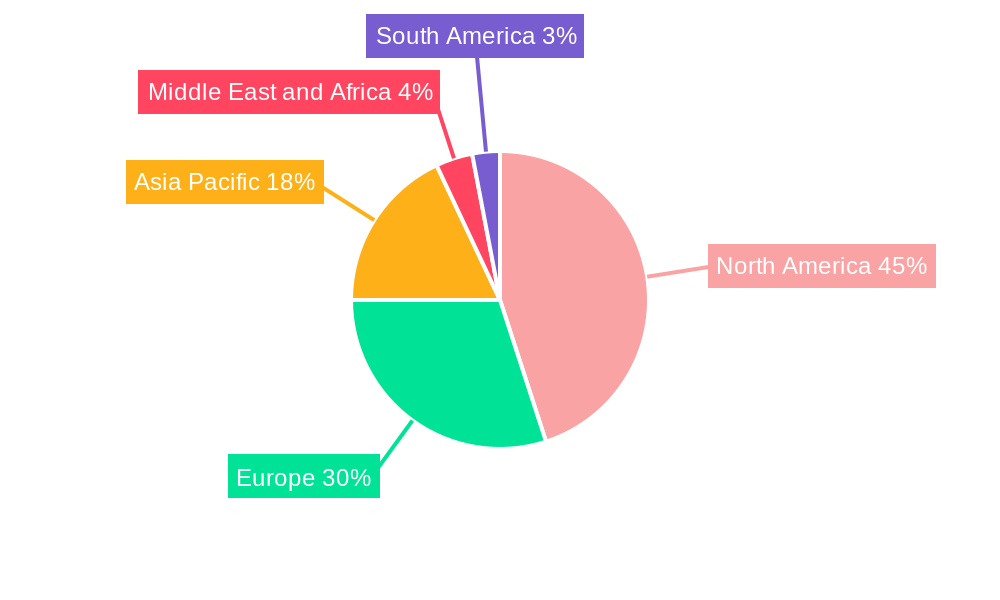
Smart Healthcare Market Regional Market Share
Geographic Coverage of Smart Healthcare Market
Smart Healthcare Market REPORT HIGHLIGHTS
| Aspects | Details |
|---|---|
| Study Period | 2020-2034 |
| Base Year | 2025 |
| Estimated Year | 2026 |
| Forecast Period | 2026-2034 |
| Historical Period | 2020-2025 |
| Growth Rate | CAGR of 13.41% from 2020-2034 |
| Segmentation |
|
Table of Contents
- 1. Introduction
- 1.1. Research Scope
- 1.2. Market Segmentation
- 1.3. Research Objective
- 1.4. Definitions and Assumptions
- 2. Executive Summary
- 2.1. Market Snapshot
- 3. Market Dynamics
- 3.1. Market Drivers
- 3.2. Market Restrains
- 3.3. Market Trends
- 3.4. Market Opportunities
- 4. Market Factor Analysis
- 4.1. Porters Five Forces
- 4.1.1. Bargaining Power of Suppliers
- 4.1.2. Bargaining Power of Buyers
- 4.1.3. Threat of New Entrants
- 4.1.4. Threat of Substitutes
- 4.1.5. Competitive Rivalry
- 4.2. PESTEL analysis
- 4.3. BCG Analysis
- 4.3.1. Stars (High Growth, High Market Share)
- 4.3.2. Cash Cows (Low Growth, High Market Share)
- 4.3.3. Question Mark (High Growth, Low Market Share)
- 4.3.4. Dogs (Low Growth, Low Market Share)
- 4.4. Ansoff Matrix Analysis
- 4.5. Supply Chain Analysis
- 4.6. Regulatory Landscape
- 4.7. Current Market Potential and Opportunity Assessment (TAM–SAM–SOM Framework)
- 4.8. DMV Analyst Note
- 4.1. Porters Five Forces
- 5. Market Analysis, Insights and Forecast 2021-2033
- 5.1. Market Analysis, Insights and Forecast - by Product Type
- 5.1.1. Telemedicine
- 5.1.2. Electronic Health Records
- 5.1.3. mHealth
- 5.1.4. Smart Pills and Syringes
- 5.1.5. Smart RFID Cabinets
- 5.1.6. Other Product Types
- 5.2. Market Analysis, Insights and Forecast - by Application
- 5.2.1. Storage and Inventory Management
- 5.2.2. Monitoring
- 5.2.3. Treatment
- 5.2.4. Other Applications
- 5.3. Market Analysis, Insights and Forecast - by End User
- 5.3.1. Hospitals
- 5.3.2. Home Care Settings
- 5.3.3. Other End Users
- 5.4. Market Analysis, Insights and Forecast - by Region
- 5.4.1. North America
- 5.4.2. Europe
- 5.4.3. Asia Pacific
- 5.4.4. Middle East and Africa
- 5.4.5. South America
- 5.1. Market Analysis, Insights and Forecast - by Product Type
- 6. Global Smart Healthcare Market Analysis, Insights and Forecast, 2021-2033
- 6.1. Market Analysis, Insights and Forecast - by Product Type
- 6.1.1. Telemedicine
- 6.1.2. Electronic Health Records
- 6.1.3. mHealth
- 6.1.4. Smart Pills and Syringes
- 6.1.5. Smart RFID Cabinets
- 6.1.6. Other Product Types
- 6.2. Market Analysis, Insights and Forecast - by Application
- 6.2.1. Storage and Inventory Management
- 6.2.2. Monitoring
- 6.2.3. Treatment
- 6.2.4. Other Applications
- 6.3. Market Analysis, Insights and Forecast - by End User
- 6.3.1. Hospitals
- 6.3.2. Home Care Settings
- 6.3.3. Other End Users
- 6.1. Market Analysis, Insights and Forecast - by Product Type
- 7. North America Smart Healthcare Market Analysis, Insights and Forecast, 2020-2032
- 7.1. Market Analysis, Insights and Forecast - by Product Type
- 7.1.1. Telemedicine
- 7.1.2. Electronic Health Records
- 7.1.3. mHealth
- 7.1.4. Smart Pills and Syringes
- 7.1.5. Smart RFID Cabinets
- 7.1.6. Other Product Types
- 7.2. Market Analysis, Insights and Forecast - by Application
- 7.2.1. Storage and Inventory Management
- 7.2.2. Monitoring
- 7.2.3. Treatment
- 7.2.4. Other Applications
- 7.3. Market Analysis, Insights and Forecast - by End User
- 7.3.1. Hospitals
- 7.3.2. Home Care Settings
- 7.3.3. Other End Users
- 7.1. Market Analysis, Insights and Forecast - by Product Type
- 8. Europe Smart Healthcare Market Analysis, Insights and Forecast, 2020-2032
- 8.1. Market Analysis, Insights and Forecast - by Product Type
- 8.1.1. Telemedicine
- 8.1.2. Electronic Health Records
- 8.1.3. mHealth
- 8.1.4. Smart Pills and Syringes
- 8.1.5. Smart RFID Cabinets
- 8.1.6. Other Product Types
- 8.2. Market Analysis, Insights and Forecast - by Application
- 8.2.1. Storage and Inventory Management
- 8.2.2. Monitoring
- 8.2.3. Treatment
- 8.2.4. Other Applications
- 8.3. Market Analysis, Insights and Forecast - by End User
- 8.3.1. Hospitals
- 8.3.2. Home Care Settings
- 8.3.3. Other End Users
- 8.1. Market Analysis, Insights and Forecast - by Product Type
- 9. Asia Pacific Smart Healthcare Market Analysis, Insights and Forecast, 2020-2032
- 9.1. Market Analysis, Insights and Forecast - by Product Type
- 9.1.1. Telemedicine
- 9.1.2. Electronic Health Records
- 9.1.3. mHealth
- 9.1.4. Smart Pills and Syringes
- 9.1.5. Smart RFID Cabinets
- 9.1.6. Other Product Types
- 9.2. Market Analysis, Insights and Forecast - by Application
- 9.2.1. Storage and Inventory Management
- 9.2.2. Monitoring
- 9.2.3. Treatment
- 9.2.4. Other Applications
- 9.3. Market Analysis, Insights and Forecast - by End User
- 9.3.1. Hospitals
- 9.3.2. Home Care Settings
- 9.3.3. Other End Users
- 9.1. Market Analysis, Insights and Forecast - by Product Type
- 10. Middle East and Africa Smart Healthcare Market Analysis, Insights and Forecast, 2020-2032
- 10.1. Market Analysis, Insights and Forecast - by Product Type
- 10.1.1. Telemedicine
- 10.1.2. Electronic Health Records
- 10.1.3. mHealth
- 10.1.4. Smart Pills and Syringes
- 10.1.5. Smart RFID Cabinets
- 10.1.6. Other Product Types
- 10.2. Market Analysis, Insights and Forecast - by Application
- 10.2.1. Storage and Inventory Management
- 10.2.2. Monitoring
- 10.2.3. Treatment
- 10.2.4. Other Applications
- 10.3. Market Analysis, Insights and Forecast - by End User
- 10.3.1. Hospitals
- 10.3.2. Home Care Settings
- 10.3.3. Other End Users
- 10.1. Market Analysis, Insights and Forecast - by Product Type
- 11. South America Smart Healthcare Market Analysis, Insights and Forecast, 2020-2032
- 11.1. Market Analysis, Insights and Forecast - by Product Type
- 11.1.1. Telemedicine
- 11.1.2. Electronic Health Records
- 11.1.3. mHealth
- 11.1.4. Smart Pills and Syringes
- 11.1.5. Smart RFID Cabinets
- 11.1.6. Other Product Types
- 11.2. Market Analysis, Insights and Forecast - by Application
- 11.2.1. Storage and Inventory Management
- 11.2.2. Monitoring
- 11.2.3. Treatment
- 11.2.4. Other Applications
- 11.3. Market Analysis, Insights and Forecast - by End User
- 11.3.1. Hospitals
- 11.3.2. Home Care Settings
- 11.3.3. Other End Users
- 11.1. Market Analysis, Insights and Forecast - by Product Type
- 12. Competitive Analysis
- 12.1. Company Profiles
- 12.1.1 Medtronic (Given Imaging Inc )
- 12.1.1.1. Company Overview
- 12.1.1.2. Products
- 12.1.1.3. Company Financials
- 12.1.1.4. SWOT Analysis
- 12.1.2 Life Sense
- 12.1.2.1. Company Overview
- 12.1.2.2. Products
- 12.1.2.3. Company Financials
- 12.1.2.4. SWOT Analysis
- 12.1.3 Oracle Corporation (Cerner Corporation)
- 12.1.3.1. Company Overview
- 12.1.3.2. Products
- 12.1.3.3. Company Financials
- 12.1.3.4. SWOT Analysis
- 12.1.4 GE Healthcare
- 12.1.4.1. Company Overview
- 12.1.4.2. Products
- 12.1.4.3. Company Financials
- 12.1.4.4. SWOT Analysis
- 12.1.5 Abbott Laboratories
- 12.1.5.1. Company Overview
- 12.1.5.2. Products
- 12.1.5.3. Company Financials
- 12.1.5.4. SWOT Analysis
- 12.1.6 Siemens Healthineers AG
- 12.1.6.1. Company Overview
- 12.1.6.2. Products
- 12.1.6.3. Company Financials
- 12.1.6.4. SWOT Analysis
- 12.1.7 Next Gen Healthcare
- 12.1.7.1. Company Overview
- 12.1.7.2. Products
- 12.1.7.3. Company Financials
- 12.1.7.4. SWOT Analysis
- 12.1.8 Koninklijke Philips NV
- 12.1.8.1. Company Overview
- 12.1.8.2. Products
- 12.1.8.3. Company Financials
- 12.1.8.4. SWOT Analysis
- 12.1.9 McKesson Corporation
- 12.1.9.1. Company Overview
- 12.1.9.2. Products
- 12.1.9.3. Company Financials
- 12.1.9.4. SWOT Analysis
- 12.1.10 Olympus Corporation
- 12.1.10.1. Company Overview
- 12.1.10.2. Products
- 12.1.10.3. Company Financials
- 12.1.10.4. SWOT Analysis
- 12.1.11 Capsule Technologies Inc
- 12.1.11.1. Company Overview
- 12.1.11.2. Products
- 12.1.11.3. Company Financials
- 12.1.11.4. SWOT Analysis
- 12.1.12 Samsung Healthcare
- 12.1.12.1. Company Overview
- 12.1.12.2. Products
- 12.1.12.3. Company Financials
- 12.1.12.4. SWOT Analysis
- 12.1.1 Medtronic (Given Imaging Inc )
- 12.2. Market Entropy
- 12.2.1 Company's Key Areas Served
- 12.2.2 Recent Developments
- 12.3. Company Market Share Analysis 2025
- 12.3.1 Top 5 Companies Market Share Analysis
- 12.3.2 Top 3 Companies Market Share Analysis
- 12.4. List of Potential Customers
- 13. Research Methodology
List of Figures
- Figure 1: Global Smart Healthcare Market Revenue Breakdown (billion, %) by Region 2025 & 2033
- Figure 2: Global Smart Healthcare Market Volume Breakdown (K Unit, %) by Region 2025 & 2033
- Figure 3: North America Smart Healthcare Market Revenue (billion), by Product Type 2025 & 2033
- Figure 4: North America Smart Healthcare Market Volume (K Unit), by Product Type 2025 & 2033
- Figure 5: North America Smart Healthcare Market Revenue Share (%), by Product Type 2025 & 2033
- Figure 6: North America Smart Healthcare Market Volume Share (%), by Product Type 2025 & 2033
- Figure 7: North America Smart Healthcare Market Revenue (billion), by Application 2025 & 2033
- Figure 8: North America Smart Healthcare Market Volume (K Unit), by Application 2025 & 2033
- Figure 9: North America Smart Healthcare Market Revenue Share (%), by Application 2025 & 2033
- Figure 10: North America Smart Healthcare Market Volume Share (%), by Application 2025 & 2033
- Figure 11: North America Smart Healthcare Market Revenue (billion), by End User 2025 & 2033
- Figure 12: North America Smart Healthcare Market Volume (K Unit), by End User 2025 & 2033
- Figure 13: North America Smart Healthcare Market Revenue Share (%), by End User 2025 & 2033
- Figure 14: North America Smart Healthcare Market Volume Share (%), by End User 2025 & 2033
- Figure 15: North America Smart Healthcare Market Revenue (billion), by Country 2025 & 2033
- Figure 16: North America Smart Healthcare Market Volume (K Unit), by Country 2025 & 2033
- Figure 17: North America Smart Healthcare Market Revenue Share (%), by Country 2025 & 2033
- Figure 18: North America Smart Healthcare Market Volume Share (%), by Country 2025 & 2033
- Figure 19: Europe Smart Healthcare Market Revenue (billion), by Product Type 2025 & 2033
- Figure 20: Europe Smart Healthcare Market Volume (K Unit), by Product Type 2025 & 2033
- Figure 21: Europe Smart Healthcare Market Revenue Share (%), by Product Type 2025 & 2033
- Figure 22: Europe Smart Healthcare Market Volume Share (%), by Product Type 2025 & 2033
- Figure 23: Europe Smart Healthcare Market Revenue (billion), by Application 2025 & 2033
- Figure 24: Europe Smart Healthcare Market Volume (K Unit), by Application 2025 & 2033
- Figure 25: Europe Smart Healthcare Market Revenue Share (%), by Application 2025 & 2033
- Figure 26: Europe Smart Healthcare Market Volume Share (%), by Application 2025 & 2033
- Figure 27: Europe Smart Healthcare Market Revenue (billion), by End User 2025 & 2033
- Figure 28: Europe Smart Healthcare Market Volume (K Unit), by End User 2025 & 2033
- Figure 29: Europe Smart Healthcare Market Revenue Share (%), by End User 2025 & 2033
- Figure 30: Europe Smart Healthcare Market Volume Share (%), by End User 2025 & 2033
- Figure 31: Europe Smart Healthcare Market Revenue (billion), by Country 2025 & 2033
- Figure 32: Europe Smart Healthcare Market Volume (K Unit), by Country 2025 & 2033
- Figure 33: Europe Smart Healthcare Market Revenue Share (%), by Country 2025 & 2033
- Figure 34: Europe Smart Healthcare Market Volume Share (%), by Country 2025 & 2033
- Figure 35: Asia Pacific Smart Healthcare Market Revenue (billion), by Product Type 2025 & 2033
- Figure 36: Asia Pacific Smart Healthcare Market Volume (K Unit), by Product Type 2025 & 2033
- Figure 37: Asia Pacific Smart Healthcare Market Revenue Share (%), by Product Type 2025 & 2033
- Figure 38: Asia Pacific Smart Healthcare Market Volume Share (%), by Product Type 2025 & 2033
- Figure 39: Asia Pacific Smart Healthcare Market Revenue (billion), by Application 2025 & 2033
- Figure 40: Asia Pacific Smart Healthcare Market Volume (K Unit), by Application 2025 & 2033
- Figure 41: Asia Pacific Smart Healthcare Market Revenue Share (%), by Application 2025 & 2033
- Figure 42: Asia Pacific Smart Healthcare Market Volume Share (%), by Application 2025 & 2033
- Figure 43: Asia Pacific Smart Healthcare Market Revenue (billion), by End User 2025 & 2033
- Figure 44: Asia Pacific Smart Healthcare Market Volume (K Unit), by End User 2025 & 2033
- Figure 45: Asia Pacific Smart Healthcare Market Revenue Share (%), by End User 2025 & 2033
- Figure 46: Asia Pacific Smart Healthcare Market Volume Share (%), by End User 2025 & 2033
- Figure 47: Asia Pacific Smart Healthcare Market Revenue (billion), by Country 2025 & 2033
- Figure 48: Asia Pacific Smart Healthcare Market Volume (K Unit), by Country 2025 & 2033
- Figure 49: Asia Pacific Smart Healthcare Market Revenue Share (%), by Country 2025 & 2033
- Figure 50: Asia Pacific Smart Healthcare Market Volume Share (%), by Country 2025 & 2033
- Figure 51: Middle East and Africa Smart Healthcare Market Revenue (billion), by Product Type 2025 & 2033
- Figure 52: Middle East and Africa Smart Healthcare Market Volume (K Unit), by Product Type 2025 & 2033
- Figure 53: Middle East and Africa Smart Healthcare Market Revenue Share (%), by Product Type 2025 & 2033
- Figure 54: Middle East and Africa Smart Healthcare Market Volume Share (%), by Product Type 2025 & 2033
- Figure 55: Middle East and Africa Smart Healthcare Market Revenue (billion), by Application 2025 & 2033
- Figure 56: Middle East and Africa Smart Healthcare Market Volume (K Unit), by Application 2025 & 2033
- Figure 57: Middle East and Africa Smart Healthcare Market Revenue Share (%), by Application 2025 & 2033
- Figure 58: Middle East and Africa Smart Healthcare Market Volume Share (%), by Application 2025 & 2033
- Figure 59: Middle East and Africa Smart Healthcare Market Revenue (billion), by End User 2025 & 2033
- Figure 60: Middle East and Africa Smart Healthcare Market Volume (K Unit), by End User 2025 & 2033
- Figure 61: Middle East and Africa Smart Healthcare Market Revenue Share (%), by End User 2025 & 2033
- Figure 62: Middle East and Africa Smart Healthcare Market Volume Share (%), by End User 2025 & 2033
- Figure 63: Middle East and Africa Smart Healthcare Market Revenue (billion), by Country 2025 & 2033
- Figure 64: Middle East and Africa Smart Healthcare Market Volume (K Unit), by Country 2025 & 2033
- Figure 65: Middle East and Africa Smart Healthcare Market Revenue Share (%), by Country 2025 & 2033
- Figure 66: Middle East and Africa Smart Healthcare Market Volume Share (%), by Country 2025 & 2033
- Figure 67: South America Smart Healthcare Market Revenue (billion), by Product Type 2025 & 2033
- Figure 68: South America Smart Healthcare Market Volume (K Unit), by Product Type 2025 & 2033
- Figure 69: South America Smart Healthcare Market Revenue Share (%), by Product Type 2025 & 2033
- Figure 70: South America Smart Healthcare Market Volume Share (%), by Product Type 2025 & 2033
- Figure 71: South America Smart Healthcare Market Revenue (billion), by Application 2025 & 2033
- Figure 72: South America Smart Healthcare Market Volume (K Unit), by Application 2025 & 2033
- Figure 73: South America Smart Healthcare Market Revenue Share (%), by Application 2025 & 2033
- Figure 74: South America Smart Healthcare Market Volume Share (%), by Application 2025 & 2033
- Figure 75: South America Smart Healthcare Market Revenue (billion), by End User 2025 & 2033
- Figure 76: South America Smart Healthcare Market Volume (K Unit), by End User 2025 & 2033
- Figure 77: South America Smart Healthcare Market Revenue Share (%), by End User 2025 & 2033
- Figure 78: South America Smart Healthcare Market Volume Share (%), by End User 2025 & 2033
- Figure 79: South America Smart Healthcare Market Revenue (billion), by Country 2025 & 2033
- Figure 80: South America Smart Healthcare Market Volume (K Unit), by Country 2025 & 2033
- Figure 81: South America Smart Healthcare Market Revenue Share (%), by Country 2025 & 2033
- Figure 82: South America Smart Healthcare Market Volume Share (%), by Country 2025 & 2033
List of Tables
- Table 1: Global Smart Healthcare Market Revenue billion Forecast, by Product Type 2020 & 2033
- Table 2: Global Smart Healthcare Market Volume K Unit Forecast, by Product Type 2020 & 2033
- Table 3: Global Smart Healthcare Market Revenue billion Forecast, by Application 2020 & 2033
- Table 4: Global Smart Healthcare Market Volume K Unit Forecast, by Application 2020 & 2033
- Table 5: Global Smart Healthcare Market Revenue billion Forecast, by End User 2020 & 2033
- Table 6: Global Smart Healthcare Market Volume K Unit Forecast, by End User 2020 & 2033
- Table 7: Global Smart Healthcare Market Revenue billion Forecast, by Region 2020 & 2033
- Table 8: Global Smart Healthcare Market Volume K Unit Forecast, by Region 2020 & 2033
- Table 9: Global Smart Healthcare Market Revenue billion Forecast, by Product Type 2020 & 2033
- Table 10: Global Smart Healthcare Market Volume K Unit Forecast, by Product Type 2020 & 2033
- Table 11: Global Smart Healthcare Market Revenue billion Forecast, by Application 2020 & 2033
- Table 12: Global Smart Healthcare Market Volume K Unit Forecast, by Application 2020 & 2033
- Table 13: Global Smart Healthcare Market Revenue billion Forecast, by End User 2020 & 2033
- Table 14: Global Smart Healthcare Market Volume K Unit Forecast, by End User 2020 & 2033
- Table 15: Global Smart Healthcare Market Revenue billion Forecast, by Country 2020 & 2033
- Table 16: Global Smart Healthcare Market Volume K Unit Forecast, by Country 2020 & 2033
- Table 17: United States Smart Healthcare Market Revenue (billion) Forecast, by Application 2020 & 2033
- Table 18: United States Smart Healthcare Market Volume (K Unit) Forecast, by Application 2020 & 2033
- Table 19: Canada Smart Healthcare Market Revenue (billion) Forecast, by Application 2020 & 2033
- Table 20: Canada Smart Healthcare Market Volume (K Unit) Forecast, by Application 2020 & 2033
- Table 21: Mexico Smart Healthcare Market Revenue (billion) Forecast, by Application 2020 & 2033
- Table 22: Mexico Smart Healthcare Market Volume (K Unit) Forecast, by Application 2020 & 2033
- Table 23: Global Smart Healthcare Market Revenue billion Forecast, by Product Type 2020 & 2033
- Table 24: Global Smart Healthcare Market Volume K Unit Forecast, by Product Type 2020 & 2033
- Table 25: Global Smart Healthcare Market Revenue billion Forecast, by Application 2020 & 2033
- Table 26: Global Smart Healthcare Market Volume K Unit Forecast, by Application 2020 & 2033
- Table 27: Global Smart Healthcare Market Revenue billion Forecast, by End User 2020 & 2033
- Table 28: Global Smart Healthcare Market Volume K Unit Forecast, by End User 2020 & 2033
- Table 29: Global Smart Healthcare Market Revenue billion Forecast, by Country 2020 & 2033
- Table 30: Global Smart Healthcare Market Volume K Unit Forecast, by Country 2020 & 2033
- Table 31: Germany Smart Healthcare Market Revenue (billion) Forecast, by Application 2020 & 2033
- Table 32: Germany Smart Healthcare Market Volume (K Unit) Forecast, by Application 2020 & 2033
- Table 33: United Kingdom Smart Healthcare Market Revenue (billion) Forecast, by Application 2020 & 2033
- Table 34: United Kingdom Smart Healthcare Market Volume (K Unit) Forecast, by Application 2020 & 2033
- Table 35: France Smart Healthcare Market Revenue (billion) Forecast, by Application 2020 & 2033
- Table 36: France Smart Healthcare Market Volume (K Unit) Forecast, by Application 2020 & 2033
- Table 37: Spain Smart Healthcare Market Revenue (billion) Forecast, by Application 2020 & 2033
- Table 38: Spain Smart Healthcare Market Volume (K Unit) Forecast, by Application 2020 & 2033
- Table 39: Italy Smart Healthcare Market Revenue (billion) Forecast, by Application 2020 & 2033
- Table 40: Italy Smart Healthcare Market Volume (K Unit) Forecast, by Application 2020 & 2033
- Table 41: Rest of Europe Smart Healthcare Market Revenue (billion) Forecast, by Application 2020 & 2033
- Table 42: Rest of Europe Smart Healthcare Market Volume (K Unit) Forecast, by Application 2020 & 2033
- Table 43: Global Smart Healthcare Market Revenue billion Forecast, by Product Type 2020 & 2033
- Table 44: Global Smart Healthcare Market Volume K Unit Forecast, by Product Type 2020 & 2033
- Table 45: Global Smart Healthcare Market Revenue billion Forecast, by Application 2020 & 2033
- Table 46: Global Smart Healthcare Market Volume K Unit Forecast, by Application 2020 & 2033
- Table 47: Global Smart Healthcare Market Revenue billion Forecast, by End User 2020 & 2033
- Table 48: Global Smart Healthcare Market Volume K Unit Forecast, by End User 2020 & 2033
- Table 49: Global Smart Healthcare Market Revenue billion Forecast, by Country 2020 & 2033
- Table 50: Global Smart Healthcare Market Volume K Unit Forecast, by Country 2020 & 2033
- Table 51: China Smart Healthcare Market Revenue (billion) Forecast, by Application 2020 & 2033
- Table 52: China Smart Healthcare Market Volume (K Unit) Forecast, by Application 2020 & 2033
- Table 53: Japan Smart Healthcare Market Revenue (billion) Forecast, by Application 2020 & 2033
- Table 54: Japan Smart Healthcare Market Volume (K Unit) Forecast, by Application 2020 & 2033
- Table 55: India Smart Healthcare Market Revenue (billion) Forecast, by Application 2020 & 2033
- Table 56: India Smart Healthcare Market Volume (K Unit) Forecast, by Application 2020 & 2033
- Table 57: Australia Smart Healthcare Market Revenue (billion) Forecast, by Application 2020 & 2033
- Table 58: Australia Smart Healthcare Market Volume (K Unit) Forecast, by Application 2020 & 2033
- Table 59: South Korea Smart Healthcare Market Revenue (billion) Forecast, by Application 2020 & 2033
- Table 60: South Korea Smart Healthcare Market Volume (K Unit) Forecast, by Application 2020 & 2033
- Table 61: Rest of Asia Pacific Smart Healthcare Market Revenue (billion) Forecast, by Application 2020 & 2033
- Table 62: Rest of Asia Pacific Smart Healthcare Market Volume (K Unit) Forecast, by Application 2020 & 2033
- Table 63: Global Smart Healthcare Market Revenue billion Forecast, by Product Type 2020 & 2033
- Table 64: Global Smart Healthcare Market Volume K Unit Forecast, by Product Type 2020 & 2033
- Table 65: Global Smart Healthcare Market Revenue billion Forecast, by Application 2020 & 2033
- Table 66: Global Smart Healthcare Market Volume K Unit Forecast, by Application 2020 & 2033
- Table 67: Global Smart Healthcare Market Revenue billion Forecast, by End User 2020 & 2033
- Table 68: Global Smart Healthcare Market Volume K Unit Forecast, by End User 2020 & 2033
- Table 69: Global Smart Healthcare Market Revenue billion Forecast, by Country 2020 & 2033
- Table 70: Global Smart Healthcare Market Volume K Unit Forecast, by Country 2020 & 2033
- Table 71: GCC Smart Healthcare Market Revenue (billion) Forecast, by Application 2020 & 2033
- Table 72: GCC Smart Healthcare Market Volume (K Unit) Forecast, by Application 2020 & 2033
- Table 73: South Africa Smart Healthcare Market Revenue (billion) Forecast, by Application 2020 & 2033
- Table 74: South Africa Smart Healthcare Market Volume (K Unit) Forecast, by Application 2020 & 2033
- Table 75: Rest of Middle East and Africa Smart Healthcare Market Revenue (billion) Forecast, by Application 2020 & 2033
- Table 76: Rest of Middle East and Africa Smart Healthcare Market Volume (K Unit) Forecast, by Application 2020 & 2033
- Table 77: Global Smart Healthcare Market Revenue billion Forecast, by Product Type 2020 & 2033
- Table 78: Global Smart Healthcare Market Volume K Unit Forecast, by Product Type 2020 & 2033
- Table 79: Global Smart Healthcare Market Revenue billion Forecast, by Application 2020 & 2033
- Table 80: Global Smart Healthcare Market Volume K Unit Forecast, by Application 2020 & 2033
- Table 81: Global Smart Healthcare Market Revenue billion Forecast, by End User 2020 & 2033
- Table 82: Global Smart Healthcare Market Volume K Unit Forecast, by End User 2020 & 2033
- Table 83: Global Smart Healthcare Market Revenue billion Forecast, by Country 2020 & 2033
- Table 84: Global Smart Healthcare Market Volume K Unit Forecast, by Country 2020 & 2033
- Table 85: Brazil Smart Healthcare Market Revenue (billion) Forecast, by Application 2020 & 2033
- Table 86: Brazil Smart Healthcare Market Volume (K Unit) Forecast, by Application 2020 & 2033
- Table 87: Argentina Smart Healthcare Market Revenue (billion) Forecast, by Application 2020 & 2033
- Table 88: Argentina Smart Healthcare Market Volume (K Unit) Forecast, by Application 2020 & 2033
- Table 89: Rest of South America Smart Healthcare Market Revenue (billion) Forecast, by Application 2020 & 2033
- Table 90: Rest of South America Smart Healthcare Market Volume (K Unit) Forecast, by Application 2020 & 2033
Frequently Asked Questions
1. What is the projected Compound Annual Growth Rate (CAGR) of the Smart Healthcare Market?
The projected CAGR is approximately 13.41%.
2. Which companies are prominent players in the Smart Healthcare Market?
Key companies in the market include Medtronic (Given Imaging Inc ), Life Sense, Oracle Corporation (Cerner Corporation), GE Healthcare, Abbott Laboratories, Siemens Healthineers AG, Next Gen Healthcare, Koninklijke Philips NV, McKesson Corporation, Olympus Corporation, Capsule Technologies Inc , Samsung Healthcare.
3. What are the main segments of the Smart Healthcare Market?
The market segments include Product Type, Application, End User.
4. Can you provide details about the market size?
The market size is estimated to be USD 252.39 billion as of 2022.
5. What are some drivers contributing to market growth?
Technological Advancements in Smart Healthcare Products; Booming Internet of Things (IoT) in the Healthcare Industry.
6. What are the notable trends driving market growth?
The mHealth Segment is Expected to Observe Good Growth in the Market.
7. Are there any restraints impacting market growth?
High Cost of Smart Healthcare Products.
8. Can you provide examples of recent developments in the market?
In March 2022, Intuitive MB launched its medical building operating system, which uses the Internet of Things (IoT), artificial intelligence (AI), and machine learning technologies to create "smart" hospitals and medical office buildings.
9. What pricing options are available for accessing the report?
Pricing options include single-user, multi-user, and enterprise licenses priced at USD 4750, USD 5250, and USD 8750 respectively.
10. Is the market size provided in terms of value or volume?
The market size is provided in terms of value, measured in billion and volume, measured in K Unit.
11. Are there any specific market keywords associated with the report?
Yes, the market keyword associated with the report is "Smart Healthcare Market," which aids in identifying and referencing the specific market segment covered.
12. How do I determine which pricing option suits my needs best?
The pricing options vary based on user requirements and access needs. Individual users may opt for single-user licenses, while businesses requiring broader access may choose multi-user or enterprise licenses for cost-effective access to the report.
13. Are there any additional resources or data provided in the Smart Healthcare Market report?
While the report offers comprehensive insights, it's advisable to review the specific contents or supplementary materials provided to ascertain if additional resources or data are available.
14. How can I stay updated on further developments or reports in the Smart Healthcare Market?
To stay informed about further developments, trends, and reports in the Smart Healthcare Market, consider subscribing to industry newsletters, following relevant companies and organizations, or regularly checking reputable industry news sources and publications.
Methodology
Step 1 - Identification of Relevant Samples Size from Population Database


Step 2 - Approaches for Defining Global Market Size (Value, Volume* & Price*)

Note*: In applicable scenarios
Step 3 - Data Sources
Primary Research
- Web Analytics
- Survey Reports
- Research Institute
- Latest Research Reports
- Opinion Leaders
Secondary Research
- Annual Reports
- White Paper
- Latest Press Release
- Industry Association
- Paid Database
- Investor Presentations

Step 4 - Data Triangulation
Involves using different sources of information in order to increase the validity of a study
These sources are likely to be stakeholders in a program - participants, other researchers, program staff, other community members, and so on.
Then we put all data in single framework & apply various statistical tools to find out the dynamic on the market.
During the analysis stage, feedback from the stakeholder groups would be compared to determine areas of agreement as well as areas of divergence