


Key Insights
The global Skin Permeation Testing market is poised for significant expansion, projected to reach a substantial $448.3 million in 2025 and exhibit a robust Compound Annual Growth Rate (CAGR) of 8% through 2033. This impressive growth is primarily fueled by the escalating demand for innovative drug delivery systems and the increasing stringency of regulatory requirements across pharmaceuticals and cosmetics. The pharmaceutical sector, in particular, is a major driver, as skin permeation testing is critical for evaluating the efficacy and safety of transdermal drug formulations, including patches, gels, and creams. Furthermore, the burgeoning cosmeceuticals industry, which blends cosmetic and pharmaceutical benefits, necessitates rigorous testing to ensure product safety and performance, thereby contributing to market expansion. The growing emphasis on animal welfare and the ethical concerns surrounding traditional animal testing methods are also propelling the adoption of in vitro skin permeation studies, which offer a more humane and often more predictive alternative.
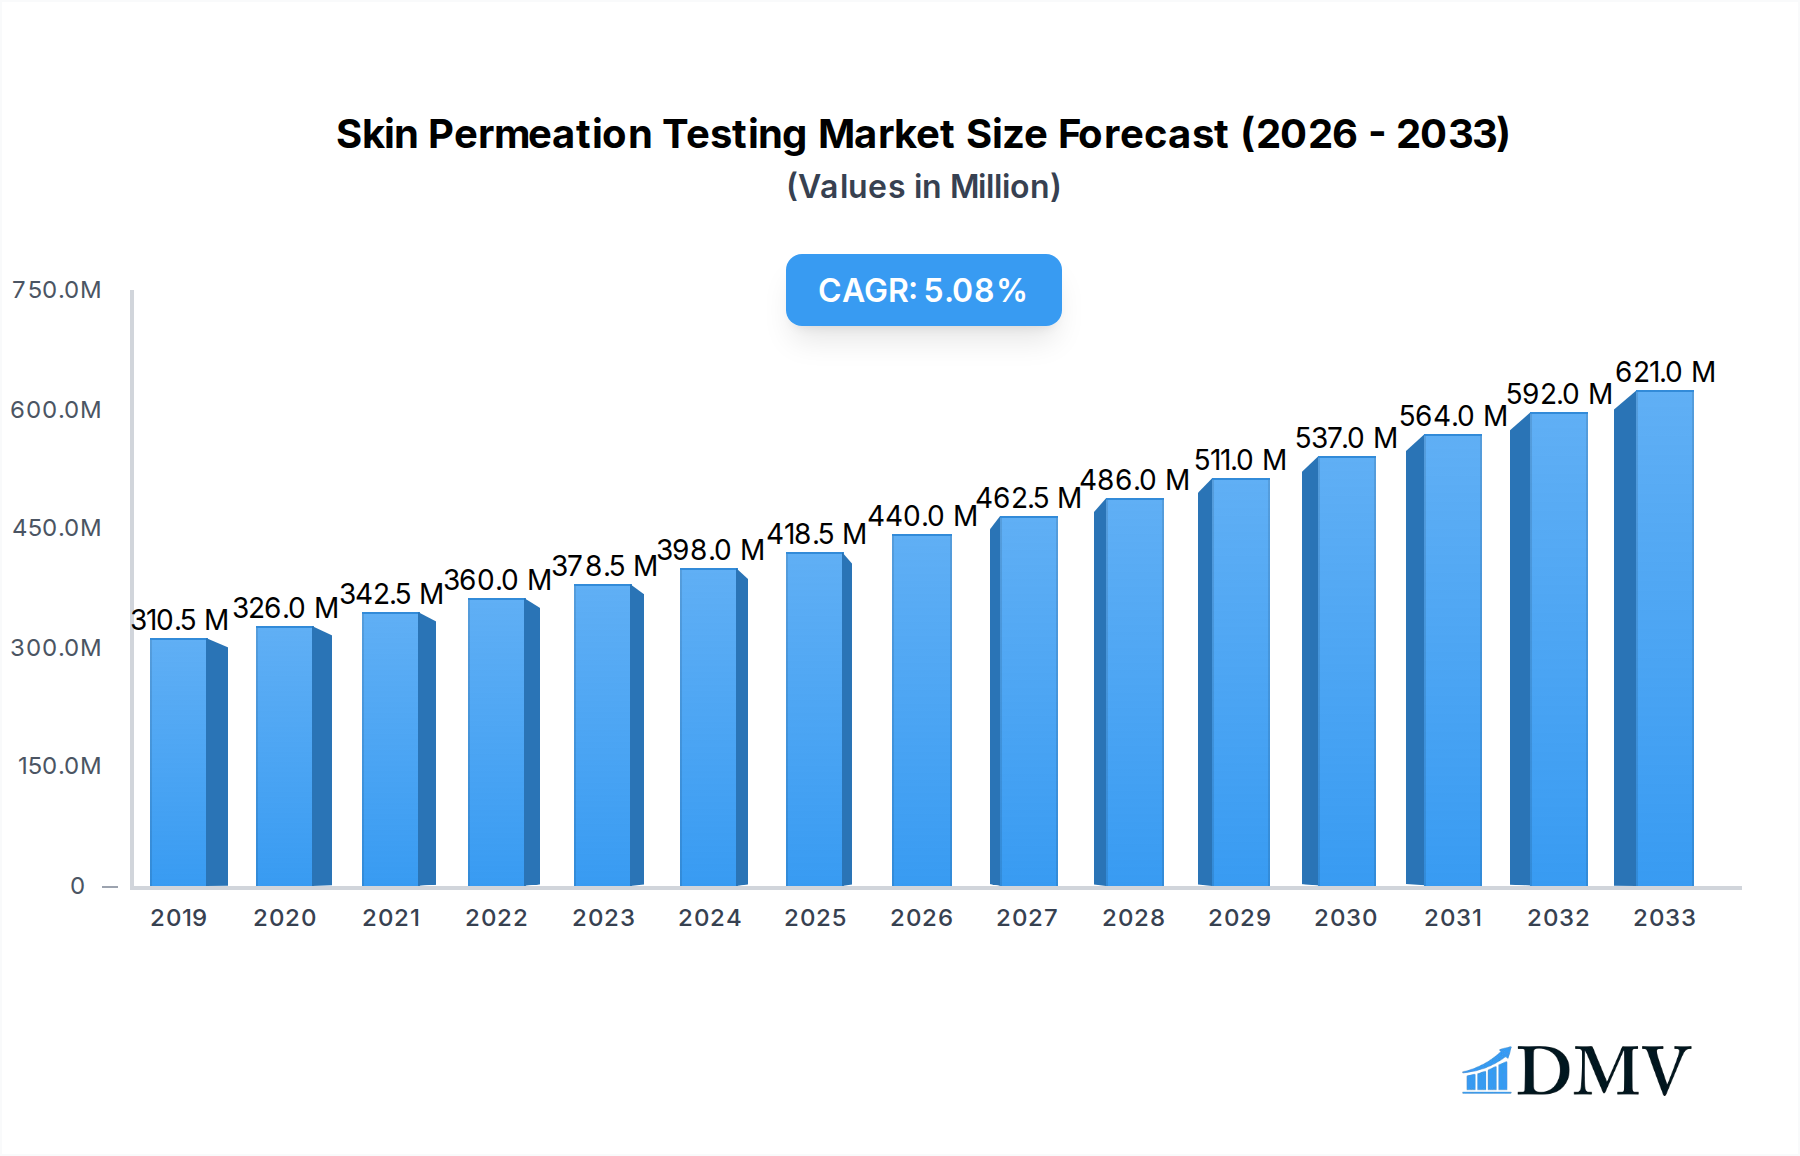
Skin Permeation Testing Market Size (In Million)

The market is segmented by application into Pharmaceuticals, Agrochemical/Chemical, Cosmetics, and Others, with Pharmaceuticals and Cosmetics anticipated to dominate due to their extensive use of skin permeation studies. By type, Human Skin and Animal Skin represent the key segments. Geographically, North America and Europe are expected to lead the market, driven by advanced research and development infrastructure, a high concentration of pharmaceutical and cosmetic companies, and stringent regulatory frameworks. The Asia Pacific region is emerging as a significant growth hub, with increasing investments in R&D and a growing domestic market for pharmaceuticals and personal care products. Key players such as Charles River Laboratories, Xenometrix, Intertek, and Eurofins are actively involved in market expansion through strategic partnerships, acquisitions, and the development of advanced testing methodologies, all contributing to the overall dynamism of the skin permeation testing landscape.
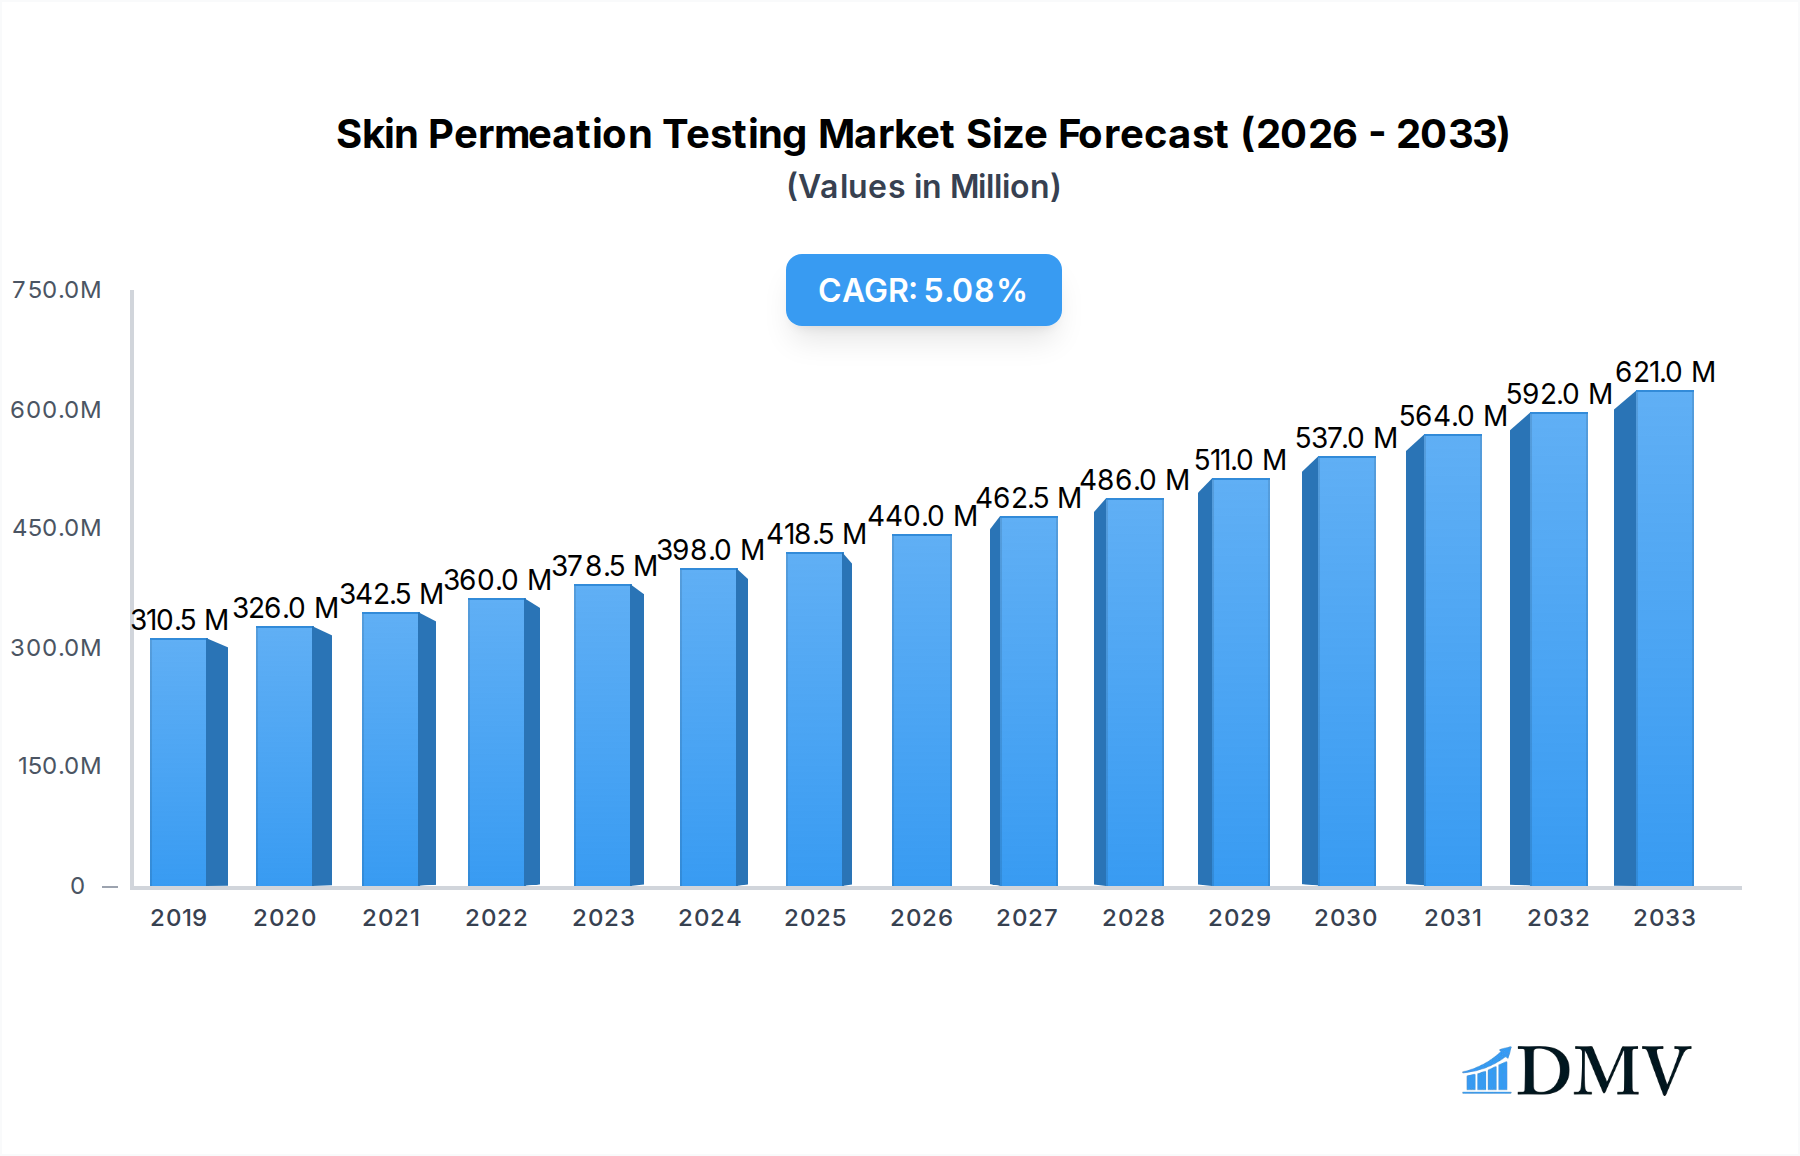
Skin Permeation Testing Company Market Share
Skin Permeation Testing Market Composition & Trends
The global skin permeation testing market is characterized by a dynamic interplay of established Contract Research Organizations (CROs) and specialized niche players, indicating a moderately concentrated landscape. Innovation catalysts are primarily driven by the increasing demand for in vitro skin permeation studies and the development of more predictive dermal absorption models. Regulatory stringency, particularly within the pharmaceuticals and cosmetics sectors, acts as a significant influence, mandating rigorous testing protocols to ensure product safety and efficacy. The emergence of alternative testing methodologies, such as non-animal testing approaches, presents a key trend, albeit with continued reliance on traditional human skin and animal skin models for validation. End-user profiles span a broad spectrum, from large pharmaceutical companies seeking to optimize drug delivery to agrochemical firms assessing environmental impact and cosmetic brands ensuring consumer safety. Mergers and acquisitions (M&A) are expected to continue, with estimated deal values in the hundreds of millions of dollars, as larger players seek to expand their service portfolios and geographical reach. For instance, the Charles River Laboratories and Eurofins ecosystems are likely to witness strategic integrations. The market is projected to reach over $XXX million by 2033, with a Compound Annual Growth Rate (CAGR) of approximately XX% during the forecast period of 2025-2033.
- Market Share Distribution: Fragmented yet with dominant players like Intertek, SGS, and Nelson Labs holding significant portions.
- M&A Deal Values: Estimated between XX million and XXX million USD per significant acquisition.
- Innovation Catalysts: Development of advanced Franz cell setups, microfluidic devices, and organ-on-a-chip technologies.
- Regulatory Landscapes: FDA, EMA, and REACH guidelines shaping testing requirements.
Skin Permeation Testing Industry Evolution
The skin permeation testing industry has undergone a significant transformation over the historical period of 2019-2024, driven by a confluence of scientific advancements, evolving regulatory landscapes, and a growing emphasis on drug delivery systems and topical product safety. From 2019 to the base year of 2025, the market has witnessed a steady upward trajectory, fueled by increasing investment in research and development across the pharmaceuticals, cosmetics, and agrochemical/chemical sectors. These industries are increasingly leveraging in vitro skin permeation studies to predict the dermal absorption of active ingredients, thereby reducing the need for extensive and costly animal testing. Technological advancements have been pivotal, with the refinement of methodologies like the Franz diffusion cell and the adoption of advanced analytical techniques such as High-Performance Liquid Chromatography (HPLC) and Mass Spectrometry (MS) for accurate quantification of permeated substances. The adoption of human skin models, including explanted skin and reconstituted human epidermis, has gained momentum, offering more human-relevant data compared to traditional animal skin models. This shift aligns with the global drive towards ethical research practices and the 3Rs principle (Replacement, Reduction, Refinement).
Furthermore, the cosmetics industry has seen a surge in demand for skin permeation testing to ensure the safety of novel ingredients and formulations, particularly in the context of transdermal delivery of active compounds for skincare. Similarly, the pharmaceutical industry relies heavily on these tests for evaluating the efficacy of transdermal drug delivery systems (TDDS) and assessing the potential for systemic exposure from topical medications. The agrochemical/chemical sector also utilizes these studies to understand the dermal absorption of pesticides and industrial chemicals, contributing to worker safety and environmental risk assessments. The market growth rate during the historical period was estimated to be around XX%, a figure projected to accelerate in the forecast period of 2025-2033. The ongoing industry developments are further shaping this evolution. For instance, the increasing complexity of drug molecules and the rise of biologics necessitate more sophisticated permeation models that can accurately predict their behavior within the skin barrier. The estimated year of 2025 marks a crucial point where advancements in artificial intelligence (AI) and machine learning (ML) are beginning to be integrated into the interpretation of skin permeation data, promising more predictive and efficient testing protocols. The study period of 2019–2033 encapsulates this continuous innovation.
- Market Growth Trajectories: Consistent year-on-year growth driven by regulatory mandates and R&D investments.
- Technological Advancements: Enhanced sensitivity of analytical instruments, development of sophisticated Franz cell systems, and progress in 3D skin models.
- Shifting Consumer Demands: Increased consumer awareness regarding product safety and demand for ethically sourced and tested products.
- Growth Rates: Average annual growth rate of approximately XX% between 2019 and 2024.
- Adoption Metrics: Over XX% of new topical drug development projects now incorporate in vitro skin permeation studies.
Leading Regions, Countries, or Segments in Skin Permeation Testing
The skin permeation testing market is demonstrating strong leadership in several key regions and segments, driven by distinct market dynamics and strategic investments. North America, particularly the United States, currently dominates the market, largely attributed to its robust pharmaceutical and biotechnology industries, significant R&D expenditure, and a well-established regulatory framework that mandates stringent safety testing. The presence of leading CROs such as Charles River Laboratories, Nelson Labs, and Intertek further solidifies its leadership position.
In terms of application segments, pharmaceuticals represent the largest and fastest-growing sector. The continuous development of transdermal drug delivery systems (TDDS) for chronic diseases, pain management, and vaccine delivery requires extensive skin permeation testing to optimize drug absorption, efficacy, and safety. Companies like MedPharm, Stira Pharmaceuticals, and Frontage are heavily invested in this area. The cosmetics segment also holds significant market share, driven by consumer demand for safe and effective skincare products with novel active ingredients. The increasing focus on natural and organic cosmetics necessitates thorough testing to ensure dermal penetration and efficacy without adverse effects. CD Formulation and Topical Products Testing are key players here.
When considering the type of skin used, human skin models are increasingly preferred due to their higher physiological relevance, leading to more accurate predictions of drug absorption and skin penetration. This trend is supported by advancements in reconstructed human epidermis (RhE) models and the ethical considerations surrounding non-animal testing. However, animal skin, particularly porcine skin, remains a valuable tool for certain applications, especially in early-stage research and validation, with organizations like Xenometrix offering specialized services. The agrochemical/chemical segment is also a noteworthy contributor, with companies like Eurofins providing essential dermal toxicity testing and exposure assessments for pesticides and industrial chemicals. Regulatory support and proactive investment in testing infrastructure are key drivers in these dominant segments.
- Dominant Region: North America, with an estimated market share of XX% in 2025.
- Key Drivers: High R&D investment in pharmaceuticals and cosmetics, stringent regulatory requirements (FDA), presence of major CROs.
- Leading Application Segment: Pharmaceuticals, accounting for approximately XX% of the market.
- Key Drivers: Growth in transdermal drug delivery, development of novel therapeutics, need for precise drug permeation data.
- Dominant Type of Skin: Human Skin, with a projected market share of XX% by 2025.
- Key Drivers: Ethical considerations, drive for human-relevant data, advancements in in vitro skin models, regulatory preference.
- Emerging Segment: Cosmetics, exhibiting a CAGR of XX% during the forecast period.
- Key Drivers: Demand for advanced skincare ingredients, safety assurance for consumers, trend towards natural and organic products.
Skin Permeation Testing Product Innovations
Innovations in skin permeation testing are revolutionizing how drug delivery and product safety are assessed. Advancements in microfluidic devices are enabling highly miniaturized and automated testing platforms, allowing for significantly reduced sample volumes and faster assay times. Furthermore, the development of sophisticated 3D skin models, engineered to mimic the complex architecture and biological functions of human skin more accurately, is providing more predictive dermal absorption data. These innovations are critical for evaluating the skin penetration of novel drug candidates, cosmetic ingredients, and agrochemicals. For example, Revivo BioSystems is at the forefront of creating advanced biological models. The performance metrics of these new products are impressive, offering enhanced reproducibility and a deeper understanding of skin barrier function.
Propelling Factors for Skin Permeation Testing Growth
Several key factors are propelling the growth of the skin permeation testing market. The increasingly stringent regulatory requirements from bodies like the FDA and EMA, emphasizing the safety and efficacy of pharmaceuticals and cosmetics, are a primary driver. The growing demand for transdermal drug delivery systems (TDDS), offering advantages like sustained release and reduced side effects, necessitates robust in vitro permeation studies. Furthermore, the global push towards ethical research practices and the reduction of animal testing is fueling the adoption of human skin and advanced in vitro models. Technological advancements, including improved analytical instrumentation and the development of more sophisticated skin models, are enhancing the reliability and predictive power of these tests. The expanding cosmetics industry and its focus on active ingredients also contribute significantly.
Obstacles in the Skin Permeation Testing Market
Despite robust growth, the skin permeation testing market faces certain obstacles. The high cost of developing and validating new in vitro models can be a barrier to adoption, particularly for smaller companies. Ensuring the full regulatory acceptance of novel non-animal testing methodologies for all applications remains a gradual process. Supply chain disruptions, particularly for specialized reagents and human skin samples, can impact turnaround times and project timelines. Moreover, the inherent complexity of skin biology means that predictive models still require refinement to perfectly replicate in vivo conditions, leading to potential discrepancies in results. Intense competition among CROs also pressures pricing.
Future Opportunities in Skin Permeation Testing
The future of skin permeation testing is ripe with opportunities. The increasing exploration of nanotechnology for targeted drug and cosmetic delivery presents a vast area for innovative testing solutions to assess the skin penetration of nanoparticles. The growing market for biologics and biosimilars requiring topical or transdermal administration will drive demand for specialized permeation assays. Expansion into emerging markets with burgeoning pharmaceutical and cosmetic industries offers significant growth potential. Furthermore, the integration of Artificial Intelligence (AI) and machine learning (ML) for data analysis and predictive modeling holds the promise of more efficient and accurate skin permeation testing.
Major Players in the Skin Permeation Testing Ecosystem
- Charles River Laboratories
- Xenometrix
- Intertek
- Eurofins
- Tergus Pharma
- SGS
- Nelson Labs
- Revivo BioSystems
- Stira Pharmaceuticals
- Raptim Research
- MedPharm
- CPL
- Diteba
- Topical Products Testing
- InVitro Research Solutions
- Nuvisan
- QPS
- CD Formulation
- Frontage
- Mingjie Pharmaceutical
Key Developments in Skin Permeation Testing Industry
- 2023 September: Launch of advanced 3D reconstructed human epidermis models by multiple vendors, offering enhanced physiological relevance for dermal absorption studies.
- 2023 August: Eurofins announces expansion of its in vitro toxicology services, including enhanced skin permeation testing capabilities for the pharmaceutical and cosmetics sectors.
- 2023 July: Revivo BioSystems secures significant funding to further develop its organ-on-a-chip technology for more predictive skin penetration assessments.
- 2023 May: Regulatory bodies (e.g., EMA) publish updated guidelines favoring the use of validated in vitro skin models over animal testing where applicable.
- 2023 April: Nelson Labs integrates AI-driven data analysis into its skin permeation testing workflows to improve predictive accuracy.
- 2023 February: Tergus Pharma introduces a novel high-throughput Franz cell system, significantly reducing testing times for topical products.
- 2023 January: Xenometrix develops specialized animal skin models for assessing the efficacy of new agrochemical formulations.
Strategic Skin Permeation Testing Market Forecast
The skin permeation testing market is poised for substantial growth, driven by an increasing demand for robust safety and efficacy assessments across the pharmaceuticals, cosmetics, and agrochemical/chemical industries. The ongoing shift towards human skin models and the advancement of in vitro testing methodologies, including microfluidics and 3D skin constructs, will be key growth catalysts. Regulatory support for non-animal testing and the expansion of transdermal drug delivery systems will further fuel market expansion. The strategic adoption of innovative technologies and expansion into emerging markets will define the future success of players in this vital sector, projecting a promising market potential exceeding XXX million USD by 2033.
Skin Permeation Testing Segmentation
-
1. Application
- 1.1. Pharmaceuticals
- 1.2. Agrochemical/Chemical
- 1.3. Cosmetics
- 1.4. Others
-
2. Type
- 2.1. Human Skin
- 2.2. Animal Skin
Skin Permeation Testing Segmentation By Geography
-
1. North America
- 1.1. United States
- 1.2. Canada
- 1.3. Mexico
-
2. South America
- 2.1. Brazil
- 2.2. Argentina
- 2.3. Rest of South America
-
3. Europe
- 3.1. United Kingdom
- 3.2. Germany
- 3.3. France
- 3.4. Italy
- 3.5. Spain
- 3.6. Russia
- 3.7. Benelux
- 3.8. Nordics
- 3.9. Rest of Europe
-
4. Middle East & Africa
- 4.1. Turkey
- 4.2. Israel
- 4.3. GCC
- 4.4. North Africa
- 4.5. South Africa
- 4.6. Rest of Middle East & Africa
-
5. Asia Pacific
- 5.1. China
- 5.2. India
- 5.3. Japan
- 5.4. South Korea
- 5.5. ASEAN
- 5.6. Oceania
- 5.7. Rest of Asia Pacific
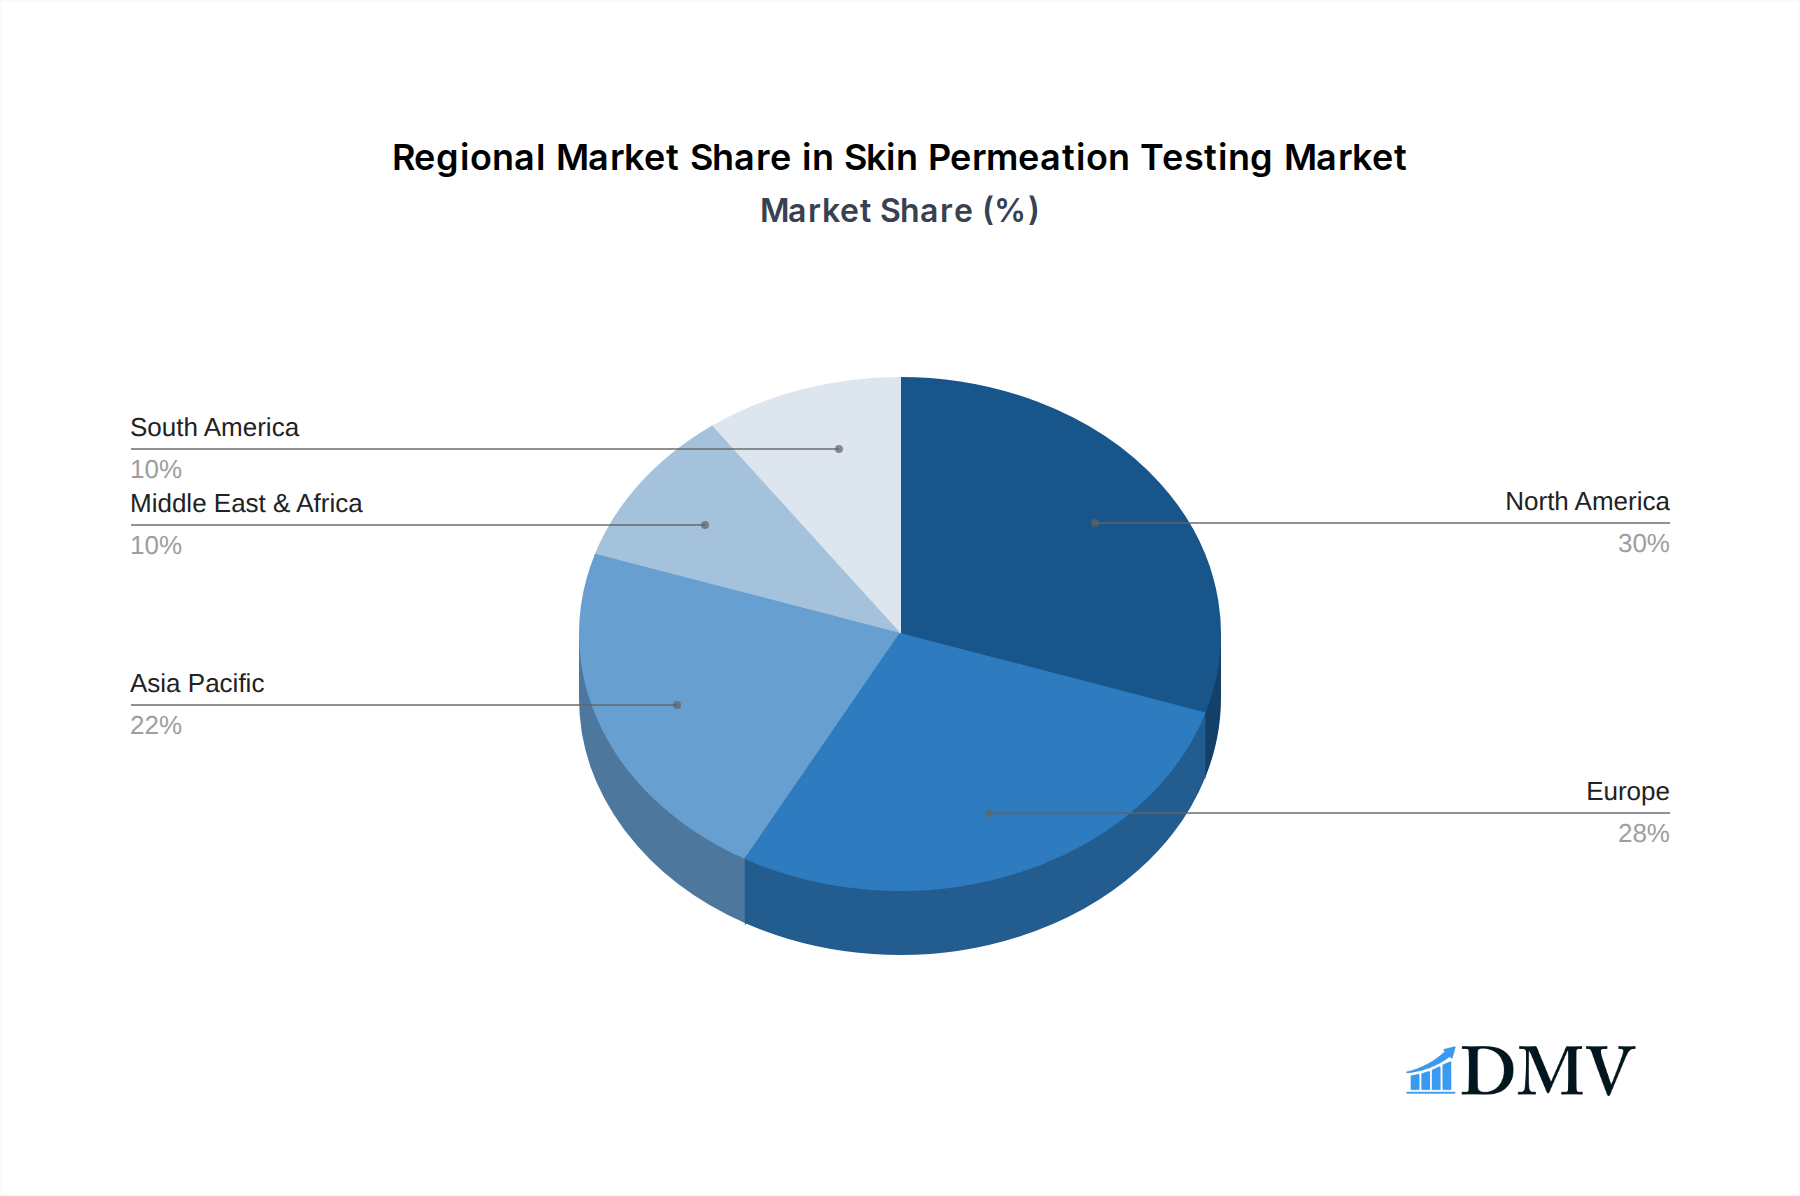
Skin Permeation Testing Regional Market Share
Geographic Coverage of Skin Permeation Testing
Skin Permeation Testing REPORT HIGHLIGHTS
| Aspects | Details |
|---|---|
| Study Period | 2020-2034 |
| Base Year | 2025 |
| Estimated Year | 2026 |
| Forecast Period | 2026-2034 |
| Historical Period | 2020-2025 |
| Growth Rate | CAGR of 12.6% from 2020-2034 |
| Segmentation |
|
Table of Contents
- 1. Introduction
- 1.1. Research Scope
- 1.2. Market Segmentation
- 1.3. Research Objective
- 1.4. Definitions and Assumptions
- 2. Executive Summary
- 2.1. Market Snapshot
- 3. Market Dynamics
- 3.1. Market Drivers
- 3.2. Market Restrains
- 3.3. Market Trends
- 3.4. Market Opportunities
- 4. Market Factor Analysis
- 4.1. Porters Five Forces
- 4.1.1. Bargaining Power of Suppliers
- 4.1.2. Bargaining Power of Buyers
- 4.1.3. Threat of New Entrants
- 4.1.4. Threat of Substitutes
- 4.1.5. Competitive Rivalry
- 4.2. PESTEL analysis
- 4.3. BCG Analysis
- 4.3.1. Stars (High Growth, High Market Share)
- 4.3.2. Cash Cows (Low Growth, High Market Share)
- 4.3.3. Question Mark (High Growth, Low Market Share)
- 4.3.4. Dogs (Low Growth, Low Market Share)
- 4.4. Ansoff Matrix Analysis
- 4.5. Supply Chain Analysis
- 4.6. Regulatory Landscape
- 4.7. Current Market Potential and Opportunity Assessment (TAM–SAM–SOM Framework)
- 4.8. DMV Analyst Note
- 4.1. Porters Five Forces
- 5. Market Analysis, Insights and Forecast 2021-2033
- 5.1. Market Analysis, Insights and Forecast - by Application
- 5.1.1. Pharmaceuticals
- 5.1.2. Agrochemical/Chemical
- 5.1.3. Cosmetics
- 5.1.4. Others
- 5.2. Market Analysis, Insights and Forecast - by Type
- 5.2.1. Human Skin
- 5.2.2. Animal Skin
- 5.3. Market Analysis, Insights and Forecast - by Region
- 5.3.1. North America
- 5.3.2. South America
- 5.3.3. Europe
- 5.3.4. Middle East & Africa
- 5.3.5. Asia Pacific
- 5.1. Market Analysis, Insights and Forecast - by Application
- 6. Global Skin Permeation Testing Analysis, Insights and Forecast, 2021-2033
- 6.1. Market Analysis, Insights and Forecast - by Application
- 6.1.1. Pharmaceuticals
- 6.1.2. Agrochemical/Chemical
- 6.1.3. Cosmetics
- 6.1.4. Others
- 6.2. Market Analysis, Insights and Forecast - by Type
- 6.2.1. Human Skin
- 6.2.2. Animal Skin
- 6.1. Market Analysis, Insights and Forecast - by Application
- 7. North America Skin Permeation Testing Analysis, Insights and Forecast, 2020-2032
- 7.1. Market Analysis, Insights and Forecast - by Application
- 7.1.1. Pharmaceuticals
- 7.1.2. Agrochemical/Chemical
- 7.1.3. Cosmetics
- 7.1.4. Others
- 7.2. Market Analysis, Insights and Forecast - by Type
- 7.2.1. Human Skin
- 7.2.2. Animal Skin
- 7.1. Market Analysis, Insights and Forecast - by Application
- 8. South America Skin Permeation Testing Analysis, Insights and Forecast, 2020-2032
- 8.1. Market Analysis, Insights and Forecast - by Application
- 8.1.1. Pharmaceuticals
- 8.1.2. Agrochemical/Chemical
- 8.1.3. Cosmetics
- 8.1.4. Others
- 8.2. Market Analysis, Insights and Forecast - by Type
- 8.2.1. Human Skin
- 8.2.2. Animal Skin
- 8.1. Market Analysis, Insights and Forecast - by Application
- 9. Europe Skin Permeation Testing Analysis, Insights and Forecast, 2020-2032
- 9.1. Market Analysis, Insights and Forecast - by Application
- 9.1.1. Pharmaceuticals
- 9.1.2. Agrochemical/Chemical
- 9.1.3. Cosmetics
- 9.1.4. Others
- 9.2. Market Analysis, Insights and Forecast - by Type
- 9.2.1. Human Skin
- 9.2.2. Animal Skin
- 9.1. Market Analysis, Insights and Forecast - by Application
- 10. Middle East & Africa Skin Permeation Testing Analysis, Insights and Forecast, 2020-2032
- 10.1. Market Analysis, Insights and Forecast - by Application
- 10.1.1. Pharmaceuticals
- 10.1.2. Agrochemical/Chemical
- 10.1.3. Cosmetics
- 10.1.4. Others
- 10.2. Market Analysis, Insights and Forecast - by Type
- 10.2.1. Human Skin
- 10.2.2. Animal Skin
- 10.1. Market Analysis, Insights and Forecast - by Application
- 11. Asia Pacific Skin Permeation Testing Analysis, Insights and Forecast, 2020-2032
- 11.1. Market Analysis, Insights and Forecast - by Application
- 11.1.1. Pharmaceuticals
- 11.1.2. Agrochemical/Chemical
- 11.1.3. Cosmetics
- 11.1.4. Others
- 11.2. Market Analysis, Insights and Forecast - by Type
- 11.2.1. Human Skin
- 11.2.2. Animal Skin
- 11.1. Market Analysis, Insights and Forecast - by Application
- 12. Competitive Analysis
- 12.1. Company Profiles
- 12.1.1 Charles River Laboratories
- 12.1.1.1. Company Overview
- 12.1.1.2. Products
- 12.1.1.3. Company Financials
- 12.1.1.4. SWOT Analysis
- 12.1.2 Xenometrix
- 12.1.2.1. Company Overview
- 12.1.2.2. Products
- 12.1.2.3. Company Financials
- 12.1.2.4. SWOT Analysis
- 12.1.3 Intertek
- 12.1.3.1. Company Overview
- 12.1.3.2. Products
- 12.1.3.3. Company Financials
- 12.1.3.4. SWOT Analysis
- 12.1.4 Eurofins
- 12.1.4.1. Company Overview
- 12.1.4.2. Products
- 12.1.4.3. Company Financials
- 12.1.4.4. SWOT Analysis
- 12.1.5 Tergus Pharma
- 12.1.5.1. Company Overview
- 12.1.5.2. Products
- 12.1.5.3. Company Financials
- 12.1.5.4. SWOT Analysis
- 12.1.6 SGS
- 12.1.6.1. Company Overview
- 12.1.6.2. Products
- 12.1.6.3. Company Financials
- 12.1.6.4. SWOT Analysis
- 12.1.7 Nelson Labs
- 12.1.7.1. Company Overview
- 12.1.7.2. Products
- 12.1.7.3. Company Financials
- 12.1.7.4. SWOT Analysis
- 12.1.8 Revivo BioSystems
- 12.1.8.1. Company Overview
- 12.1.8.2. Products
- 12.1.8.3. Company Financials
- 12.1.8.4. SWOT Analysis
- 12.1.9 Stira Pharmaceuticals
- 12.1.9.1. Company Overview
- 12.1.9.2. Products
- 12.1.9.3. Company Financials
- 12.1.9.4. SWOT Analysis
- 12.1.10 Raptim Research
- 12.1.10.1. Company Overview
- 12.1.10.2. Products
- 12.1.10.3. Company Financials
- 12.1.10.4. SWOT Analysis
- 12.1.11 MedPharm
- 12.1.11.1. Company Overview
- 12.1.11.2. Products
- 12.1.11.3. Company Financials
- 12.1.11.4. SWOT Analysis
- 12.1.12 CPL
- 12.1.12.1. Company Overview
- 12.1.12.2. Products
- 12.1.12.3. Company Financials
- 12.1.12.4. SWOT Analysis
- 12.1.13 Diteba
- 12.1.13.1. Company Overview
- 12.1.13.2. Products
- 12.1.13.3. Company Financials
- 12.1.13.4. SWOT Analysis
- 12.1.14 Topical Products Testing
- 12.1.14.1. Company Overview
- 12.1.14.2. Products
- 12.1.14.3. Company Financials
- 12.1.14.4. SWOT Analysis
- 12.1.15 InVitro Research Solutions
- 12.1.15.1. Company Overview
- 12.1.15.2. Products
- 12.1.15.3. Company Financials
- 12.1.15.4. SWOT Analysis
- 12.1.16 Nuvisan
- 12.1.16.1. Company Overview
- 12.1.16.2. Products
- 12.1.16.3. Company Financials
- 12.1.16.4. SWOT Analysis
- 12.1.17 QPS
- 12.1.17.1. Company Overview
- 12.1.17.2. Products
- 12.1.17.3. Company Financials
- 12.1.17.4. SWOT Analysis
- 12.1.18 CD Formulation
- 12.1.18.1. Company Overview
- 12.1.18.2. Products
- 12.1.18.3. Company Financials
- 12.1.18.4. SWOT Analysis
- 12.1.19 Frontage
- 12.1.19.1. Company Overview
- 12.1.19.2. Products
- 12.1.19.3. Company Financials
- 12.1.19.4. SWOT Analysis
- 12.1.20 Mingjie Pharmaceutical
- 12.1.20.1. Company Overview
- 12.1.20.2. Products
- 12.1.20.3. Company Financials
- 12.1.20.4. SWOT Analysis
- 12.1.1 Charles River Laboratories
- 12.2. Market Entropy
- 12.2.1 Company's Key Areas Served
- 12.2.2 Recent Developments
- 12.3. Company Market Share Analysis 2025
- 12.3.1 Top 5 Companies Market Share Analysis
- 12.3.2 Top 3 Companies Market Share Analysis
- 12.4. List of Potential Customers
- 13. Research Methodology
List of Figures
- Figure 1: Global Skin Permeation Testing Revenue Breakdown (billion, %) by Region 2025 & 2033
- Figure 2: North America Skin Permeation Testing Revenue (billion), by Application 2025 & 2033
- Figure 3: North America Skin Permeation Testing Revenue Share (%), by Application 2025 & 2033
- Figure 4: North America Skin Permeation Testing Revenue (billion), by Type 2025 & 2033
- Figure 5: North America Skin Permeation Testing Revenue Share (%), by Type 2025 & 2033
- Figure 6: North America Skin Permeation Testing Revenue (billion), by Country 2025 & 2033
- Figure 7: North America Skin Permeation Testing Revenue Share (%), by Country 2025 & 2033
- Figure 8: South America Skin Permeation Testing Revenue (billion), by Application 2025 & 2033
- Figure 9: South America Skin Permeation Testing Revenue Share (%), by Application 2025 & 2033
- Figure 10: South America Skin Permeation Testing Revenue (billion), by Type 2025 & 2033
- Figure 11: South America Skin Permeation Testing Revenue Share (%), by Type 2025 & 2033
- Figure 12: South America Skin Permeation Testing Revenue (billion), by Country 2025 & 2033
- Figure 13: South America Skin Permeation Testing Revenue Share (%), by Country 2025 & 2033
- Figure 14: Europe Skin Permeation Testing Revenue (billion), by Application 2025 & 2033
- Figure 15: Europe Skin Permeation Testing Revenue Share (%), by Application 2025 & 2033
- Figure 16: Europe Skin Permeation Testing Revenue (billion), by Type 2025 & 2033
- Figure 17: Europe Skin Permeation Testing Revenue Share (%), by Type 2025 & 2033
- Figure 18: Europe Skin Permeation Testing Revenue (billion), by Country 2025 & 2033
- Figure 19: Europe Skin Permeation Testing Revenue Share (%), by Country 2025 & 2033
- Figure 20: Middle East & Africa Skin Permeation Testing Revenue (billion), by Application 2025 & 2033
- Figure 21: Middle East & Africa Skin Permeation Testing Revenue Share (%), by Application 2025 & 2033
- Figure 22: Middle East & Africa Skin Permeation Testing Revenue (billion), by Type 2025 & 2033
- Figure 23: Middle East & Africa Skin Permeation Testing Revenue Share (%), by Type 2025 & 2033
- Figure 24: Middle East & Africa Skin Permeation Testing Revenue (billion), by Country 2025 & 2033
- Figure 25: Middle East & Africa Skin Permeation Testing Revenue Share (%), by Country 2025 & 2033
- Figure 26: Asia Pacific Skin Permeation Testing Revenue (billion), by Application 2025 & 2033
- Figure 27: Asia Pacific Skin Permeation Testing Revenue Share (%), by Application 2025 & 2033
- Figure 28: Asia Pacific Skin Permeation Testing Revenue (billion), by Type 2025 & 2033
- Figure 29: Asia Pacific Skin Permeation Testing Revenue Share (%), by Type 2025 & 2033
- Figure 30: Asia Pacific Skin Permeation Testing Revenue (billion), by Country 2025 & 2033
- Figure 31: Asia Pacific Skin Permeation Testing Revenue Share (%), by Country 2025 & 2033
List of Tables
- Table 1: Global Skin Permeation Testing Revenue billion Forecast, by Application 2020 & 2033
- Table 2: Global Skin Permeation Testing Revenue billion Forecast, by Type 2020 & 2033
- Table 3: Global Skin Permeation Testing Revenue billion Forecast, by Region 2020 & 2033
- Table 4: Global Skin Permeation Testing Revenue billion Forecast, by Application 2020 & 2033
- Table 5: Global Skin Permeation Testing Revenue billion Forecast, by Type 2020 & 2033
- Table 6: Global Skin Permeation Testing Revenue billion Forecast, by Country 2020 & 2033
- Table 7: United States Skin Permeation Testing Revenue (billion) Forecast, by Application 2020 & 2033
- Table 8: Canada Skin Permeation Testing Revenue (billion) Forecast, by Application 2020 & 2033
- Table 9: Mexico Skin Permeation Testing Revenue (billion) Forecast, by Application 2020 & 2033
- Table 10: Global Skin Permeation Testing Revenue billion Forecast, by Application 2020 & 2033
- Table 11: Global Skin Permeation Testing Revenue billion Forecast, by Type 2020 & 2033
- Table 12: Global Skin Permeation Testing Revenue billion Forecast, by Country 2020 & 2033
- Table 13: Brazil Skin Permeation Testing Revenue (billion) Forecast, by Application 2020 & 2033
- Table 14: Argentina Skin Permeation Testing Revenue (billion) Forecast, by Application 2020 & 2033
- Table 15: Rest of South America Skin Permeation Testing Revenue (billion) Forecast, by Application 2020 & 2033
- Table 16: Global Skin Permeation Testing Revenue billion Forecast, by Application 2020 & 2033
- Table 17: Global Skin Permeation Testing Revenue billion Forecast, by Type 2020 & 2033
- Table 18: Global Skin Permeation Testing Revenue billion Forecast, by Country 2020 & 2033
- Table 19: United Kingdom Skin Permeation Testing Revenue (billion) Forecast, by Application 2020 & 2033
- Table 20: Germany Skin Permeation Testing Revenue (billion) Forecast, by Application 2020 & 2033
- Table 21: France Skin Permeation Testing Revenue (billion) Forecast, by Application 2020 & 2033
- Table 22: Italy Skin Permeation Testing Revenue (billion) Forecast, by Application 2020 & 2033
- Table 23: Spain Skin Permeation Testing Revenue (billion) Forecast, by Application 2020 & 2033
- Table 24: Russia Skin Permeation Testing Revenue (billion) Forecast, by Application 2020 & 2033
- Table 25: Benelux Skin Permeation Testing Revenue (billion) Forecast, by Application 2020 & 2033
- Table 26: Nordics Skin Permeation Testing Revenue (billion) Forecast, by Application 2020 & 2033
- Table 27: Rest of Europe Skin Permeation Testing Revenue (billion) Forecast, by Application 2020 & 2033
- Table 28: Global Skin Permeation Testing Revenue billion Forecast, by Application 2020 & 2033
- Table 29: Global Skin Permeation Testing Revenue billion Forecast, by Type 2020 & 2033
- Table 30: Global Skin Permeation Testing Revenue billion Forecast, by Country 2020 & 2033
- Table 31: Turkey Skin Permeation Testing Revenue (billion) Forecast, by Application 2020 & 2033
- Table 32: Israel Skin Permeation Testing Revenue (billion) Forecast, by Application 2020 & 2033
- Table 33: GCC Skin Permeation Testing Revenue (billion) Forecast, by Application 2020 & 2033
- Table 34: North Africa Skin Permeation Testing Revenue (billion) Forecast, by Application 2020 & 2033
- Table 35: South Africa Skin Permeation Testing Revenue (billion) Forecast, by Application 2020 & 2033
- Table 36: Rest of Middle East & Africa Skin Permeation Testing Revenue (billion) Forecast, by Application 2020 & 2033
- Table 37: Global Skin Permeation Testing Revenue billion Forecast, by Application 2020 & 2033
- Table 38: Global Skin Permeation Testing Revenue billion Forecast, by Type 2020 & 2033
- Table 39: Global Skin Permeation Testing Revenue billion Forecast, by Country 2020 & 2033
- Table 40: China Skin Permeation Testing Revenue (billion) Forecast, by Application 2020 & 2033
- Table 41: India Skin Permeation Testing Revenue (billion) Forecast, by Application 2020 & 2033
- Table 42: Japan Skin Permeation Testing Revenue (billion) Forecast, by Application 2020 & 2033
- Table 43: South Korea Skin Permeation Testing Revenue (billion) Forecast, by Application 2020 & 2033
- Table 44: ASEAN Skin Permeation Testing Revenue (billion) Forecast, by Application 2020 & 2033
- Table 45: Oceania Skin Permeation Testing Revenue (billion) Forecast, by Application 2020 & 2033
- Table 46: Rest of Asia Pacific Skin Permeation Testing Revenue (billion) Forecast, by Application 2020 & 2033
Frequently Asked Questions
1. What is the projected Compound Annual Growth Rate (CAGR) of the Skin Permeation Testing?
The projected CAGR is approximately 12.6%.
2. Which companies are prominent players in the Skin Permeation Testing?
Key companies in the market include Charles River Laboratories, Xenometrix, Intertek, Eurofins, Tergus Pharma, SGS, Nelson Labs, Revivo BioSystems, Stira Pharmaceuticals, Raptim Research, MedPharm, CPL, Diteba, Topical Products Testing, InVitro Research Solutions, Nuvisan, QPS, CD Formulation, Frontage, Mingjie Pharmaceutical.
3. What are the main segments of the Skin Permeation Testing?
The market segments include Application, Type.
4. Can you provide details about the market size?
The market size is estimated to be USD 13.9 billion as of 2022.
5. What are some drivers contributing to market growth?
N/A
6. What are the notable trends driving market growth?
N/A
7. Are there any restraints impacting market growth?
N/A
8. Can you provide examples of recent developments in the market?
N/A
9. What pricing options are available for accessing the report?
Pricing options include single-user, multi-user, and enterprise licenses priced at USD 3950.00, USD 5925.00, and USD 7900.00 respectively.
10. Is the market size provided in terms of value or volume?
The market size is provided in terms of value, measured in billion.
11. Are there any specific market keywords associated with the report?
Yes, the market keyword associated with the report is "Skin Permeation Testing," which aids in identifying and referencing the specific market segment covered.
12. How do I determine which pricing option suits my needs best?
The pricing options vary based on user requirements and access needs. Individual users may opt for single-user licenses, while businesses requiring broader access may choose multi-user or enterprise licenses for cost-effective access to the report.
13. Are there any additional resources or data provided in the Skin Permeation Testing report?
While the report offers comprehensive insights, it's advisable to review the specific contents or supplementary materials provided to ascertain if additional resources or data are available.
14. How can I stay updated on further developments or reports in the Skin Permeation Testing?
To stay informed about further developments, trends, and reports in the Skin Permeation Testing, consider subscribing to industry newsletters, following relevant companies and organizations, or regularly checking reputable industry news sources and publications.
Methodology
Step 1 - Identification of Relevant Samples Size from Population Database



Step 2 - Approaches for Defining Global Market Size (Value, Volume* & Price*)

Note*: In applicable scenarios
Step 3 - Data Sources
Primary Research
- Web Analytics
- Survey Reports
- Research Institute
- Latest Research Reports
- Opinion Leaders
Secondary Research
- Annual Reports
- White Paper
- Latest Press Release
- Industry Association
- Paid Database
- Investor Presentations

Step 4 - Data Triangulation
Involves using different sources of information in order to increase the validity of a study
These sources are likely to be stakeholders in a program - participants, other researchers, program staff, other community members, and so on.
Then we put all data in single framework & apply various statistical tools to find out the dynamic on the market.
During the analysis stage, feedback from the stakeholder groups would be compared to determine areas of agreement as well as areas of divergence