

Key Insights
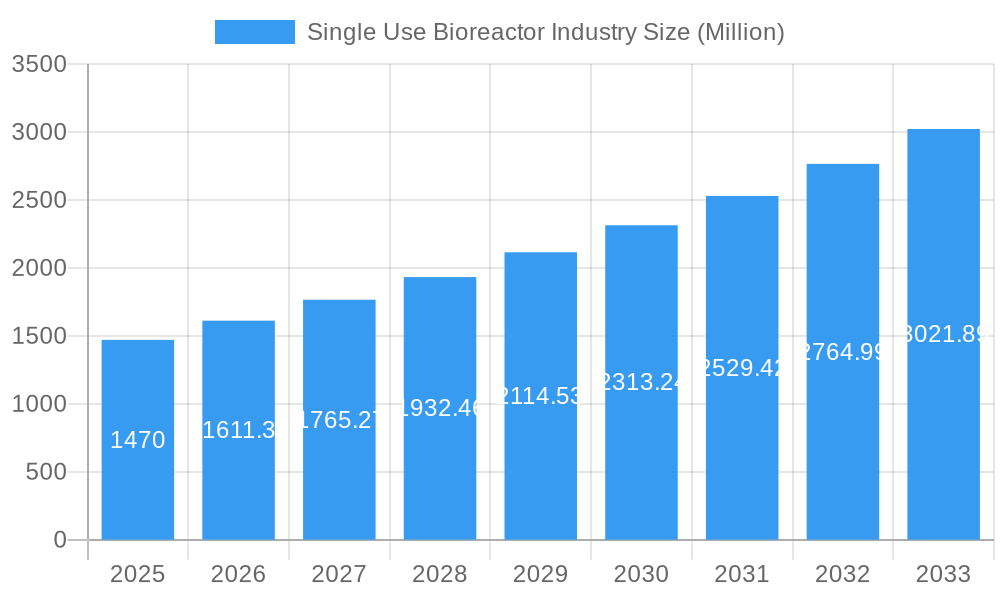
The single-use bioreactor market is experiencing robust growth, driven by increasing demand for biopharmaceuticals, advancements in cell culture technologies, and a rising preference for single-use systems over traditional stainless steel bioreactors. The market, valued at $1.47 billion in 2025, is projected to exhibit a Compound Annual Growth Rate (CAGR) of 9.70% from 2025 to 2033. This expansion is fueled by several key factors. Firstly, the surging need for vaccines, monoclonal antibodies, and other biologics to treat a wide range of diseases is significantly boosting demand. Secondly, single-use bioreactors offer advantages such as reduced cleaning and sterilization costs, faster turnaround times, and minimized risk of cross-contamination, making them increasingly attractive to pharmaceutical and biopharmaceutical companies. The growing adoption of advanced cell lines, particularly mammalian cells, further contributes to market growth. Finally, the increasing outsourcing of bioprocessing activities to Contract Research Organizations (CROs) is also driving market expansion. Geographic segmentation reveals a strong presence across North America and Europe, with Asia-Pacific emerging as a rapidly growing region due to expanding biopharmaceutical manufacturing capabilities in countries like China and India.
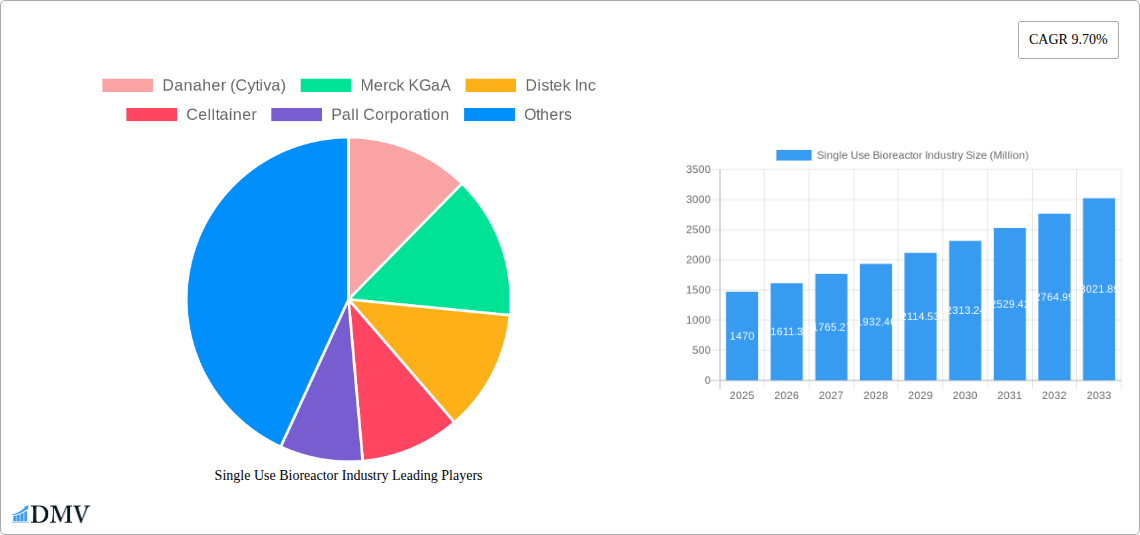
Single Use Bioreactor Industry Market Size (In Billion)
The market segmentation highlights the significant contributions of various product types, cell types, and molecule types. Single-use bioreactor systems form a substantial portion of the market, followed by media bags and filtration assemblies. Mammalian cells are currently the dominant cell type used in single-use bioreactors, reflecting the high demand for complex biologics. Vaccines and monoclonal antibodies constitute major applications, indicating a strong link between market growth and the evolving landscape of therapeutic development. The pharmaceutical and biopharmaceutical industries remain the largest end-users, although CROs are playing an increasingly crucial role in driving market growth through their outsourcing of bioprocessing services. While regulatory hurdles and the relatively high initial investment associated with single-use bioreactor systems may act as restraints, the overall market outlook remains positive, indicating sustained growth throughout the forecast period driven by technological advancements and increasing demand for biologics.
Single Use Bioreactor Industry Company Market Share
Single Use Bioreactor Industry: A Comprehensive Market Report (2019-2033)
This insightful report provides a comprehensive analysis of the Single Use Bioreactor market, offering crucial data and forecasts for stakeholders across the pharmaceutical, biopharmaceutical, and contract research organization (CRO) sectors. The study period covers 2019-2033, with 2025 as the base and estimated year. The report projects a market value exceeding XX Million by 2033, fueled by technological advancements and increasing demand for efficient biopharmaceutical manufacturing. This in-depth analysis unveils market dynamics, competitive landscapes, and future opportunities within this rapidly evolving industry.
Single Use Bioreactor Industry Market Composition & Trends
This section delves into the intricate structure of the single-use bioreactor market, evaluating its concentration, innovation drivers, regulatory landscape, substitute products, end-user profiles, and mergers & acquisitions (M&A) activities. The market is characterized by a moderately concentrated landscape, with key players such as Danaher (Cytiva), Merck KGaA, Sartorius AG, and Thermo Fisher Scientific holding significant market share. However, smaller players are also emerging, contributing to a dynamic competitive environment.
- Market Share Distribution: Danaher (Cytiva) holds an estimated XX% market share, followed by Sartorius AG at XX%, Thermo Fisher Scientific at XX%, and Merck KGaA at XX%. The remaining market share is distributed among other significant players and smaller niche companies.
- Innovation Catalysts: Continuous advancements in bioreactor design, automation, and process analytical technology (PAT) are key drivers of market growth. The demand for single-use systems is further boosted by the increasing adoption of continuous manufacturing processes.
- Regulatory Landscape: Stringent regulatory guidelines concerning Good Manufacturing Practices (GMP) for biopharmaceutical manufacturing influence the adoption of single-use bioreactors due to their inherent sterility and reduced risk of contamination.
- Substitute Products: While traditional stainless steel bioreactors remain in use, their higher capital investment costs and cleaning validation requirements are driving a shift toward single-use systems.
- End-User Profiles: The pharmaceutical and biopharmaceutical industries are the primary end-users, followed by CROs which are increasingly adopting single-use technologies for cost efficiency and flexibility.
- M&A Activities: The market has witnessed significant M&A activity in recent years, with deal values exceeding XX Million in the last five years. These acquisitions reflect the strategic importance of single-use technology within the broader bioprocessing industry.
Single Use Bioreactor Industry Industry Evolution
The single-use bioreactor industry has witnessed remarkable growth during the historical period (2019-2024), with a compound annual growth rate (CAGR) of approximately XX%. This expansion is projected to continue during the forecast period (2025-2033), driven by several key factors. The increasing demand for biologics, particularly monoclonal antibodies and vaccines, is a primary driver. Technological advancements, such as the development of larger-scale bioreactors and improved sensor technologies, have also contributed significantly to market expansion. Moreover, the growing preference for single-use systems due to their enhanced flexibility, reduced cleaning validation needs, and lower risk of contamination has propelled market growth. The shift toward personalized medicine and the growing adoption of cell and gene therapies are additional drivers. The market's evolution is also shaped by continuous innovations in bioreactor design, automation, and process monitoring technologies, enhancing efficiency and scalability. The adoption of single-use systems is increasingly widespread, with a notable shift from traditional stainless steel bioreactors across various applications. The industry is witnessing increased investment in R&D and manufacturing capabilities to meet the rising demand. This combined effect of technological advancements and evolving market demands has led to a robust and expanding single-use bioreactor market.
Leading Regions, Countries, or Segments in Single Use Bioreactor Industry
North America currently dominates the single-use bioreactor market, driven by robust investments in biopharmaceutical research and development, strong regulatory support, and the presence of major industry players. Europe follows as a significant market, while the Asia-Pacific region demonstrates high growth potential due to rising healthcare expenditure and increasing biopharmaceutical manufacturing activities.
Key Drivers:
- North America: High R&D spending, stringent regulatory frameworks, established biopharmaceutical industry, and strong presence of major players.
- Europe: Significant investments in life sciences, supportive regulatory environment, and a growing focus on innovation within the biopharmaceutical sector.
- Asia-Pacific: Rapidly growing healthcare sector, increasing government support for biopharmaceutical manufacturing, and a rising middle class driving greater demand for healthcare products.
Dominance Factors: The dominance of North America and Europe is primarily attributed to the early adoption of single-use technologies, strong regulatory support, and the presence of well-established biopharmaceutical companies. The Asia-Pacific region's growth is driven by increasing investments in infrastructure and technology, alongside supportive government policies. The Mammalian Cell segment currently holds the largest market share among cell types due to its widespread use in the production of therapeutic proteins. Similarly, Monoclonal Antibodies dominate the molecule type segment, driven by high demand in the pharmaceutical and biopharmaceutical industries. Among product types, Single-use Bioreactor Systems holds the largest market share. Finally, the Pharmaceutical and Biopharmaceutical Industries segment constitutes the major end-user market.
Single Use Bioreactor Industry Product Innovations
Recent innovations focus on enhancing scalability, process control, and automation. Next-generation single-use bioreactors incorporate advanced sensors and control systems for real-time monitoring of critical process parameters. These improvements enable more efficient cell culture processes and higher product yields. The integration of advanced analytics and machine learning algorithms is further optimizing process development and manufacturing. Unique selling propositions include improved cell growth and productivity, enhanced sterility assurance, and reduced operational costs.
Propelling Factors for Single Use Bioreactor Industry Growth
Several factors contribute to the growth of the single-use bioreactor market. The increasing demand for biologics, particularly monoclonal antibodies and vaccines, is a primary driver. Technological advancements in bioreactor design and automation are enhancing efficiency and scalability. Furthermore, regulatory support for single-use systems, due to their reduced risk of contamination, fuels adoption. The rising adoption of continuous manufacturing processes further boosts market growth.
Obstacles in the Single Use Bioreactor Industry Market
The single-use bioreactor market faces challenges such as high initial investment costs for advanced systems. Supply chain disruptions, particularly those related to raw materials, can impact manufacturing. Furthermore, competition among established and emerging players creates pressure on pricing and market share. Stringent regulatory requirements for biopharmaceutical manufacturing increase the complexity of product development and approval.
Future Opportunities in Single Use Bioreactor Industry
Emerging opportunities lie in the development of novel single-use bioreactor designs for cell and gene therapies. Expansion into emerging markets presents significant growth potential. Integration of advanced analytics and artificial intelligence for process optimization offers substantial benefits. Customization of bioreactors to meet the specific needs of various cell lines and molecules will also drive market expansion.
Major Players in the Single Use Bioreactor Industry Ecosystem
- Danaher (Cytiva)
- Merck KGaA
- Distek Inc
- Celltainer
- Pall Corporation
- Eppendorf SE
- Sartorius AG
- Thermo Fisher Scientific
- OmniBRx Biotechnologies
- ABEC
Key Developments in Single Use Bioreactor Industry Industry
- June 2022: mAbxience equipped their cGMP facility in León, Spain with an additional ABEC 4,000L CSR bioreactor, expanding their CDMO capacity using single-use technology.
- May 2022: RD-Biotech partnered with Pall Corporation to leverage single-use solutions and purification technology for GMP-grade pDNA manufacturing.
Strategic Single Use Bioreactor Industry Market Forecast
The single-use bioreactor market is poised for continued expansion, driven by technological innovation and increasing demand for biopharmaceuticals. The market is expected to witness substantial growth, exceeding XX Million by 2033. Emerging technologies and applications will create further opportunities for market players, shaping a dynamic and promising future for the industry.
Single Use Bioreactor Industry Segmentation
-
1. Type of Product
- 1.1. Single-use Bioreactor Systems
- 1.2. Media Bags
- 1.3. Filtration Assemblies
- 1.4. Other Products
-
2. Cell Type
- 2.1. Mammalian Cell
- 2.2. Bacteria
- 2.3. Yeast
- 2.4. Other Cell Types
-
3. Molecule Type
- 3.1. Vaccines
- 3.2. Monoclonal Antibodies
- 3.3. Stem Cells
- 3.4. Recombinant Proteins
- 3.5. Other Molecule Types
-
4. End User
- 4.1. Pharmaceutical and Biopharmaceutical Industries
- 4.2. Contract Research Organizations (CRO)
- 4.3. Other End Users
Single Use Bioreactor Industry Segmentation By Geography
-
1. North America
- 1.1. United States
- 1.2. Canada
- 1.3. Mexico
-
2. Europe
- 2.1. Germany
- 2.2. United Kingdom
- 2.3. France
- 2.4. Italy
- 2.5. Spain
- 2.6. Rest of Europe
-
3. Asia Pacific
- 3.1. China
- 3.2. Japan
- 3.3. India
- 3.4. Australia
- 3.5. South Korea
- 3.6. Rest of Asia Pacific
-
4. Middle East and Africa
- 4.1. GCC
- 4.2. South Africa
- 4.3. Rest of Middle East and Africa
-
5. South America
- 5.1. Brazil
- 5.2. Argentina
- 5.3. Rest of South America

Single Use Bioreactor Industry Regional Market Share
Geographic Coverage of Single Use Bioreactor Industry
Single Use Bioreactor Industry REPORT HIGHLIGHTS
| Aspects | Details |
|---|---|
| Study Period | 2020-2034 |
| Base Year | 2025 |
| Estimated Year | 2026 |
| Forecast Period | 2026-2034 |
| Historical Period | 2020-2025 |
| Growth Rate | CAGR of 9.70% from 2020-2034 |
| Segmentation |
|
Table of Contents
- 1. Introduction
- 1.1. Research Scope
- 1.2. Market Segmentation
- 1.3. Research Objective
- 1.4. Definitions and Assumptions
- 2. Executive Summary
- 2.1. Market Snapshot
- 3. Market Dynamics
- 3.1. Market Drivers
- 3.2. Market Restrains
- 3.3. Market Trends
- 3.4. Market Opportunities
- 4. Market Factor Analysis
- 4.1. Porters Five Forces
- 4.1.1. Bargaining Power of Suppliers
- 4.1.2. Bargaining Power of Buyers
- 4.1.3. Threat of New Entrants
- 4.1.4. Threat of Substitutes
- 4.1.5. Competitive Rivalry
- 4.2. PESTEL analysis
- 4.3. BCG Analysis
- 4.3.1. Stars (High Growth, High Market Share)
- 4.3.2. Cash Cows (Low Growth, High Market Share)
- 4.3.3. Question Mark (High Growth, Low Market Share)
- 4.3.4. Dogs (Low Growth, Low Market Share)
- 4.4. Ansoff Matrix Analysis
- 4.5. Supply Chain Analysis
- 4.6. Regulatory Landscape
- 4.7. Current Market Potential and Opportunity Assessment (TAM–SAM–SOM Framework)
- 4.8. DMV Analyst Note
- 4.1. Porters Five Forces
- 5. Market Analysis, Insights and Forecast 2021-2033
- 5.1. Market Analysis, Insights and Forecast - by Type of Product
- 5.1.1. Single-use Bioreactor Systems
- 5.1.2. Media Bags
- 5.1.3. Filtration Assemblies
- 5.1.4. Other Products
- 5.2. Market Analysis, Insights and Forecast - by Cell Type
- 5.2.1. Mammalian Cell
- 5.2.2. Bacteria
- 5.2.3. Yeast
- 5.2.4. Other Cell Types
- 5.3. Market Analysis, Insights and Forecast - by Molecule Type
- 5.3.1. Vaccines
- 5.3.2. Monoclonal Antibodies
- 5.3.3. Stem Cells
- 5.3.4. Recombinant Proteins
- 5.3.5. Other Molecule Types
- 5.4. Market Analysis, Insights and Forecast - by End User
- 5.4.1. Pharmaceutical and Biopharmaceutical Industries
- 5.4.2. Contract Research Organizations (CRO)
- 5.4.3. Other End Users
- 5.5. Market Analysis, Insights and Forecast - by Region
- 5.5.1. North America
- 5.5.2. Europe
- 5.5.3. Asia Pacific
- 5.5.4. Middle East and Africa
- 5.5.5. South America
- 5.1. Market Analysis, Insights and Forecast - by Type of Product
- 6. Global Single Use Bioreactor Industry Analysis, Insights and Forecast, 2021-2033
- 6.1. Market Analysis, Insights and Forecast - by Type of Product
- 6.1.1. Single-use Bioreactor Systems
- 6.1.2. Media Bags
- 6.1.3. Filtration Assemblies
- 6.1.4. Other Products
- 6.2. Market Analysis, Insights and Forecast - by Cell Type
- 6.2.1. Mammalian Cell
- 6.2.2. Bacteria
- 6.2.3. Yeast
- 6.2.4. Other Cell Types
- 6.3. Market Analysis, Insights and Forecast - by Molecule Type
- 6.3.1. Vaccines
- 6.3.2. Monoclonal Antibodies
- 6.3.3. Stem Cells
- 6.3.4. Recombinant Proteins
- 6.3.5. Other Molecule Types
- 6.4. Market Analysis, Insights and Forecast - by End User
- 6.4.1. Pharmaceutical and Biopharmaceutical Industries
- 6.4.2. Contract Research Organizations (CRO)
- 6.4.3. Other End Users
- 6.1. Market Analysis, Insights and Forecast - by Type of Product
- 7. North America Single Use Bioreactor Industry Analysis, Insights and Forecast, 2020-2032
- 7.1. Market Analysis, Insights and Forecast - by Type of Product
- 7.1.1. Single-use Bioreactor Systems
- 7.1.2. Media Bags
- 7.1.3. Filtration Assemblies
- 7.1.4. Other Products
- 7.2. Market Analysis, Insights and Forecast - by Cell Type
- 7.2.1. Mammalian Cell
- 7.2.2. Bacteria
- 7.2.3. Yeast
- 7.2.4. Other Cell Types
- 7.3. Market Analysis, Insights and Forecast - by Molecule Type
- 7.3.1. Vaccines
- 7.3.2. Monoclonal Antibodies
- 7.3.3. Stem Cells
- 7.3.4. Recombinant Proteins
- 7.3.5. Other Molecule Types
- 7.4. Market Analysis, Insights and Forecast - by End User
- 7.4.1. Pharmaceutical and Biopharmaceutical Industries
- 7.4.2. Contract Research Organizations (CRO)
- 7.4.3. Other End Users
- 7.1. Market Analysis, Insights and Forecast - by Type of Product
- 8. Europe Single Use Bioreactor Industry Analysis, Insights and Forecast, 2020-2032
- 8.1. Market Analysis, Insights and Forecast - by Type of Product
- 8.1.1. Single-use Bioreactor Systems
- 8.1.2. Media Bags
- 8.1.3. Filtration Assemblies
- 8.1.4. Other Products
- 8.2. Market Analysis, Insights and Forecast - by Cell Type
- 8.2.1. Mammalian Cell
- 8.2.2. Bacteria
- 8.2.3. Yeast
- 8.2.4. Other Cell Types
- 8.3. Market Analysis, Insights and Forecast - by Molecule Type
- 8.3.1. Vaccines
- 8.3.2. Monoclonal Antibodies
- 8.3.3. Stem Cells
- 8.3.4. Recombinant Proteins
- 8.3.5. Other Molecule Types
- 8.4. Market Analysis, Insights and Forecast - by End User
- 8.4.1. Pharmaceutical and Biopharmaceutical Industries
- 8.4.2. Contract Research Organizations (CRO)
- 8.4.3. Other End Users
- 8.1. Market Analysis, Insights and Forecast - by Type of Product
- 9. Asia Pacific Single Use Bioreactor Industry Analysis, Insights and Forecast, 2020-2032
- 9.1. Market Analysis, Insights and Forecast - by Type of Product
- 9.1.1. Single-use Bioreactor Systems
- 9.1.2. Media Bags
- 9.1.3. Filtration Assemblies
- 9.1.4. Other Products
- 9.2. Market Analysis, Insights and Forecast - by Cell Type
- 9.2.1. Mammalian Cell
- 9.2.2. Bacteria
- 9.2.3. Yeast
- 9.2.4. Other Cell Types
- 9.3. Market Analysis, Insights and Forecast - by Molecule Type
- 9.3.1. Vaccines
- 9.3.2. Monoclonal Antibodies
- 9.3.3. Stem Cells
- 9.3.4. Recombinant Proteins
- 9.3.5. Other Molecule Types
- 9.4. Market Analysis, Insights and Forecast - by End User
- 9.4.1. Pharmaceutical and Biopharmaceutical Industries
- 9.4.2. Contract Research Organizations (CRO)
- 9.4.3. Other End Users
- 9.1. Market Analysis, Insights and Forecast - by Type of Product
- 10. Middle East and Africa Single Use Bioreactor Industry Analysis, Insights and Forecast, 2020-2032
- 10.1. Market Analysis, Insights and Forecast - by Type of Product
- 10.1.1. Single-use Bioreactor Systems
- 10.1.2. Media Bags
- 10.1.3. Filtration Assemblies
- 10.1.4. Other Products
- 10.2. Market Analysis, Insights and Forecast - by Cell Type
- 10.2.1. Mammalian Cell
- 10.2.2. Bacteria
- 10.2.3. Yeast
- 10.2.4. Other Cell Types
- 10.3. Market Analysis, Insights and Forecast - by Molecule Type
- 10.3.1. Vaccines
- 10.3.2. Monoclonal Antibodies
- 10.3.3. Stem Cells
- 10.3.4. Recombinant Proteins
- 10.3.5. Other Molecule Types
- 10.4. Market Analysis, Insights and Forecast - by End User
- 10.4.1. Pharmaceutical and Biopharmaceutical Industries
- 10.4.2. Contract Research Organizations (CRO)
- 10.4.3. Other End Users
- 10.1. Market Analysis, Insights and Forecast - by Type of Product
- 11. South America Single Use Bioreactor Industry Analysis, Insights and Forecast, 2020-2032
- 11.1. Market Analysis, Insights and Forecast - by Type of Product
- 11.1.1. Single-use Bioreactor Systems
- 11.1.2. Media Bags
- 11.1.3. Filtration Assemblies
- 11.1.4. Other Products
- 11.2. Market Analysis, Insights and Forecast - by Cell Type
- 11.2.1. Mammalian Cell
- 11.2.2. Bacteria
- 11.2.3. Yeast
- 11.2.4. Other Cell Types
- 11.3. Market Analysis, Insights and Forecast - by Molecule Type
- 11.3.1. Vaccines
- 11.3.2. Monoclonal Antibodies
- 11.3.3. Stem Cells
- 11.3.4. Recombinant Proteins
- 11.3.5. Other Molecule Types
- 11.4. Market Analysis, Insights and Forecast - by End User
- 11.4.1. Pharmaceutical and Biopharmaceutical Industries
- 11.4.2. Contract Research Organizations (CRO)
- 11.4.3. Other End Users
- 11.1. Market Analysis, Insights and Forecast - by Type of Product
- 12. Competitive Analysis
- 12.1. Company Profiles
- 12.1.1 Danaher (Cytiva)
- 12.1.1.1. Company Overview
- 12.1.1.2. Products
- 12.1.1.3. Company Financials
- 12.1.1.4. SWOT Analysis
- 12.1.2 Merck KGaA
- 12.1.2.1. Company Overview
- 12.1.2.2. Products
- 12.1.2.3. Company Financials
- 12.1.2.4. SWOT Analysis
- 12.1.3 Distek Inc
- 12.1.3.1. Company Overview
- 12.1.3.2. Products
- 12.1.3.3. Company Financials
- 12.1.3.4. SWOT Analysis
- 12.1.4 Celltainer
- 12.1.4.1. Company Overview
- 12.1.4.2. Products
- 12.1.4.3. Company Financials
- 12.1.4.4. SWOT Analysis
- 12.1.5 Pall Corporation
- 12.1.5.1. Company Overview
- 12.1.5.2. Products
- 12.1.5.3. Company Financials
- 12.1.5.4. SWOT Analysis
- 12.1.6 Eppendorf SE
- 12.1.6.1. Company Overview
- 12.1.6.2. Products
- 12.1.6.3. Company Financials
- 12.1.6.4. SWOT Analysis
- 12.1.7 Sartorius AG
- 12.1.7.1. Company Overview
- 12.1.7.2. Products
- 12.1.7.3. Company Financials
- 12.1.7.4. SWOT Analysis
- 12.1.8 Thermo Fisher Scientific
- 12.1.8.1. Company Overview
- 12.1.8.2. Products
- 12.1.8.3. Company Financials
- 12.1.8.4. SWOT Analysis
- 12.1.9 OmniBRx Biotechnologies
- 12.1.9.1. Company Overview
- 12.1.9.2. Products
- 12.1.9.3. Company Financials
- 12.1.9.4. SWOT Analysis
- 12.1.10 ABEC
- 12.1.10.1. Company Overview
- 12.1.10.2. Products
- 12.1.10.3. Company Financials
- 12.1.10.4. SWOT Analysis
- 12.1.1 Danaher (Cytiva)
- 12.2. Market Entropy
- 12.2.1 Company's Key Areas Served
- 12.2.2 Recent Developments
- 12.3. Company Market Share Analysis 2025
- 12.3.1 Top 5 Companies Market Share Analysis
- 12.3.2 Top 3 Companies Market Share Analysis
- 12.4. List of Potential Customers
- 13. Research Methodology
List of Figures
- Figure 1: Global Single Use Bioreactor Industry Revenue Breakdown (Million, %) by Region 2025 & 2033
- Figure 2: Global Single Use Bioreactor Industry Volume Breakdown (K Units, %) by Region 2025 & 2033
- Figure 3: North America Single Use Bioreactor Industry Revenue (Million), by Type of Product 2025 & 2033
- Figure 4: North America Single Use Bioreactor Industry Volume (K Units), by Type of Product 2025 & 2033
- Figure 5: North America Single Use Bioreactor Industry Revenue Share (%), by Type of Product 2025 & 2033
- Figure 6: North America Single Use Bioreactor Industry Volume Share (%), by Type of Product 2025 & 2033
- Figure 7: North America Single Use Bioreactor Industry Revenue (Million), by Cell Type 2025 & 2033
- Figure 8: North America Single Use Bioreactor Industry Volume (K Units), by Cell Type 2025 & 2033
- Figure 9: North America Single Use Bioreactor Industry Revenue Share (%), by Cell Type 2025 & 2033
- Figure 10: North America Single Use Bioreactor Industry Volume Share (%), by Cell Type 2025 & 2033
- Figure 11: North America Single Use Bioreactor Industry Revenue (Million), by Molecule Type 2025 & 2033
- Figure 12: North America Single Use Bioreactor Industry Volume (K Units), by Molecule Type 2025 & 2033
- Figure 13: North America Single Use Bioreactor Industry Revenue Share (%), by Molecule Type 2025 & 2033
- Figure 14: North America Single Use Bioreactor Industry Volume Share (%), by Molecule Type 2025 & 2033
- Figure 15: North America Single Use Bioreactor Industry Revenue (Million), by End User 2025 & 2033
- Figure 16: North America Single Use Bioreactor Industry Volume (K Units), by End User 2025 & 2033
- Figure 17: North America Single Use Bioreactor Industry Revenue Share (%), by End User 2025 & 2033
- Figure 18: North America Single Use Bioreactor Industry Volume Share (%), by End User 2025 & 2033
- Figure 19: North America Single Use Bioreactor Industry Revenue (Million), by Country 2025 & 2033
- Figure 20: North America Single Use Bioreactor Industry Volume (K Units), by Country 2025 & 2033
- Figure 21: North America Single Use Bioreactor Industry Revenue Share (%), by Country 2025 & 2033
- Figure 22: North America Single Use Bioreactor Industry Volume Share (%), by Country 2025 & 2033
- Figure 23: Europe Single Use Bioreactor Industry Revenue (Million), by Type of Product 2025 & 2033
- Figure 24: Europe Single Use Bioreactor Industry Volume (K Units), by Type of Product 2025 & 2033
- Figure 25: Europe Single Use Bioreactor Industry Revenue Share (%), by Type of Product 2025 & 2033
- Figure 26: Europe Single Use Bioreactor Industry Volume Share (%), by Type of Product 2025 & 2033
- Figure 27: Europe Single Use Bioreactor Industry Revenue (Million), by Cell Type 2025 & 2033
- Figure 28: Europe Single Use Bioreactor Industry Volume (K Units), by Cell Type 2025 & 2033
- Figure 29: Europe Single Use Bioreactor Industry Revenue Share (%), by Cell Type 2025 & 2033
- Figure 30: Europe Single Use Bioreactor Industry Volume Share (%), by Cell Type 2025 & 2033
- Figure 31: Europe Single Use Bioreactor Industry Revenue (Million), by Molecule Type 2025 & 2033
- Figure 32: Europe Single Use Bioreactor Industry Volume (K Units), by Molecule Type 2025 & 2033
- Figure 33: Europe Single Use Bioreactor Industry Revenue Share (%), by Molecule Type 2025 & 2033
- Figure 34: Europe Single Use Bioreactor Industry Volume Share (%), by Molecule Type 2025 & 2033
- Figure 35: Europe Single Use Bioreactor Industry Revenue (Million), by End User 2025 & 2033
- Figure 36: Europe Single Use Bioreactor Industry Volume (K Units), by End User 2025 & 2033
- Figure 37: Europe Single Use Bioreactor Industry Revenue Share (%), by End User 2025 & 2033
- Figure 38: Europe Single Use Bioreactor Industry Volume Share (%), by End User 2025 & 2033
- Figure 39: Europe Single Use Bioreactor Industry Revenue (Million), by Country 2025 & 2033
- Figure 40: Europe Single Use Bioreactor Industry Volume (K Units), by Country 2025 & 2033
- Figure 41: Europe Single Use Bioreactor Industry Revenue Share (%), by Country 2025 & 2033
- Figure 42: Europe Single Use Bioreactor Industry Volume Share (%), by Country 2025 & 2033
- Figure 43: Asia Pacific Single Use Bioreactor Industry Revenue (Million), by Type of Product 2025 & 2033
- Figure 44: Asia Pacific Single Use Bioreactor Industry Volume (K Units), by Type of Product 2025 & 2033
- Figure 45: Asia Pacific Single Use Bioreactor Industry Revenue Share (%), by Type of Product 2025 & 2033
- Figure 46: Asia Pacific Single Use Bioreactor Industry Volume Share (%), by Type of Product 2025 & 2033
- Figure 47: Asia Pacific Single Use Bioreactor Industry Revenue (Million), by Cell Type 2025 & 2033
- Figure 48: Asia Pacific Single Use Bioreactor Industry Volume (K Units), by Cell Type 2025 & 2033
- Figure 49: Asia Pacific Single Use Bioreactor Industry Revenue Share (%), by Cell Type 2025 & 2033
- Figure 50: Asia Pacific Single Use Bioreactor Industry Volume Share (%), by Cell Type 2025 & 2033
- Figure 51: Asia Pacific Single Use Bioreactor Industry Revenue (Million), by Molecule Type 2025 & 2033
- Figure 52: Asia Pacific Single Use Bioreactor Industry Volume (K Units), by Molecule Type 2025 & 2033
- Figure 53: Asia Pacific Single Use Bioreactor Industry Revenue Share (%), by Molecule Type 2025 & 2033
- Figure 54: Asia Pacific Single Use Bioreactor Industry Volume Share (%), by Molecule Type 2025 & 2033
- Figure 55: Asia Pacific Single Use Bioreactor Industry Revenue (Million), by End User 2025 & 2033
- Figure 56: Asia Pacific Single Use Bioreactor Industry Volume (K Units), by End User 2025 & 2033
- Figure 57: Asia Pacific Single Use Bioreactor Industry Revenue Share (%), by End User 2025 & 2033
- Figure 58: Asia Pacific Single Use Bioreactor Industry Volume Share (%), by End User 2025 & 2033
- Figure 59: Asia Pacific Single Use Bioreactor Industry Revenue (Million), by Country 2025 & 2033
- Figure 60: Asia Pacific Single Use Bioreactor Industry Volume (K Units), by Country 2025 & 2033
- Figure 61: Asia Pacific Single Use Bioreactor Industry Revenue Share (%), by Country 2025 & 2033
- Figure 62: Asia Pacific Single Use Bioreactor Industry Volume Share (%), by Country 2025 & 2033
- Figure 63: Middle East and Africa Single Use Bioreactor Industry Revenue (Million), by Type of Product 2025 & 2033
- Figure 64: Middle East and Africa Single Use Bioreactor Industry Volume (K Units), by Type of Product 2025 & 2033
- Figure 65: Middle East and Africa Single Use Bioreactor Industry Revenue Share (%), by Type of Product 2025 & 2033
- Figure 66: Middle East and Africa Single Use Bioreactor Industry Volume Share (%), by Type of Product 2025 & 2033
- Figure 67: Middle East and Africa Single Use Bioreactor Industry Revenue (Million), by Cell Type 2025 & 2033
- Figure 68: Middle East and Africa Single Use Bioreactor Industry Volume (K Units), by Cell Type 2025 & 2033
- Figure 69: Middle East and Africa Single Use Bioreactor Industry Revenue Share (%), by Cell Type 2025 & 2033
- Figure 70: Middle East and Africa Single Use Bioreactor Industry Volume Share (%), by Cell Type 2025 & 2033
- Figure 71: Middle East and Africa Single Use Bioreactor Industry Revenue (Million), by Molecule Type 2025 & 2033
- Figure 72: Middle East and Africa Single Use Bioreactor Industry Volume (K Units), by Molecule Type 2025 & 2033
- Figure 73: Middle East and Africa Single Use Bioreactor Industry Revenue Share (%), by Molecule Type 2025 & 2033
- Figure 74: Middle East and Africa Single Use Bioreactor Industry Volume Share (%), by Molecule Type 2025 & 2033
- Figure 75: Middle East and Africa Single Use Bioreactor Industry Revenue (Million), by End User 2025 & 2033
- Figure 76: Middle East and Africa Single Use Bioreactor Industry Volume (K Units), by End User 2025 & 2033
- Figure 77: Middle East and Africa Single Use Bioreactor Industry Revenue Share (%), by End User 2025 & 2033
- Figure 78: Middle East and Africa Single Use Bioreactor Industry Volume Share (%), by End User 2025 & 2033
- Figure 79: Middle East and Africa Single Use Bioreactor Industry Revenue (Million), by Country 2025 & 2033
- Figure 80: Middle East and Africa Single Use Bioreactor Industry Volume (K Units), by Country 2025 & 2033
- Figure 81: Middle East and Africa Single Use Bioreactor Industry Revenue Share (%), by Country 2025 & 2033
- Figure 82: Middle East and Africa Single Use Bioreactor Industry Volume Share (%), by Country 2025 & 2033
- Figure 83: South America Single Use Bioreactor Industry Revenue (Million), by Type of Product 2025 & 2033
- Figure 84: South America Single Use Bioreactor Industry Volume (K Units), by Type of Product 2025 & 2033
- Figure 85: South America Single Use Bioreactor Industry Revenue Share (%), by Type of Product 2025 & 2033
- Figure 86: South America Single Use Bioreactor Industry Volume Share (%), by Type of Product 2025 & 2033
- Figure 87: South America Single Use Bioreactor Industry Revenue (Million), by Cell Type 2025 & 2033
- Figure 88: South America Single Use Bioreactor Industry Volume (K Units), by Cell Type 2025 & 2033
- Figure 89: South America Single Use Bioreactor Industry Revenue Share (%), by Cell Type 2025 & 2033
- Figure 90: South America Single Use Bioreactor Industry Volume Share (%), by Cell Type 2025 & 2033
- Figure 91: South America Single Use Bioreactor Industry Revenue (Million), by Molecule Type 2025 & 2033
- Figure 92: South America Single Use Bioreactor Industry Volume (K Units), by Molecule Type 2025 & 2033
- Figure 93: South America Single Use Bioreactor Industry Revenue Share (%), by Molecule Type 2025 & 2033
- Figure 94: South America Single Use Bioreactor Industry Volume Share (%), by Molecule Type 2025 & 2033
- Figure 95: South America Single Use Bioreactor Industry Revenue (Million), by End User 2025 & 2033
- Figure 96: South America Single Use Bioreactor Industry Volume (K Units), by End User 2025 & 2033
- Figure 97: South America Single Use Bioreactor Industry Revenue Share (%), by End User 2025 & 2033
- Figure 98: South America Single Use Bioreactor Industry Volume Share (%), by End User 2025 & 2033
- Figure 99: South America Single Use Bioreactor Industry Revenue (Million), by Country 2025 & 2033
- Figure 100: South America Single Use Bioreactor Industry Volume (K Units), by Country 2025 & 2033
- Figure 101: South America Single Use Bioreactor Industry Revenue Share (%), by Country 2025 & 2033
- Figure 102: South America Single Use Bioreactor Industry Volume Share (%), by Country 2025 & 2033
List of Tables
- Table 1: Global Single Use Bioreactor Industry Revenue Million Forecast, by Type of Product 2020 & 2033
- Table 2: Global Single Use Bioreactor Industry Volume K Units Forecast, by Type of Product 2020 & 2033
- Table 3: Global Single Use Bioreactor Industry Revenue Million Forecast, by Cell Type 2020 & 2033
- Table 4: Global Single Use Bioreactor Industry Volume K Units Forecast, by Cell Type 2020 & 2033
- Table 5: Global Single Use Bioreactor Industry Revenue Million Forecast, by Molecule Type 2020 & 2033
- Table 6: Global Single Use Bioreactor Industry Volume K Units Forecast, by Molecule Type 2020 & 2033
- Table 7: Global Single Use Bioreactor Industry Revenue Million Forecast, by End User 2020 & 2033
- Table 8: Global Single Use Bioreactor Industry Volume K Units Forecast, by End User 2020 & 2033
- Table 9: Global Single Use Bioreactor Industry Revenue Million Forecast, by Region 2020 & 2033
- Table 10: Global Single Use Bioreactor Industry Volume K Units Forecast, by Region 2020 & 2033
- Table 11: Global Single Use Bioreactor Industry Revenue Million Forecast, by Type of Product 2020 & 2033
- Table 12: Global Single Use Bioreactor Industry Volume K Units Forecast, by Type of Product 2020 & 2033
- Table 13: Global Single Use Bioreactor Industry Revenue Million Forecast, by Cell Type 2020 & 2033
- Table 14: Global Single Use Bioreactor Industry Volume K Units Forecast, by Cell Type 2020 & 2033
- Table 15: Global Single Use Bioreactor Industry Revenue Million Forecast, by Molecule Type 2020 & 2033
- Table 16: Global Single Use Bioreactor Industry Volume K Units Forecast, by Molecule Type 2020 & 2033
- Table 17: Global Single Use Bioreactor Industry Revenue Million Forecast, by End User 2020 & 2033
- Table 18: Global Single Use Bioreactor Industry Volume K Units Forecast, by End User 2020 & 2033
- Table 19: Global Single Use Bioreactor Industry Revenue Million Forecast, by Country 2020 & 2033
- Table 20: Global Single Use Bioreactor Industry Volume K Units Forecast, by Country 2020 & 2033
- Table 21: United States Single Use Bioreactor Industry Revenue (Million) Forecast, by Application 2020 & 2033
- Table 22: United States Single Use Bioreactor Industry Volume (K Units) Forecast, by Application 2020 & 2033
- Table 23: Canada Single Use Bioreactor Industry Revenue (Million) Forecast, by Application 2020 & 2033
- Table 24: Canada Single Use Bioreactor Industry Volume (K Units) Forecast, by Application 2020 & 2033
- Table 25: Mexico Single Use Bioreactor Industry Revenue (Million) Forecast, by Application 2020 & 2033
- Table 26: Mexico Single Use Bioreactor Industry Volume (K Units) Forecast, by Application 2020 & 2033
- Table 27: Global Single Use Bioreactor Industry Revenue Million Forecast, by Type of Product 2020 & 2033
- Table 28: Global Single Use Bioreactor Industry Volume K Units Forecast, by Type of Product 2020 & 2033
- Table 29: Global Single Use Bioreactor Industry Revenue Million Forecast, by Cell Type 2020 & 2033
- Table 30: Global Single Use Bioreactor Industry Volume K Units Forecast, by Cell Type 2020 & 2033
- Table 31: Global Single Use Bioreactor Industry Revenue Million Forecast, by Molecule Type 2020 & 2033
- Table 32: Global Single Use Bioreactor Industry Volume K Units Forecast, by Molecule Type 2020 & 2033
- Table 33: Global Single Use Bioreactor Industry Revenue Million Forecast, by End User 2020 & 2033
- Table 34: Global Single Use Bioreactor Industry Volume K Units Forecast, by End User 2020 & 2033
- Table 35: Global Single Use Bioreactor Industry Revenue Million Forecast, by Country 2020 & 2033
- Table 36: Global Single Use Bioreactor Industry Volume K Units Forecast, by Country 2020 & 2033
- Table 37: Germany Single Use Bioreactor Industry Revenue (Million) Forecast, by Application 2020 & 2033
- Table 38: Germany Single Use Bioreactor Industry Volume (K Units) Forecast, by Application 2020 & 2033
- Table 39: United Kingdom Single Use Bioreactor Industry Revenue (Million) Forecast, by Application 2020 & 2033
- Table 40: United Kingdom Single Use Bioreactor Industry Volume (K Units) Forecast, by Application 2020 & 2033
- Table 41: France Single Use Bioreactor Industry Revenue (Million) Forecast, by Application 2020 & 2033
- Table 42: France Single Use Bioreactor Industry Volume (K Units) Forecast, by Application 2020 & 2033
- Table 43: Italy Single Use Bioreactor Industry Revenue (Million) Forecast, by Application 2020 & 2033
- Table 44: Italy Single Use Bioreactor Industry Volume (K Units) Forecast, by Application 2020 & 2033
- Table 45: Spain Single Use Bioreactor Industry Revenue (Million) Forecast, by Application 2020 & 2033
- Table 46: Spain Single Use Bioreactor Industry Volume (K Units) Forecast, by Application 2020 & 2033
- Table 47: Rest of Europe Single Use Bioreactor Industry Revenue (Million) Forecast, by Application 2020 & 2033
- Table 48: Rest of Europe Single Use Bioreactor Industry Volume (K Units) Forecast, by Application 2020 & 2033
- Table 49: Global Single Use Bioreactor Industry Revenue Million Forecast, by Type of Product 2020 & 2033
- Table 50: Global Single Use Bioreactor Industry Volume K Units Forecast, by Type of Product 2020 & 2033
- Table 51: Global Single Use Bioreactor Industry Revenue Million Forecast, by Cell Type 2020 & 2033
- Table 52: Global Single Use Bioreactor Industry Volume K Units Forecast, by Cell Type 2020 & 2033
- Table 53: Global Single Use Bioreactor Industry Revenue Million Forecast, by Molecule Type 2020 & 2033
- Table 54: Global Single Use Bioreactor Industry Volume K Units Forecast, by Molecule Type 2020 & 2033
- Table 55: Global Single Use Bioreactor Industry Revenue Million Forecast, by End User 2020 & 2033
- Table 56: Global Single Use Bioreactor Industry Volume K Units Forecast, by End User 2020 & 2033
- Table 57: Global Single Use Bioreactor Industry Revenue Million Forecast, by Country 2020 & 2033
- Table 58: Global Single Use Bioreactor Industry Volume K Units Forecast, by Country 2020 & 2033
- Table 59: China Single Use Bioreactor Industry Revenue (Million) Forecast, by Application 2020 & 2033
- Table 60: China Single Use Bioreactor Industry Volume (K Units) Forecast, by Application 2020 & 2033
- Table 61: Japan Single Use Bioreactor Industry Revenue (Million) Forecast, by Application 2020 & 2033
- Table 62: Japan Single Use Bioreactor Industry Volume (K Units) Forecast, by Application 2020 & 2033
- Table 63: India Single Use Bioreactor Industry Revenue (Million) Forecast, by Application 2020 & 2033
- Table 64: India Single Use Bioreactor Industry Volume (K Units) Forecast, by Application 2020 & 2033
- Table 65: Australia Single Use Bioreactor Industry Revenue (Million) Forecast, by Application 2020 & 2033
- Table 66: Australia Single Use Bioreactor Industry Volume (K Units) Forecast, by Application 2020 & 2033
- Table 67: South Korea Single Use Bioreactor Industry Revenue (Million) Forecast, by Application 2020 & 2033
- Table 68: South Korea Single Use Bioreactor Industry Volume (K Units) Forecast, by Application 2020 & 2033
- Table 69: Rest of Asia Pacific Single Use Bioreactor Industry Revenue (Million) Forecast, by Application 2020 & 2033
- Table 70: Rest of Asia Pacific Single Use Bioreactor Industry Volume (K Units) Forecast, by Application 2020 & 2033
- Table 71: Global Single Use Bioreactor Industry Revenue Million Forecast, by Type of Product 2020 & 2033
- Table 72: Global Single Use Bioreactor Industry Volume K Units Forecast, by Type of Product 2020 & 2033
- Table 73: Global Single Use Bioreactor Industry Revenue Million Forecast, by Cell Type 2020 & 2033
- Table 74: Global Single Use Bioreactor Industry Volume K Units Forecast, by Cell Type 2020 & 2033
- Table 75: Global Single Use Bioreactor Industry Revenue Million Forecast, by Molecule Type 2020 & 2033
- Table 76: Global Single Use Bioreactor Industry Volume K Units Forecast, by Molecule Type 2020 & 2033
- Table 77: Global Single Use Bioreactor Industry Revenue Million Forecast, by End User 2020 & 2033
- Table 78: Global Single Use Bioreactor Industry Volume K Units Forecast, by End User 2020 & 2033
- Table 79: Global Single Use Bioreactor Industry Revenue Million Forecast, by Country 2020 & 2033
- Table 80: Global Single Use Bioreactor Industry Volume K Units Forecast, by Country 2020 & 2033
- Table 81: GCC Single Use Bioreactor Industry Revenue (Million) Forecast, by Application 2020 & 2033
- Table 82: GCC Single Use Bioreactor Industry Volume (K Units) Forecast, by Application 2020 & 2033
- Table 83: South Africa Single Use Bioreactor Industry Revenue (Million) Forecast, by Application 2020 & 2033
- Table 84: South Africa Single Use Bioreactor Industry Volume (K Units) Forecast, by Application 2020 & 2033
- Table 85: Rest of Middle East and Africa Single Use Bioreactor Industry Revenue (Million) Forecast, by Application 2020 & 2033
- Table 86: Rest of Middle East and Africa Single Use Bioreactor Industry Volume (K Units) Forecast, by Application 2020 & 2033
- Table 87: Global Single Use Bioreactor Industry Revenue Million Forecast, by Type of Product 2020 & 2033
- Table 88: Global Single Use Bioreactor Industry Volume K Units Forecast, by Type of Product 2020 & 2033
- Table 89: Global Single Use Bioreactor Industry Revenue Million Forecast, by Cell Type 2020 & 2033
- Table 90: Global Single Use Bioreactor Industry Volume K Units Forecast, by Cell Type 2020 & 2033
- Table 91: Global Single Use Bioreactor Industry Revenue Million Forecast, by Molecule Type 2020 & 2033
- Table 92: Global Single Use Bioreactor Industry Volume K Units Forecast, by Molecule Type 2020 & 2033
- Table 93: Global Single Use Bioreactor Industry Revenue Million Forecast, by End User 2020 & 2033
- Table 94: Global Single Use Bioreactor Industry Volume K Units Forecast, by End User 2020 & 2033
- Table 95: Global Single Use Bioreactor Industry Revenue Million Forecast, by Country 2020 & 2033
- Table 96: Global Single Use Bioreactor Industry Volume K Units Forecast, by Country 2020 & 2033
- Table 97: Brazil Single Use Bioreactor Industry Revenue (Million) Forecast, by Application 2020 & 2033
- Table 98: Brazil Single Use Bioreactor Industry Volume (K Units) Forecast, by Application 2020 & 2033
- Table 99: Argentina Single Use Bioreactor Industry Revenue (Million) Forecast, by Application 2020 & 2033
- Table 100: Argentina Single Use Bioreactor Industry Volume (K Units) Forecast, by Application 2020 & 2033
- Table 101: Rest of South America Single Use Bioreactor Industry Revenue (Million) Forecast, by Application 2020 & 2033
- Table 102: Rest of South America Single Use Bioreactor Industry Volume (K Units) Forecast, by Application 2020 & 2033
Frequently Asked Questions
1. What is the projected Compound Annual Growth Rate (CAGR) of the Single Use Bioreactor Industry?
The projected CAGR is approximately 9.70%.
2. Which companies are prominent players in the Single Use Bioreactor Industry?
Key companies in the market include Danaher (Cytiva), Merck KGaA, Distek Inc, Celltainer, Pall Corporation, Eppendorf SE, Sartorius AG, Thermo Fisher Scientific, OmniBRx Biotechnologies, ABEC.
3. What are the main segments of the Single Use Bioreactor Industry?
The market segments include Type of Product, Cell Type, Molecule Type, End User.
4. Can you provide details about the market size?
The market size is estimated to be USD 1.47 Million as of 2022.
5. What are some drivers contributing to market growth?
Rapid Adoption of Single-use Technologies (SUTs) by the Industry; Cost Effectiveness and Lower Downtime; New Product Launches.
6. What are the notable trends driving market growth?
Monoclonal Antibodies Segment is Anticipated to Witness Growth.
7. Are there any restraints impacting market growth?
High Regular Recurring Expenses; Issues with Meeting the Standards of Good Manufacturing Practices.
8. Can you provide examples of recent developments in the market?
In June 2022, mAbxience equipped their cGMP (Current Good Manufacturing Practice) facility in León, Spain with an additional ABEC 4,000L CSR bioreactor, following the successful delivery of the first 4,000L CSR bioreactor in 2021. mAbxience selected ABEC's single-use technology to increase its CDMO (contract development and manufacturing organization) business and capacity.
9. What pricing options are available for accessing the report?
Pricing options include single-user, multi-user, and enterprise licenses priced at USD 4750, USD 5250, and USD 8750 respectively.
10. Is the market size provided in terms of value or volume?
The market size is provided in terms of value, measured in Million and volume, measured in K Units.
11. Are there any specific market keywords associated with the report?
Yes, the market keyword associated with the report is "Single Use Bioreactor Industry," which aids in identifying and referencing the specific market segment covered.
12. How do I determine which pricing option suits my needs best?
The pricing options vary based on user requirements and access needs. Individual users may opt for single-user licenses, while businesses requiring broader access may choose multi-user or enterprise licenses for cost-effective access to the report.
13. Are there any additional resources or data provided in the Single Use Bioreactor Industry report?
While the report offers comprehensive insights, it's advisable to review the specific contents or supplementary materials provided to ascertain if additional resources or data are available.
14. How can I stay updated on further developments or reports in the Single Use Bioreactor Industry?
To stay informed about further developments, trends, and reports in the Single Use Bioreactor Industry, consider subscribing to industry newsletters, following relevant companies and organizations, or regularly checking reputable industry news sources and publications.
Methodology
Step 1 - Identification of Relevant Samples Size from Population Database


Step 2 - Approaches for Defining Global Market Size (Value, Volume* & Price*)

Note*: In applicable scenarios
Step 3 - Data Sources
Primary Research
- Web Analytics
- Survey Reports
- Research Institute
- Latest Research Reports
- Opinion Leaders
Secondary Research
- Annual Reports
- White Paper
- Latest Press Release
- Industry Association
- Paid Database
- Investor Presentations

Step 4 - Data Triangulation
Involves using different sources of information in order to increase the validity of a study
These sources are likely to be stakeholders in a program - participants, other researchers, program staff, other community members, and so on.
Then we put all data in single framework & apply various statistical tools to find out the dynamic on the market.
During the analysis stage, feedback from the stakeholder groups would be compared to determine areas of agreement as well as areas of divergence