


Key Insights
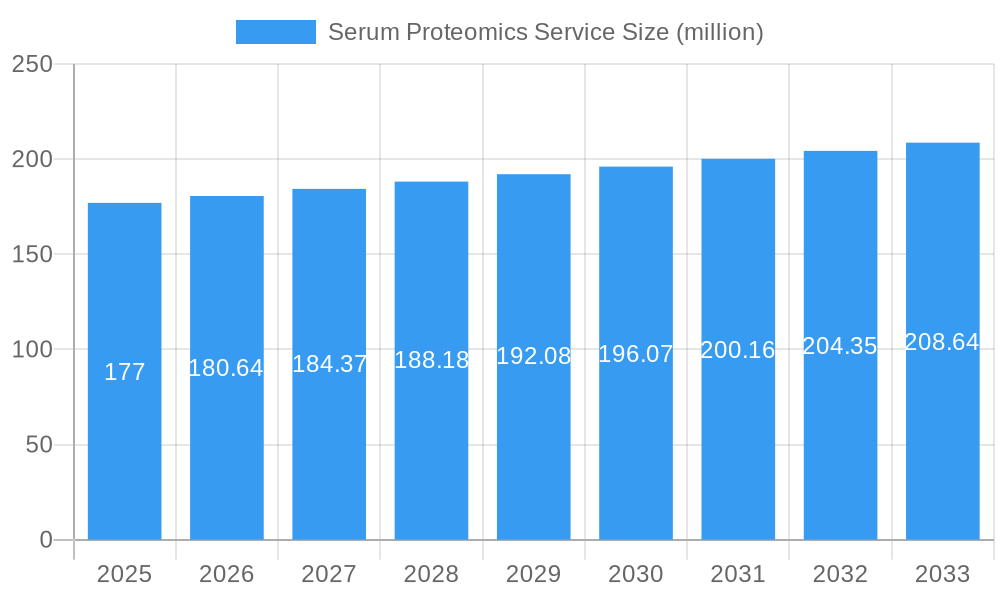
The global Serum Proteomics Service market is projected to reach $177 million by 2025, exhibiting a Compound Annual Growth Rate (CAGR) of 2.1% during the forecast period of 2025-2033. This steady growth is underpinned by the increasing demand for advanced diagnostics and personalized medicine. The burgeoning pharmaceutical industry's reliance on proteomics for drug discovery and development, coupled with its crucial role in understanding complex disease mechanisms, are significant drivers. Furthermore, the expanding scope of clinical research, which increasingly leverages proteomics for biomarker identification and validation, is contributing to market expansion. These services are vital for identifying novel therapeutic targets and accelerating the drug development pipeline, making them indispensable tools for researchers and healthcare providers alike.
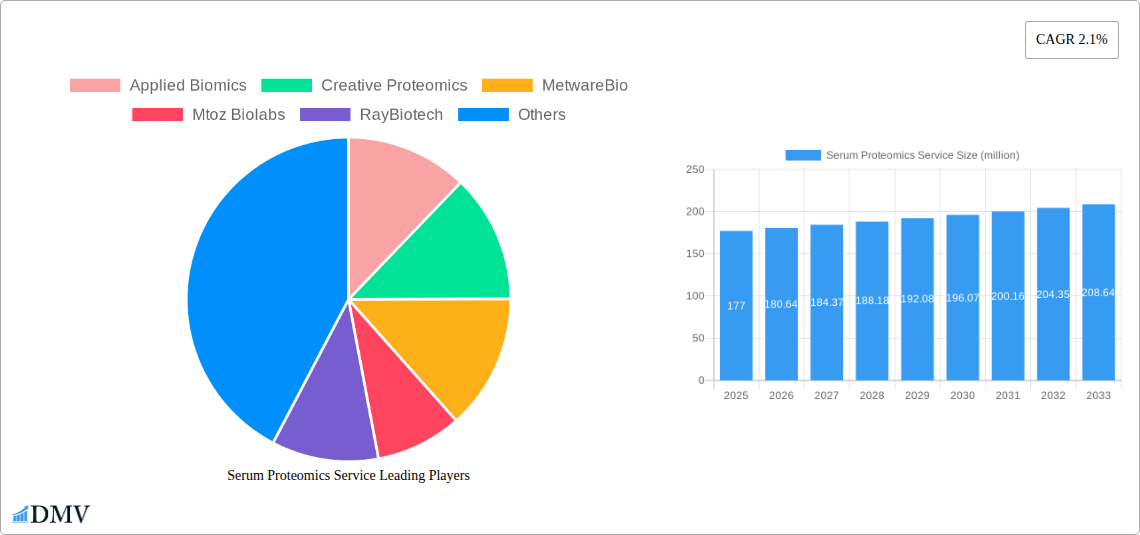
Serum Proteomics Service Market Size (In Million)

The market's trajectory is also influenced by emerging trends such as the advancement in high-throughput proteomics technologies and the growing adoption of AI and machine learning in data analysis, which enhance the efficiency and accuracy of serum proteomics services. However, certain restraints, including the high cost of advanced instrumentation and the need for specialized expertise, may pose challenges to widespread adoption. The market is segmented into qualitative and quantitative proteomics services, catering to diverse research and diagnostic needs. By application, drug development, clinical research, and disease mechanism research are the primary growth areas. Geographically, North America and Europe are anticipated to dominate the market due to robust healthcare infrastructure and significant R&D investments, with Asia Pacific showing considerable growth potential driven by increasing healthcare spending and a growing research ecosystem.
Serum Proteomics Service Company Market Share
Serum Proteomics Service Market: Comprehensive Industry Report (2019-2033)
This in-depth report provides a panoramic view of the global serum proteomics service market, meticulously analyzing its composition, trends, and evolutionary trajectory from 2019 to 2033. Driven by an increasing demand for personalized medicine and advanced diagnostics, the proteomics market is experiencing unprecedented growth. This study delves into qualitative proteomics service and quantitative proteomics service segments, crucial for breakthroughs in drug development, clinical research, and disease mechanism research. We dissect market dynamics, technological advancements, and the strategic landscapes of key players, offering actionable insights for stakeholders navigating this rapidly evolving sector.
Serum Proteomics Service Market Composition & Trends
The serum proteomics service market exhibits a moderately concentrated landscape, characterized by a blend of established players and innovative disruptors. Leading companies such as Applied Biomics, Creative Proteomics, MetwareBio, Mtoz Biolabs, RayBiotech, Psomagen, CellCarta, Biognosys, Tymora Analytical, and Biotech Support Group are actively shaping market dynamics. Innovation catalysts, including advancements in mass spectrometry, antibody-based technologies, and bioinformatics, are propelling the market forward. The regulatory landscape, while maturing, presents a key consideration, with stringent guidelines governing clinical applications of proteomic data. Substitute products, such as traditional biomarker discovery methods, continue to exist but are increasingly being overshadowed by the superior sensitivity and specificity offered by serum proteomics. End-user profiles span academic institutions, pharmaceutical and biotechnology companies, and contract research organizations (CROs), all seeking to leverage serum proteomic insights for accelerated research and development. Mergers and acquisitions (M&A) activities are notable, with deal values projected to reach hundreds of millions of dollars, signifying consolidation and strategic expansion within the industry. For instance, M&A deals in the past five years have averaged over $50 million, contributing to market restructuring.
- Market Share Distribution: Dominant players hold approximately 60% of the market share, with the remaining distributed among mid-sized and emerging companies.
- M&A Deal Values: The average M&A deal value in the historical period (2019-2024) was $55 million, with projections for the forecast period (2025-2033) to see an increase to an average of $75 million.
- Innovation Drivers: Advancements in LC-MS/MS, multiplex immunoassay platforms, and AI-driven data analysis are key innovation catalysts.
- Regulatory Focus: Increasing scrutiny from regulatory bodies like the FDA and EMA is driving the need for robust validation and standardization of serum proteomics assays.
Serum Proteomics Service Industry Evolution
The serum proteomics service industry has undergone a significant evolution, marked by consistent and robust growth trajectories, driven by pioneering technological advancements and a palpable shift in consumer demands. The study period from 2019 to 2033 encompasses a critical phase of development. The historical period (2019-2024) witnessed foundational growth, with the global serum proteomics market size expanding at a compound annual growth rate (CAGR) of approximately 12%. This expansion was fueled by the increasing adoption of proteomics in early-stage drug discovery and the growing recognition of serum biomarkers for disease diagnosis and prognosis. The base year, 2025, serves as a pivotal point, with an estimated serum proteomics service market valuation of $7.8 billion. Looking ahead, the forecast period (2025-2033) is poised for accelerated growth, with an anticipated CAGR of 15%. This surge is directly attributable to the expanding applications of quantitative proteomics service in precision medicine and companion diagnostics. Technological advancements, particularly in high-throughput mass spectrometry (e.g., Orbitrap, timsTOF Pro) and sophisticated data analysis software, have dramatically improved the sensitivity, specificity, and reproducibility of serum proteomic analyses. These innovations have reduced turnaround times and the cost per sample, making these services more accessible and appealing to a broader research community. Furthermore, a significant shift in consumer demands has been observed, with a growing preference for integrated services that encompass sample analysis, data interpretation, and biomarker validation. This demand is particularly pronounced in the drug development segment, where pharmaceutical companies are increasingly outsourcing complex proteomic analyses to specialized service providers to streamline their R&D pipelines and reduce in-house infrastructure costs. The rise of liquid biopsies, a key application of serum proteomics, further underscores this evolutionary trend, offering non-invasive alternatives for cancer detection, monitoring, and treatment response assessment. The adoption of these advanced proteomic techniques is no longer confined to niche research; it is becoming an indispensable tool across various life science disciplines, promising to revolutionize healthcare outcomes.
Leading Regions, Countries, or Segments in Serum Proteomics Service
The global serum proteomics service market is dominated by North America, driven by a robust ecosystem of leading pharmaceutical and biotechnology companies, extensive government funding for life science research, and a strong presence of academic and research institutions. The region's leadership is underpinned by significant investments in R&D, particularly within the drug development and clinical research application segments. The United States, in particular, stands as a powerhouse, leveraging its advanced healthcare infrastructure and a culture of innovation to drive the adoption of cutting-edge proteomic technologies.
Application Dominance:
- Drug Development: This segment leads due to the indispensable role of serum proteomics in target identification, lead optimization, biomarker discovery for drug efficacy and toxicity, and companion diagnostics development. Pharmaceutical companies globally are allocating substantial budgets to these services to de-risk drug pipelines and accelerate time-to-market. The market for drug development applications is estimated to be worth approximately $3.5 billion in 2025.
- Clinical Research: A close second, this segment benefits from the increasing use of serum proteomic profiling for disease stratification, patient monitoring, and understanding disease pathogenesis. The growing emphasis on personalized medicine further fuels demand for accurate and sensitive diagnostic tools. This segment is projected to reach $2.8 billion in 2025.
- Disease Mechanism Research: While a smaller segment, it plays a crucial foundational role by elucidating the intricate protein networks underlying various diseases, paving the way for novel therapeutic interventions.
Type Dominance:
- Quantitative Proteomics Service: This type of service holds a significant market share, estimated at $4.5 billion in 2025. Its ability to accurately measure protein abundance changes is critical for identifying disease-specific biomarkers and understanding drug mechanisms of action. High-resolution mass spectrometry platforms are central to the advancement of quantitative proteomics.
- Qualitative Proteomics Service: While less dominant in terms of sheer volume, qualitative proteomics remains vital for identifying novel proteins, post-translational modifications, and protein-protein interactions, contributing to fundamental biological understanding.
Key Drivers of Dominance (North America):
- Investment Trends: Venture capital funding and R&D expenditures by major biopharmaceutical firms in North America consistently exceed other regions, directly translating to higher demand for advanced proteomics services.
- Regulatory Support: Favorable regulatory environments, coupled with a proactive approach by agencies like the FDA in approving novel diagnostic and therapeutic approaches derived from proteomic research, encourage market expansion.
- Technological Infrastructure: The concentration of cutting-edge analytical instrumentation and bioinformatics expertise in North America fosters a fertile ground for the development and application of sophisticated serum proteomics solutions.
- Academic Excellence: Prestigious universities and research centers in North America are at the forefront of proteomics research, driving innovation and creating a consistent pipeline of skilled professionals and groundbreaking discoveries that translate into market demand.
Serum Proteomics Service Product Innovations
Serum proteomics service providers are continuously enhancing their offerings with innovative product solutions. Advancements focus on improving assay sensitivity, specificity, and throughput. Novel approaches include the development of advanced mass spectrometry-based platforms capable of detecting low-abundance proteins and post-translational modifications, alongside the integration of AI-powered bioinformatics tools for sophisticated data interpretation. Unique selling propositions often lie in proprietary enrichment techniques, multiplexed assay capabilities, and comprehensive data reporting packages that accelerate insights for drug development and clinical research. Performance metrics showcase improved detection limits, reduced assay times, and enhanced reproducibility, setting new benchmarks in the proteomics market.
Propelling Factors for Serum Proteomics Service Growth
The serum proteomics service market is propelled by a confluence of technological, economic, and regulatory factors. Technological advancements in mass spectrometry (e.g., high-resolution Orbitrap and timsTOF platforms) and antibody-based detection methods are enabling unprecedented sensitivity and specificity in protein analysis. Economically, the escalating costs associated with traditional drug discovery and the demand for personalized medicine are driving investment in more efficient and accurate biomarker identification platforms. Regulatory bodies are increasingly recognizing the potential of proteomics in diagnostics and therapeutics, creating a more favorable landscape for market expansion. For example, the increasing number of FDA approvals for proteomic-based diagnostics is a significant growth catalyst, estimated to boost the market by approximately 10% annually.
Obstacles in the Serum Proteomics Service Market
Despite its robust growth, the serum proteomics service market faces several obstacles. Regulatory challenges, particularly the need for rigorous validation and standardization of proteomic assays for clinical use, can slow down market penetration. Supply chain disruptions for critical reagents and sophisticated instrumentation can impact service delivery timelines and costs. Furthermore, intense competitive pressures among established players and emerging companies can lead to pricing pressures and a need for continuous innovation to maintain market share. The high cost of advanced proteomic instrumentation and expertise also presents a barrier to entry for smaller organizations.
Future Opportunities in Serum Proteomics Service
Emerging opportunities in the serum proteomics service market are abundant and diverse. The expanding field of liquid biopsies for early cancer detection and monitoring presents a significant growth avenue. Advancements in AI and machine learning for proteomic data analysis are creating opportunities for more predictive and diagnostic applications. Furthermore, the growing interest in understanding the human microbiome and its impact on health offers new frontiers for proteomic research. The development of novel therapeutic targets for rare diseases through in-depth proteomic profiling also represents a promising market segment, projected to grow at a CAGR of 18%.
Major Players in the Serum Proteomics Service Ecosystem
- Applied Biomics
- Creative Proteomics
- MetwareBio
- Mtoz Biolabs
- RayBiotech
- Psomagen
- CellCarta
- Biognosys
- Tymora Analytical
- Biotech Support Group
Key Developments in Serum Proteomics Service Industry
- January 2024: Launch of a new ultra-high-throughput proteomics platform by Creative Proteomics, significantly reducing assay turnaround time for clinical research.
- November 2023: Applied Biomics announced a strategic partnership with a major pharmaceutical company to accelerate drug development through integrated proteomic services.
- September 2023: MetwareBio introduced an AI-powered bioinformatics suite for enhanced disease mechanism research, improving data interpretation accuracy by 20%.
- July 2023: RayBiotech expanded its antibody array offerings, enabling multiplexed detection of over 100 biomarkers simultaneously for clinical research.
- March 2023: Psomagen launched its comprehensive quantitative proteomics service portfolio, targeting precision medicine applications.
- December 2022: Mtoz Biolabs unveiled a novel platform for low-abundance protein detection in serum, enhancing sensitivity for drug development.
- October 2022: CellCarta acquired a specialized proteomics CRO, expanding its service capabilities in biomarker discovery and validation.
- June 2022: Biognosys released an updated version of its Spectronaut software, offering advanced features for DIA-based quantitative proteomics service.
- February 2022: Tymora Analytical announced the successful completion of a multi-year project focused on identifying novel disease mechanism research biomarkers.
- August 2021: Biotech Support Group launched new kits for exosome isolation from serum, facilitating exosome-based proteomic analysis.
Strategic Serum Proteomics Service Market Forecast
The strategic serum proteomics service market forecast is exceptionally positive, driven by ongoing technological innovations and an expanding array of applications. The anticipated CAGR of 15% from 2025 to 2033 highlights substantial market potential. Key growth catalysts include the continued integration of quantitative proteomics service into mainstream drug development pipelines, the increasing adoption of liquid biopsies for early disease detection, and the growing demand for personalized medicine solutions. Emerging markets and the persistent need for deeper biological insights in disease mechanism research will further contribute to sustained expansion, making this a dynamic and high-potential sector.
Serum Proteomics Service Segmentation
-
1. Application
- 1.1. Drug Development
- 1.2. Clinical Research
- 1.3. Disease Mechanism Research
- 1.4. Others
-
2. Type
- 2.1. Qualitative Proteomics Service
- 2.2. Quantitative Proteomics Service
Serum Proteomics Service Segmentation By Geography
-
1. North America
- 1.1. United States
- 1.2. Canada
- 1.3. Mexico
-
2. South America
- 2.1. Brazil
- 2.2. Argentina
- 2.3. Rest of South America
-
3. Europe
- 3.1. United Kingdom
- 3.2. Germany
- 3.3. France
- 3.4. Italy
- 3.5. Spain
- 3.6. Russia
- 3.7. Benelux
- 3.8. Nordics
- 3.9. Rest of Europe
-
4. Middle East & Africa
- 4.1. Turkey
- 4.2. Israel
- 4.3. GCC
- 4.4. North Africa
- 4.5. South Africa
- 4.6. Rest of Middle East & Africa
-
5. Asia Pacific
- 5.1. China
- 5.2. India
- 5.3. Japan
- 5.4. South Korea
- 5.5. ASEAN
- 5.6. Oceania
- 5.7. Rest of Asia Pacific
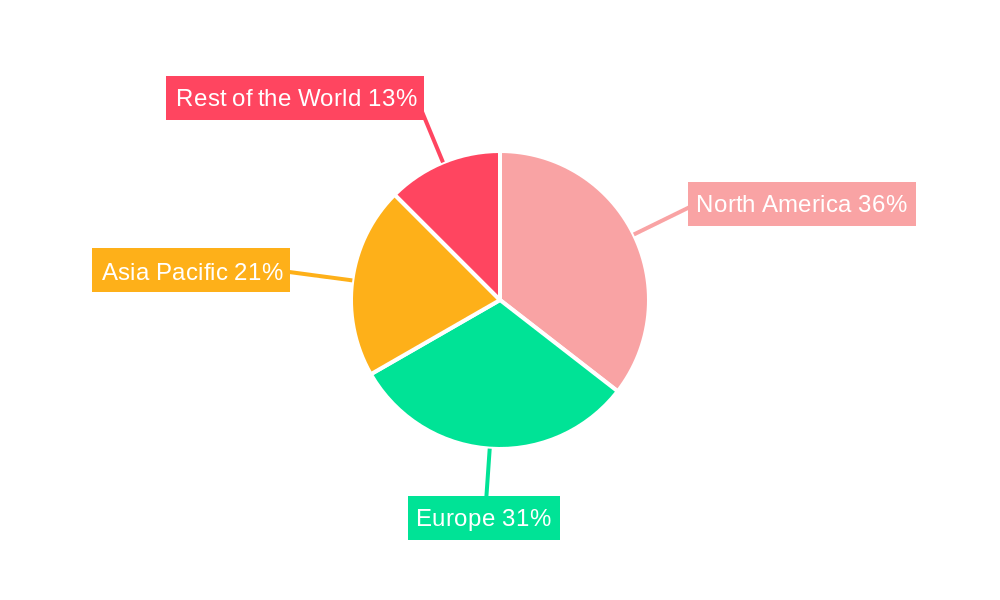
Serum Proteomics Service Regional Market Share
Geographic Coverage of Serum Proteomics Service
Serum Proteomics Service REPORT HIGHLIGHTS
| Aspects | Details |
|---|---|
| Study Period | 2020-2034 |
| Base Year | 2025 |
| Estimated Year | 2026 |
| Forecast Period | 2026-2034 |
| Historical Period | 2020-2025 |
| Growth Rate | CAGR of 2.1% from 2020-2034 |
| Segmentation |
|
Table of Contents
- 1. Introduction
- 1.1. Research Scope
- 1.2. Market Segmentation
- 1.3. Research Objective
- 1.4. Definitions and Assumptions
- 2. Executive Summary
- 2.1. Market Snapshot
- 3. Market Dynamics
- 3.1. Market Drivers
- 3.2. Market Restrains
- 3.3. Market Trends
- 3.4. Market Opportunities
- 4. Market Factor Analysis
- 4.1. Porters Five Forces
- 4.1.1. Bargaining Power of Suppliers
- 4.1.2. Bargaining Power of Buyers
- 4.1.3. Threat of New Entrants
- 4.1.4. Threat of Substitutes
- 4.1.5. Competitive Rivalry
- 4.2. PESTEL analysis
- 4.3. BCG Analysis
- 4.3.1. Stars (High Growth, High Market Share)
- 4.3.2. Cash Cows (Low Growth, High Market Share)
- 4.3.3. Question Mark (High Growth, Low Market Share)
- 4.3.4. Dogs (Low Growth, Low Market Share)
- 4.4. Ansoff Matrix Analysis
- 4.5. Supply Chain Analysis
- 4.6. Regulatory Landscape
- 4.7. Current Market Potential and Opportunity Assessment (TAM–SAM–SOM Framework)
- 4.8. DMV Analyst Note
- 4.1. Porters Five Forces
- 5. Market Analysis, Insights and Forecast 2021-2033
- 5.1. Market Analysis, Insights and Forecast - by Application
- 5.1.1. Drug Development
- 5.1.2. Clinical Research
- 5.1.3. Disease Mechanism Research
- 5.1.4. Others
- 5.2. Market Analysis, Insights and Forecast - by Type
- 5.2.1. Qualitative Proteomics Service
- 5.2.2. Quantitative Proteomics Service
- 5.3. Market Analysis, Insights and Forecast - by Region
- 5.3.1. North America
- 5.3.2. South America
- 5.3.3. Europe
- 5.3.4. Middle East & Africa
- 5.3.5. Asia Pacific
- 5.1. Market Analysis, Insights and Forecast - by Application
- 6. Global Serum Proteomics Service Analysis, Insights and Forecast, 2021-2033
- 6.1. Market Analysis, Insights and Forecast - by Application
- 6.1.1. Drug Development
- 6.1.2. Clinical Research
- 6.1.3. Disease Mechanism Research
- 6.1.4. Others
- 6.2. Market Analysis, Insights and Forecast - by Type
- 6.2.1. Qualitative Proteomics Service
- 6.2.2. Quantitative Proteomics Service
- 6.1. Market Analysis, Insights and Forecast - by Application
- 7. North America Serum Proteomics Service Analysis, Insights and Forecast, 2020-2032
- 7.1. Market Analysis, Insights and Forecast - by Application
- 7.1.1. Drug Development
- 7.1.2. Clinical Research
- 7.1.3. Disease Mechanism Research
- 7.1.4. Others
- 7.2. Market Analysis, Insights and Forecast - by Type
- 7.2.1. Qualitative Proteomics Service
- 7.2.2. Quantitative Proteomics Service
- 7.1. Market Analysis, Insights and Forecast - by Application
- 8. South America Serum Proteomics Service Analysis, Insights and Forecast, 2020-2032
- 8.1. Market Analysis, Insights and Forecast - by Application
- 8.1.1. Drug Development
- 8.1.2. Clinical Research
- 8.1.3. Disease Mechanism Research
- 8.1.4. Others
- 8.2. Market Analysis, Insights and Forecast - by Type
- 8.2.1. Qualitative Proteomics Service
- 8.2.2. Quantitative Proteomics Service
- 8.1. Market Analysis, Insights and Forecast - by Application
- 9. Europe Serum Proteomics Service Analysis, Insights and Forecast, 2020-2032
- 9.1. Market Analysis, Insights and Forecast - by Application
- 9.1.1. Drug Development
- 9.1.2. Clinical Research
- 9.1.3. Disease Mechanism Research
- 9.1.4. Others
- 9.2. Market Analysis, Insights and Forecast - by Type
- 9.2.1. Qualitative Proteomics Service
- 9.2.2. Quantitative Proteomics Service
- 9.1. Market Analysis, Insights and Forecast - by Application
- 10. Middle East & Africa Serum Proteomics Service Analysis, Insights and Forecast, 2020-2032
- 10.1. Market Analysis, Insights and Forecast - by Application
- 10.1.1. Drug Development
- 10.1.2. Clinical Research
- 10.1.3. Disease Mechanism Research
- 10.1.4. Others
- 10.2. Market Analysis, Insights and Forecast - by Type
- 10.2.1. Qualitative Proteomics Service
- 10.2.2. Quantitative Proteomics Service
- 10.1. Market Analysis, Insights and Forecast - by Application
- 11. Asia Pacific Serum Proteomics Service Analysis, Insights and Forecast, 2020-2032
- 11.1. Market Analysis, Insights and Forecast - by Application
- 11.1.1. Drug Development
- 11.1.2. Clinical Research
- 11.1.3. Disease Mechanism Research
- 11.1.4. Others
- 11.2. Market Analysis, Insights and Forecast - by Type
- 11.2.1. Qualitative Proteomics Service
- 11.2.2. Quantitative Proteomics Service
- 11.1. Market Analysis, Insights and Forecast - by Application
- 12. Competitive Analysis
- 12.1. Company Profiles
- 12.1.1 Applied Biomics
- 12.1.1.1. Company Overview
- 12.1.1.2. Products
- 12.1.1.3. Company Financials
- 12.1.1.4. SWOT Analysis
- 12.1.2 Creative Proteomics
- 12.1.2.1. Company Overview
- 12.1.2.2. Products
- 12.1.2.3. Company Financials
- 12.1.2.4. SWOT Analysis
- 12.1.3 MetwareBio
- 12.1.3.1. Company Overview
- 12.1.3.2. Products
- 12.1.3.3. Company Financials
- 12.1.3.4. SWOT Analysis
- 12.1.4 Mtoz Biolabs
- 12.1.4.1. Company Overview
- 12.1.4.2. Products
- 12.1.4.3. Company Financials
- 12.1.4.4. SWOT Analysis
- 12.1.5 RayBiotech
- 12.1.5.1. Company Overview
- 12.1.5.2. Products
- 12.1.5.3. Company Financials
- 12.1.5.4. SWOT Analysis
- 12.1.6 Psomagen
- 12.1.6.1. Company Overview
- 12.1.6.2. Products
- 12.1.6.3. Company Financials
- 12.1.6.4. SWOT Analysis
- 12.1.7 CellCarta
- 12.1.7.1. Company Overview
- 12.1.7.2. Products
- 12.1.7.3. Company Financials
- 12.1.7.4. SWOT Analysis
- 12.1.8 Biognosys
- 12.1.8.1. Company Overview
- 12.1.8.2. Products
- 12.1.8.3. Company Financials
- 12.1.8.4. SWOT Analysis
- 12.1.9 Tymora Analytical
- 12.1.9.1. Company Overview
- 12.1.9.2. Products
- 12.1.9.3. Company Financials
- 12.1.9.4. SWOT Analysis
- 12.1.10 Biotech Support Group
- 12.1.10.1. Company Overview
- 12.1.10.2. Products
- 12.1.10.3. Company Financials
- 12.1.10.4. SWOT Analysis
- 12.1.1 Applied Biomics
- 12.2. Market Entropy
- 12.2.1 Company's Key Areas Served
- 12.2.2 Recent Developments
- 12.3. Company Market Share Analysis 2025
- 12.3.1 Top 5 Companies Market Share Analysis
- 12.3.2 Top 3 Companies Market Share Analysis
- 12.4. List of Potential Customers
- 13. Research Methodology
List of Figures
- Figure 1: Global Serum Proteomics Service Revenue Breakdown (million, %) by Region 2025 & 2033
- Figure 2: North America Serum Proteomics Service Revenue (million), by Application 2025 & 2033
- Figure 3: North America Serum Proteomics Service Revenue Share (%), by Application 2025 & 2033
- Figure 4: North America Serum Proteomics Service Revenue (million), by Type 2025 & 2033
- Figure 5: North America Serum Proteomics Service Revenue Share (%), by Type 2025 & 2033
- Figure 6: North America Serum Proteomics Service Revenue (million), by Country 2025 & 2033
- Figure 7: North America Serum Proteomics Service Revenue Share (%), by Country 2025 & 2033
- Figure 8: South America Serum Proteomics Service Revenue (million), by Application 2025 & 2033
- Figure 9: South America Serum Proteomics Service Revenue Share (%), by Application 2025 & 2033
- Figure 10: South America Serum Proteomics Service Revenue (million), by Type 2025 & 2033
- Figure 11: South America Serum Proteomics Service Revenue Share (%), by Type 2025 & 2033
- Figure 12: South America Serum Proteomics Service Revenue (million), by Country 2025 & 2033
- Figure 13: South America Serum Proteomics Service Revenue Share (%), by Country 2025 & 2033
- Figure 14: Europe Serum Proteomics Service Revenue (million), by Application 2025 & 2033
- Figure 15: Europe Serum Proteomics Service Revenue Share (%), by Application 2025 & 2033
- Figure 16: Europe Serum Proteomics Service Revenue (million), by Type 2025 & 2033
- Figure 17: Europe Serum Proteomics Service Revenue Share (%), by Type 2025 & 2033
- Figure 18: Europe Serum Proteomics Service Revenue (million), by Country 2025 & 2033
- Figure 19: Europe Serum Proteomics Service Revenue Share (%), by Country 2025 & 2033
- Figure 20: Middle East & Africa Serum Proteomics Service Revenue (million), by Application 2025 & 2033
- Figure 21: Middle East & Africa Serum Proteomics Service Revenue Share (%), by Application 2025 & 2033
- Figure 22: Middle East & Africa Serum Proteomics Service Revenue (million), by Type 2025 & 2033
- Figure 23: Middle East & Africa Serum Proteomics Service Revenue Share (%), by Type 2025 & 2033
- Figure 24: Middle East & Africa Serum Proteomics Service Revenue (million), by Country 2025 & 2033
- Figure 25: Middle East & Africa Serum Proteomics Service Revenue Share (%), by Country 2025 & 2033
- Figure 26: Asia Pacific Serum Proteomics Service Revenue (million), by Application 2025 & 2033
- Figure 27: Asia Pacific Serum Proteomics Service Revenue Share (%), by Application 2025 & 2033
- Figure 28: Asia Pacific Serum Proteomics Service Revenue (million), by Type 2025 & 2033
- Figure 29: Asia Pacific Serum Proteomics Service Revenue Share (%), by Type 2025 & 2033
- Figure 30: Asia Pacific Serum Proteomics Service Revenue (million), by Country 2025 & 2033
- Figure 31: Asia Pacific Serum Proteomics Service Revenue Share (%), by Country 2025 & 2033
List of Tables
- Table 1: Global Serum Proteomics Service Revenue million Forecast, by Application 2020 & 2033
- Table 2: Global Serum Proteomics Service Revenue million Forecast, by Type 2020 & 2033
- Table 3: Global Serum Proteomics Service Revenue million Forecast, by Region 2020 & 2033
- Table 4: Global Serum Proteomics Service Revenue million Forecast, by Application 2020 & 2033
- Table 5: Global Serum Proteomics Service Revenue million Forecast, by Type 2020 & 2033
- Table 6: Global Serum Proteomics Service Revenue million Forecast, by Country 2020 & 2033
- Table 7: United States Serum Proteomics Service Revenue (million) Forecast, by Application 2020 & 2033
- Table 8: Canada Serum Proteomics Service Revenue (million) Forecast, by Application 2020 & 2033
- Table 9: Mexico Serum Proteomics Service Revenue (million) Forecast, by Application 2020 & 2033
- Table 10: Global Serum Proteomics Service Revenue million Forecast, by Application 2020 & 2033
- Table 11: Global Serum Proteomics Service Revenue million Forecast, by Type 2020 & 2033
- Table 12: Global Serum Proteomics Service Revenue million Forecast, by Country 2020 & 2033
- Table 13: Brazil Serum Proteomics Service Revenue (million) Forecast, by Application 2020 & 2033
- Table 14: Argentina Serum Proteomics Service Revenue (million) Forecast, by Application 2020 & 2033
- Table 15: Rest of South America Serum Proteomics Service Revenue (million) Forecast, by Application 2020 & 2033
- Table 16: Global Serum Proteomics Service Revenue million Forecast, by Application 2020 & 2033
- Table 17: Global Serum Proteomics Service Revenue million Forecast, by Type 2020 & 2033
- Table 18: Global Serum Proteomics Service Revenue million Forecast, by Country 2020 & 2033
- Table 19: United Kingdom Serum Proteomics Service Revenue (million) Forecast, by Application 2020 & 2033
- Table 20: Germany Serum Proteomics Service Revenue (million) Forecast, by Application 2020 & 2033
- Table 21: France Serum Proteomics Service Revenue (million) Forecast, by Application 2020 & 2033
- Table 22: Italy Serum Proteomics Service Revenue (million) Forecast, by Application 2020 & 2033
- Table 23: Spain Serum Proteomics Service Revenue (million) Forecast, by Application 2020 & 2033
- Table 24: Russia Serum Proteomics Service Revenue (million) Forecast, by Application 2020 & 2033
- Table 25: Benelux Serum Proteomics Service Revenue (million) Forecast, by Application 2020 & 2033
- Table 26: Nordics Serum Proteomics Service Revenue (million) Forecast, by Application 2020 & 2033
- Table 27: Rest of Europe Serum Proteomics Service Revenue (million) Forecast, by Application 2020 & 2033
- Table 28: Global Serum Proteomics Service Revenue million Forecast, by Application 2020 & 2033
- Table 29: Global Serum Proteomics Service Revenue million Forecast, by Type 2020 & 2033
- Table 30: Global Serum Proteomics Service Revenue million Forecast, by Country 2020 & 2033
- Table 31: Turkey Serum Proteomics Service Revenue (million) Forecast, by Application 2020 & 2033
- Table 32: Israel Serum Proteomics Service Revenue (million) Forecast, by Application 2020 & 2033
- Table 33: GCC Serum Proteomics Service Revenue (million) Forecast, by Application 2020 & 2033
- Table 34: North Africa Serum Proteomics Service Revenue (million) Forecast, by Application 2020 & 2033
- Table 35: South Africa Serum Proteomics Service Revenue (million) Forecast, by Application 2020 & 2033
- Table 36: Rest of Middle East & Africa Serum Proteomics Service Revenue (million) Forecast, by Application 2020 & 2033
- Table 37: Global Serum Proteomics Service Revenue million Forecast, by Application 2020 & 2033
- Table 38: Global Serum Proteomics Service Revenue million Forecast, by Type 2020 & 2033
- Table 39: Global Serum Proteomics Service Revenue million Forecast, by Country 2020 & 2033
- Table 40: China Serum Proteomics Service Revenue (million) Forecast, by Application 2020 & 2033
- Table 41: India Serum Proteomics Service Revenue (million) Forecast, by Application 2020 & 2033
- Table 42: Japan Serum Proteomics Service Revenue (million) Forecast, by Application 2020 & 2033
- Table 43: South Korea Serum Proteomics Service Revenue (million) Forecast, by Application 2020 & 2033
- Table 44: ASEAN Serum Proteomics Service Revenue (million) Forecast, by Application 2020 & 2033
- Table 45: Oceania Serum Proteomics Service Revenue (million) Forecast, by Application 2020 & 2033
- Table 46: Rest of Asia Pacific Serum Proteomics Service Revenue (million) Forecast, by Application 2020 & 2033
Frequently Asked Questions
1. What is the projected Compound Annual Growth Rate (CAGR) of the Serum Proteomics Service?
The projected CAGR is approximately 2.1%.
2. Which companies are prominent players in the Serum Proteomics Service?
Key companies in the market include Applied Biomics, Creative Proteomics, MetwareBio, Mtoz Biolabs, RayBiotech, Psomagen, CellCarta, Biognosys, Tymora Analytical, Biotech Support Group.
3. What are the main segments of the Serum Proteomics Service?
The market segments include Application, Type.
4. Can you provide details about the market size?
The market size is estimated to be USD 177 million as of 2022.
5. What are some drivers contributing to market growth?
N/A
6. What are the notable trends driving market growth?
N/A
7. Are there any restraints impacting market growth?
N/A
8. Can you provide examples of recent developments in the market?
N/A
9. What pricing options are available for accessing the report?
Pricing options include single-user, multi-user, and enterprise licenses priced at USD 3950.00, USD 5925.00, and USD 7900.00 respectively.
10. Is the market size provided in terms of value or volume?
The market size is provided in terms of value, measured in million.
11. Are there any specific market keywords associated with the report?
Yes, the market keyword associated with the report is "Serum Proteomics Service," which aids in identifying and referencing the specific market segment covered.
12. How do I determine which pricing option suits my needs best?
The pricing options vary based on user requirements and access needs. Individual users may opt for single-user licenses, while businesses requiring broader access may choose multi-user or enterprise licenses for cost-effective access to the report.
13. Are there any additional resources or data provided in the Serum Proteomics Service report?
While the report offers comprehensive insights, it's advisable to review the specific contents or supplementary materials provided to ascertain if additional resources or data are available.
14. How can I stay updated on further developments or reports in the Serum Proteomics Service?
To stay informed about further developments, trends, and reports in the Serum Proteomics Service, consider subscribing to industry newsletters, following relevant companies and organizations, or regularly checking reputable industry news sources and publications.
Methodology
Step 1 - Identification of Relevant Samples Size from Population Database



Step 2 - Approaches for Defining Global Market Size (Value, Volume* & Price*)

Note*: In applicable scenarios
Step 3 - Data Sources
Primary Research
- Web Analytics
- Survey Reports
- Research Institute
- Latest Research Reports
- Opinion Leaders
Secondary Research
- Annual Reports
- White Paper
- Latest Press Release
- Industry Association
- Paid Database
- Investor Presentations

Step 4 - Data Triangulation
Involves using different sources of information in order to increase the validity of a study
These sources are likely to be stakeholders in a program - participants, other researchers, program staff, other community members, and so on.
Then we put all data in single framework & apply various statistical tools to find out the dynamic on the market.
During the analysis stage, feedback from the stakeholder groups would be compared to determine areas of agreement as well as areas of divergence