

Key Insights
The self-healing materials market is projected for substantial expansion, anticipating a Compound Annual Growth Rate (CAGR) of 31.5% from a market size of 109.3 billion in the base year 2025, extending through 2033. This growth is fueled by increasing adoption across key sectors including healthcare, automotive, and construction. Innovations in polymer and composite technologies are pivotal, enabling the development of materials offering superior durability and longevity. The automotive sector's drive for enhanced vehicle safety and reduced maintenance costs significantly propels demand. In healthcare, self-healing materials are crucial for advanced wound dressings and implantable devices, benefiting from their biocompatibility and accelerated healing properties. The construction industry sees advantages in improved structural integrity and minimized repair requirements. Despite initial cost challenges, ongoing technological advancements are progressively lowering production expenses, enhancing market accessibility. The Asia-Pacific region, particularly China and India, is expected to lead growth due to rapid infrastructure development and industrialization. North America and Europe also contribute significantly, driven by innovation and a focus on sustainable material solutions. Key industry leaders such as BASF SE, Covestro AG, and Michelin are instrumental in driving innovation and market penetration.
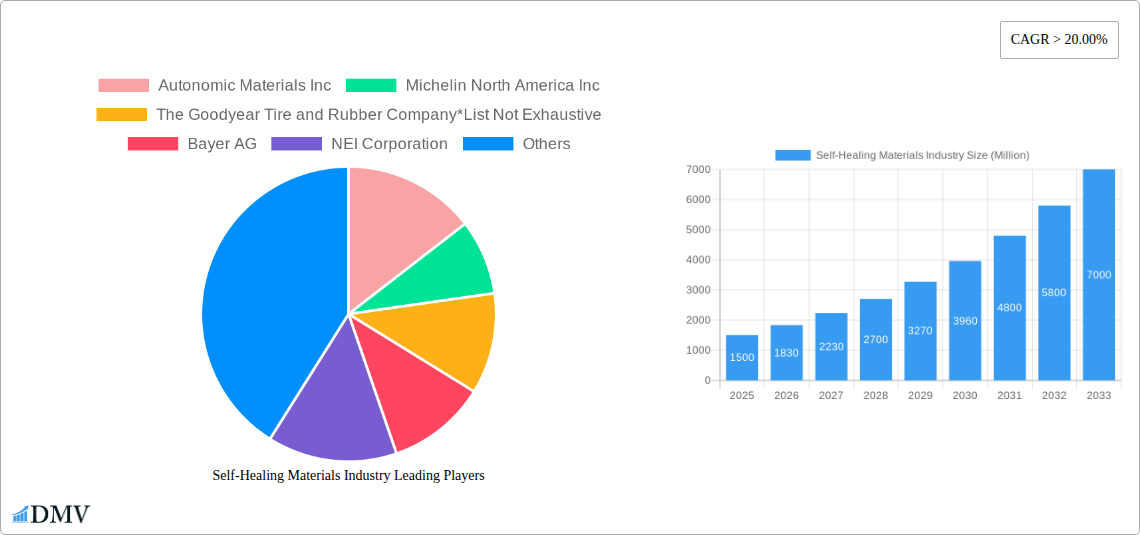
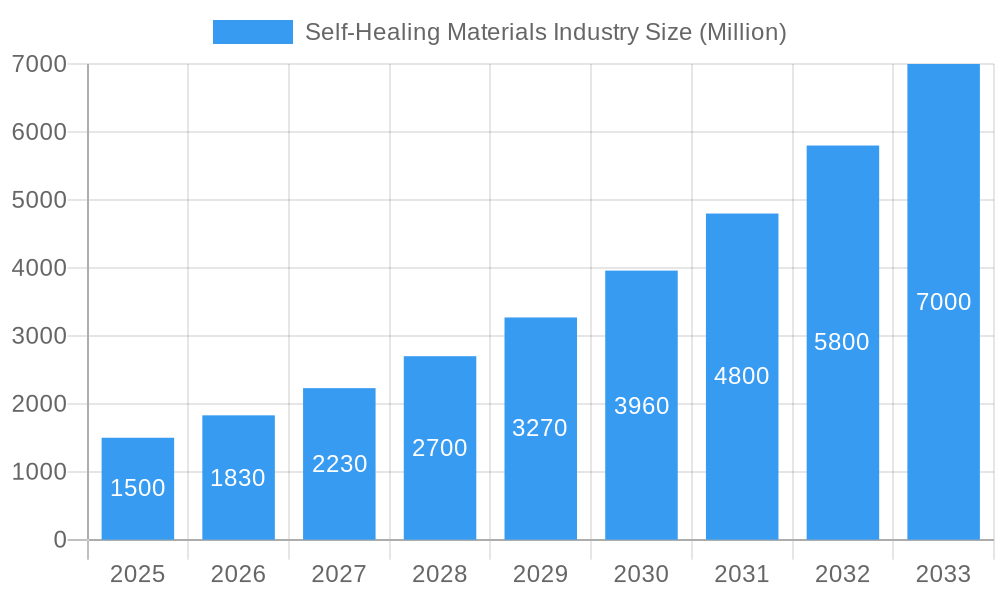
Self-Healing Materials Industry Market Size (In Billion)
Market segmentation by material type (polymers, composites, ceramics, concrete, others) and end-user industry highlights diverse growth patterns. Polymers and composites currently lead due to their adaptability and cost-effectiveness. However, advancements in ceramic and concrete self-healing technologies are set to increase their market share. The construction sector represents a primary end-user, followed by automotive and healthcare. Significant future growth potential is evident in the aerospace and electrical and electronics industries, driven by the demand for reliable and durable materials. Future market trends will be shaped by continued research and development focused on material enhancement, cost reduction, and broader application development. Government policies promoting sustainable and eco-friendly materials will further stimulate market expansion.
Self-Healing Materials Industry Company Market Share
Self-Healing Materials Industry Market Report: 2019-2033
This comprehensive report provides an in-depth analysis of the Self-Healing Materials industry, projecting a market value exceeding $XX Million by 2033. The study covers the period from 2019 to 2033, with a focus on the forecast period (2025-2033), utilizing 2025 as the base and estimated year. This report is essential for stakeholders seeking to understand market trends, technological advancements, and future opportunities within this rapidly evolving sector.
Self-Healing Materials Industry Market Composition & Trends
This section delves into the competitive landscape of the self-healing materials market, evaluating market concentration, innovation drivers, regulatory frameworks, substitute products, end-user profiles, and merger & acquisition (M&A) activities. The market exhibits a moderately fragmented structure, with several key players vying for market share. While precise market share distribution is proprietary data, we estimate that the top 5 players hold approximately 40% of the market share, with the remainder distributed among numerous smaller companies. M&A activity has been moderate, with total deal values estimated at $XX Million over the past five years, driven primarily by strategic acquisitions aimed at expanding technological capabilities and market reach. Key innovation catalysts include advancements in polymer chemistry, nanotechnology, and additive manufacturing. Regulatory landscapes vary across regions, with some jurisdictions actively promoting the adoption of self-healing materials through incentives and grants, while others have yet to establish specific regulations. Substitute products currently limit the market penetration of self-healing materials but are predicted to increase over the forecast period. The end-user profiles are diverse, encompassing healthcare, automotive, construction, and aerospace sectors, each presenting unique application opportunities and challenges.
- Market Concentration: Moderately fragmented, top 5 players holding approximately 40% market share.
- M&A Deal Value (2019-2024): Estimated at $XX Million.
- Innovation Catalysts: Polymer chemistry, nanotechnology, additive manufacturing.
- Regulatory Landscape: Varies significantly across regions.
- Substitute Products: Existing but limited in functionality.
Self-Healing Materials Industry Evolution
The self-healing materials market has witnessed substantial growth over the past five years, fueled by increasing demand for durable and sustainable materials across various industries. From 2019 to 2024, the market experienced a Compound Annual Growth Rate (CAGR) of approximately XX%, reaching a value of $XX Million in 2024. This growth trajectory is projected to continue, with a forecasted CAGR of XX% from 2025 to 2033, driven by technological advancements, such as the development of self-healing polymers and composites with enhanced mechanical properties and durability. Consumer demand for improved product lifespan and reduced maintenance costs is also a major driver, particularly in infrastructure and transportation sectors. The adoption rate of self-healing materials is expected to increase significantly in the coming years, particularly within the automotive and aerospace industries, as they offer potential for improved safety and reduced downtime. Advancements in manufacturing processes and material synthesis will play a crucial role in further driving market expansion. We foresee an increase in the use of self-healing technologies in infrastructure, leading to reduced maintenance and repair costs. The projected market size for 2033 will exceed $XX Million, driven by continued innovation and increased consumer awareness of the economic and environmental benefits of these materials.
Leading Regions, Countries, or Segments in Self-Healing Materials Industry
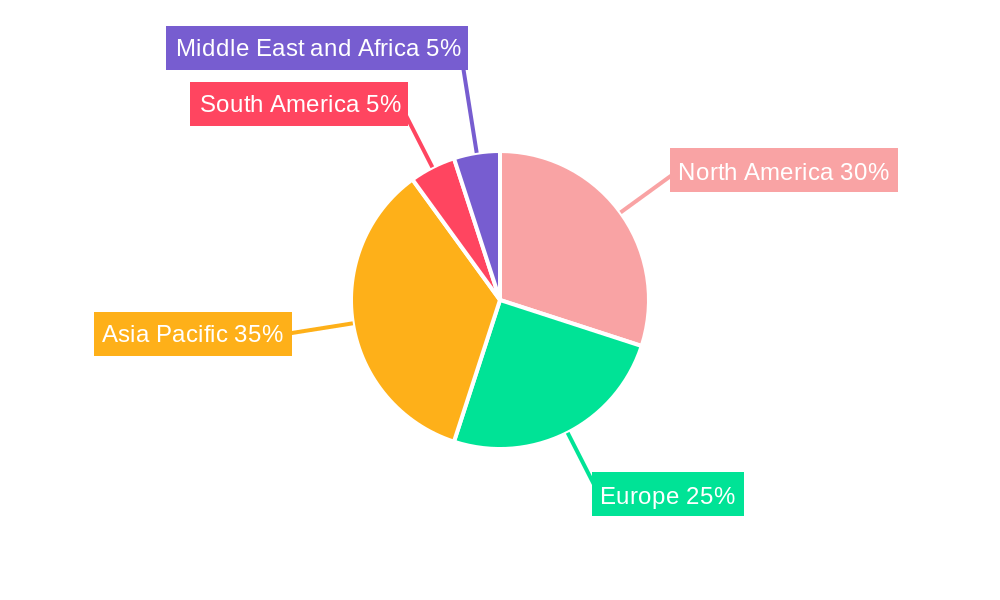
The North American region currently dominates the self-healing materials market, driven by significant investments in research and development, a strong automotive industry, and supportive regulatory frameworks. However, the Asia-Pacific region is expected to experience the fastest growth in the forecast period, fueled by rapid industrialization and increasing infrastructure development. Within material types, polymers represent the largest segment due to their versatility and relative ease of processing, followed by composites and ceramics. In terms of end-user industries, the automotive and aerospace sectors are leading adopters due to the high value of extended component lifespan and enhanced safety.
- North America: Dominant region due to R&D investments and strong automotive sector.
- Asia-Pacific: Fastest-growing region, driven by industrialization and infrastructure development.
- Leading Material Type: Polymers, followed by composites and ceramics.
- Leading End-User Industries: Automotive and aerospace.
Self-Healing Materials Industry Product Innovations
Recent innovations have focused on developing self-healing materials with enhanced performance characteristics and broader application ranges. Advancements in microcapsule technology have enabled the creation of self-healing polymers and composites with superior crack-healing capabilities. The introduction of self-healing concrete has shown promising results in extending infrastructure lifespan, and ongoing research is exploring the integration of self-healing functionalities into various types of building materials. The development of bio-inspired self-healing materials offers potential for environmentally friendly and sustainable solutions.
Propelling Factors for Self-Healing Materials Industry Growth
Several factors are driving the growth of the self-healing materials market. Firstly, the increasing demand for durable and sustainable materials across various end-user industries is a significant driver. Secondly, technological advancements in material science are leading to the development of novel self-healing materials with enhanced properties. Thirdly, government regulations and incentives promoting the adoption of sustainable materials are further stimulating market growth. Examples include the increased use of self-healing materials in infrastructure projects and the development of new applications in the automotive and aerospace industries, driving demand further.
Obstacles in the Self-Healing Materials Industry Market
Despite the significant potential, the self-healing materials market faces certain challenges. High initial costs and limited availability of these specialized materials are initial hurdles. Supply chain disruptions and lack of standardized testing protocols can also create uncertainty. The relatively nascent nature of the market also means that many applications are still under development, and it can be challenging for companies to convince potential customers to adopt new materials, resulting in moderate market penetration. Furthermore, intense competition from conventional materials can restrict market growth.
Future Opportunities in Self-Healing Materials Industry
Future opportunities for the self-healing materials market include expansion into new applications, such as in wearable electronics and biomedical devices. The development of advanced self-healing materials with improved performance metrics will further drive market growth. Increased adoption in emerging economies and the development of novel manufacturing techniques are additional opportunities worth pursuing. Focusing on improved cost-effectiveness and standardization of testing protocols will increase the adoption rate, ultimately leading to greater market growth and economic value.
Major Players in the Self-Healing Materials Industry Ecosystem
- Autonomic Materials Inc
- Michelin North America Inc
- The Goodyear Tire and Rubber Company
- Bayer AG
- NEI Corporation
- Evonik Industries AG
- MacDermid Autotype Ltd
- BASF SE
- Acciona S A
- Covestro AG
- Apple Inc
Key Developments in Self-Healing Materials Industry
- December 2022: Scientists at Riken, Japan, announced the creation of a self-healing polymer using readily available compounds, marking a significant advancement in material accessibility and cost-effectiveness.
- October 2022: Researchers at North Carolina State University developed a new self-healing composite enabling in-situ repair of structures, significantly extending the lifespan of components in applications such as wind turbine blades and aircraft wings. This breakthrough addresses two key limitations of existing self-healing technologies.
Strategic Self-Healing Materials Industry Market Forecast
The self-healing materials market is poised for substantial growth over the next decade. Continued technological innovation, increasing demand for durable and sustainable materials, and supportive government policies will drive market expansion. New applications in diverse sectors, coupled with decreasing production costs, will contribute to the market's significant growth potential, making it an attractive area for both established and emerging players. We project substantial growth exceeding $XX Million by 2033, driven by these factors.
Self-Healing Materials Industry Segmentation
-
1. Type
- 1.1. Polymers
- 1.2. Composites
- 1.3. Ceramics
- 1.4. Concrete
- 1.5. Other Types
-
2. End-user Industry
- 2.1. Healthcare
- 2.2. Automotive
- 2.3. Electrical and Electronics
- 2.4. Construction
- 2.5. Aerospace
- 2.6. Other End-user Industries
Self-Healing Materials Industry Segmentation By Geography
-
1. Asia Pacific
- 1.1. China
- 1.2. India
- 1.3. Japan
- 1.4. South Korea
- 1.5. ASEAN Countries
- 1.6. Rest of Asia Pacific
-
2. North America
- 2.1. United States
- 2.2. Canada
- 2.3. Mexico
-
3. Europe
- 3.1. Germany
- 3.2. United Kingdom
- 3.3. Italy
- 3.4. France
- 3.5. Rest of Europe
-
4. South America
- 4.1. Brazil
- 4.2. Argentina
- 4.3. Rest of South America
-
5. Middle East and Africa
- 5.1. Saudi Arabia
- 5.2. South Africa
- 5.3. Rest of Middle East and Africa
Self-Healing Materials Industry Regional Market Share
Geographic Coverage of Self-Healing Materials Industry
Self-Healing Materials Industry REPORT HIGHLIGHTS
| Aspects | Details |
|---|---|
| Study Period | 2020-2034 |
| Base Year | 2025 |
| Estimated Year | 2026 |
| Forecast Period | 2026-2034 |
| Historical Period | 2020-2025 |
| Growth Rate | CAGR of 31.5% from 2020-2034 |
| Segmentation |
|
Table of Contents
- 1. Introduction
- 1.1. Research Scope
- 1.2. Market Segmentation
- 1.3. Research Objective
- 1.4. Definitions and Assumptions
- 2. Executive Summary
- 2.1. Market Snapshot
- 3. Market Dynamics
- 3.1. Market Drivers
- 3.2. Market Restrains
- 3.3. Market Trends
- 3.4. Market Opportunities
- 4. Market Factor Analysis
- 4.1. Porters Five Forces
- 4.1.1. Bargaining Power of Suppliers
- 4.1.2. Bargaining Power of Buyers
- 4.1.3. Threat of New Entrants
- 4.1.4. Threat of Substitutes
- 4.1.5. Competitive Rivalry
- 4.2. PESTEL analysis
- 4.3. BCG Analysis
- 4.3.1. Stars (High Growth, High Market Share)
- 4.3.2. Cash Cows (Low Growth, High Market Share)
- 4.3.3. Question Mark (High Growth, Low Market Share)
- 4.3.4. Dogs (Low Growth, Low Market Share)
- 4.4. Ansoff Matrix Analysis
- 4.5. Supply Chain Analysis
- 4.6. Regulatory Landscape
- 4.7. Current Market Potential and Opportunity Assessment (TAM–SAM–SOM Framework)
- 4.8. DMV Analyst Note
- 4.1. Porters Five Forces
- 5. Market Analysis, Insights and Forecast 2021-2033
- 5.1. Market Analysis, Insights and Forecast - by Type
- 5.1.1. Polymers
- 5.1.2. Composites
- 5.1.3. Ceramics
- 5.1.4. Concrete
- 5.1.5. Other Types
- 5.2. Market Analysis, Insights and Forecast - by End-user Industry
- 5.2.1. Healthcare
- 5.2.2. Automotive
- 5.2.3. Electrical and Electronics
- 5.2.4. Construction
- 5.2.5. Aerospace
- 5.2.6. Other End-user Industries
- 5.3. Market Analysis, Insights and Forecast - by Region
- 5.3.1. Asia Pacific
- 5.3.2. North America
- 5.3.3. Europe
- 5.3.4. South America
- 5.3.5. Middle East and Africa
- 5.1. Market Analysis, Insights and Forecast - by Type
- 6. Global Self-Healing Materials Industry Analysis, Insights and Forecast, 2021-2033
- 6.1. Market Analysis, Insights and Forecast - by Type
- 6.1.1. Polymers
- 6.1.2. Composites
- 6.1.3. Ceramics
- 6.1.4. Concrete
- 6.1.5. Other Types
- 6.2. Market Analysis, Insights and Forecast - by End-user Industry
- 6.2.1. Healthcare
- 6.2.2. Automotive
- 6.2.3. Electrical and Electronics
- 6.2.4. Construction
- 6.2.5. Aerospace
- 6.2.6. Other End-user Industries
- 6.1. Market Analysis, Insights and Forecast - by Type
- 7. Asia Pacific Self-Healing Materials Industry Analysis, Insights and Forecast, 2020-2032
- 7.1. Market Analysis, Insights and Forecast - by Type
- 7.1.1. Polymers
- 7.1.2. Composites
- 7.1.3. Ceramics
- 7.1.4. Concrete
- 7.1.5. Other Types
- 7.2. Market Analysis, Insights and Forecast - by End-user Industry
- 7.2.1. Healthcare
- 7.2.2. Automotive
- 7.2.3. Electrical and Electronics
- 7.2.4. Construction
- 7.2.5. Aerospace
- 7.2.6. Other End-user Industries
- 7.1. Market Analysis, Insights and Forecast - by Type
- 8. North America Self-Healing Materials Industry Analysis, Insights and Forecast, 2020-2032
- 8.1. Market Analysis, Insights and Forecast - by Type
- 8.1.1. Polymers
- 8.1.2. Composites
- 8.1.3. Ceramics
- 8.1.4. Concrete
- 8.1.5. Other Types
- 8.2. Market Analysis, Insights and Forecast - by End-user Industry
- 8.2.1. Healthcare
- 8.2.2. Automotive
- 8.2.3. Electrical and Electronics
- 8.2.4. Construction
- 8.2.5. Aerospace
- 8.2.6. Other End-user Industries
- 8.1. Market Analysis, Insights and Forecast - by Type
- 9. Europe Self-Healing Materials Industry Analysis, Insights and Forecast, 2020-2032
- 9.1. Market Analysis, Insights and Forecast - by Type
- 9.1.1. Polymers
- 9.1.2. Composites
- 9.1.3. Ceramics
- 9.1.4. Concrete
- 9.1.5. Other Types
- 9.2. Market Analysis, Insights and Forecast - by End-user Industry
- 9.2.1. Healthcare
- 9.2.2. Automotive
- 9.2.3. Electrical and Electronics
- 9.2.4. Construction
- 9.2.5. Aerospace
- 9.2.6. Other End-user Industries
- 9.1. Market Analysis, Insights and Forecast - by Type
- 10. South America Self-Healing Materials Industry Analysis, Insights and Forecast, 2020-2032
- 10.1. Market Analysis, Insights and Forecast - by Type
- 10.1.1. Polymers
- 10.1.2. Composites
- 10.1.3. Ceramics
- 10.1.4. Concrete
- 10.1.5. Other Types
- 10.2. Market Analysis, Insights and Forecast - by End-user Industry
- 10.2.1. Healthcare
- 10.2.2. Automotive
- 10.2.3. Electrical and Electronics
- 10.2.4. Construction
- 10.2.5. Aerospace
- 10.2.6. Other End-user Industries
- 10.1. Market Analysis, Insights and Forecast - by Type
- 11. Middle East and Africa Self-Healing Materials Industry Analysis, Insights and Forecast, 2020-2032
- 11.1. Market Analysis, Insights and Forecast - by Type
- 11.1.1. Polymers
- 11.1.2. Composites
- 11.1.3. Ceramics
- 11.1.4. Concrete
- 11.1.5. Other Types
- 11.2. Market Analysis, Insights and Forecast - by End-user Industry
- 11.2.1. Healthcare
- 11.2.2. Automotive
- 11.2.3. Electrical and Electronics
- 11.2.4. Construction
- 11.2.5. Aerospace
- 11.2.6. Other End-user Industries
- 11.1. Market Analysis, Insights and Forecast - by Type
- 12. Competitive Analysis
- 12.1. Company Profiles
- 12.1.1 Autonomic Materials Inc
- 12.1.1.1. Company Overview
- 12.1.1.2. Products
- 12.1.1.3. Company Financials
- 12.1.1.4. SWOT Analysis
- 12.1.2 Michelin North America Inc
- 12.1.2.1. Company Overview
- 12.1.2.2. Products
- 12.1.2.3. Company Financials
- 12.1.2.4. SWOT Analysis
- 12.1.3 The Goodyear Tire and Rubber Company*List Not Exhaustive
- 12.1.3.1. Company Overview
- 12.1.3.2. Products
- 12.1.3.3. Company Financials
- 12.1.3.4. SWOT Analysis
- 12.1.4 Bayer AG
- 12.1.4.1. Company Overview
- 12.1.4.2. Products
- 12.1.4.3. Company Financials
- 12.1.4.4. SWOT Analysis
- 12.1.5 NEI Corporation
- 12.1.5.1. Company Overview
- 12.1.5.2. Products
- 12.1.5.3. Company Financials
- 12.1.5.4. SWOT Analysis
- 12.1.6 Evonik Industries AG
- 12.1.6.1. Company Overview
- 12.1.6.2. Products
- 12.1.6.3. Company Financials
- 12.1.6.4. SWOT Analysis
- 12.1.7 MacDermid Autotype Ltd
- 12.1.7.1. Company Overview
- 12.1.7.2. Products
- 12.1.7.3. Company Financials
- 12.1.7.4. SWOT Analysis
- 12.1.8 BASF SE
- 12.1.8.1. Company Overview
- 12.1.8.2. Products
- 12.1.8.3. Company Financials
- 12.1.8.4. SWOT Analysis
- 12.1.9 Acciona S A
- 12.1.9.1. Company Overview
- 12.1.9.2. Products
- 12.1.9.3. Company Financials
- 12.1.9.4. SWOT Analysis
- 12.1.10 Covestro AG
- 12.1.10.1. Company Overview
- 12.1.10.2. Products
- 12.1.10.3. Company Financials
- 12.1.10.4. SWOT Analysis
- 12.1.11 Apple Inc
- 12.1.11.1. Company Overview
- 12.1.11.2. Products
- 12.1.11.3. Company Financials
- 12.1.11.4. SWOT Analysis
- 12.1.1 Autonomic Materials Inc
- 12.2. Market Entropy
- 12.2.1 Company's Key Areas Served
- 12.2.2 Recent Developments
- 12.3. Company Market Share Analysis 2025
- 12.3.1 Top 5 Companies Market Share Analysis
- 12.3.2 Top 3 Companies Market Share Analysis
- 12.4. List of Potential Customers
- 13. Research Methodology
List of Figures
- Figure 1: Global Self-Healing Materials Industry Revenue Breakdown (billion, %) by Region 2025 & 2033
- Figure 2: Asia Pacific Self-Healing Materials Industry Revenue (billion), by Type 2025 & 2033
- Figure 3: Asia Pacific Self-Healing Materials Industry Revenue Share (%), by Type 2025 & 2033
- Figure 4: Asia Pacific Self-Healing Materials Industry Revenue (billion), by End-user Industry 2025 & 2033
- Figure 5: Asia Pacific Self-Healing Materials Industry Revenue Share (%), by End-user Industry 2025 & 2033
- Figure 6: Asia Pacific Self-Healing Materials Industry Revenue (billion), by Country 2025 & 2033
- Figure 7: Asia Pacific Self-Healing Materials Industry Revenue Share (%), by Country 2025 & 2033
- Figure 8: North America Self-Healing Materials Industry Revenue (billion), by Type 2025 & 2033
- Figure 9: North America Self-Healing Materials Industry Revenue Share (%), by Type 2025 & 2033
- Figure 10: North America Self-Healing Materials Industry Revenue (billion), by End-user Industry 2025 & 2033
- Figure 11: North America Self-Healing Materials Industry Revenue Share (%), by End-user Industry 2025 & 2033
- Figure 12: North America Self-Healing Materials Industry Revenue (billion), by Country 2025 & 2033
- Figure 13: North America Self-Healing Materials Industry Revenue Share (%), by Country 2025 & 2033
- Figure 14: Europe Self-Healing Materials Industry Revenue (billion), by Type 2025 & 2033
- Figure 15: Europe Self-Healing Materials Industry Revenue Share (%), by Type 2025 & 2033
- Figure 16: Europe Self-Healing Materials Industry Revenue (billion), by End-user Industry 2025 & 2033
- Figure 17: Europe Self-Healing Materials Industry Revenue Share (%), by End-user Industry 2025 & 2033
- Figure 18: Europe Self-Healing Materials Industry Revenue (billion), by Country 2025 & 2033
- Figure 19: Europe Self-Healing Materials Industry Revenue Share (%), by Country 2025 & 2033
- Figure 20: South America Self-Healing Materials Industry Revenue (billion), by Type 2025 & 2033
- Figure 21: South America Self-Healing Materials Industry Revenue Share (%), by Type 2025 & 2033
- Figure 22: South America Self-Healing Materials Industry Revenue (billion), by End-user Industry 2025 & 2033
- Figure 23: South America Self-Healing Materials Industry Revenue Share (%), by End-user Industry 2025 & 2033
- Figure 24: South America Self-Healing Materials Industry Revenue (billion), by Country 2025 & 2033
- Figure 25: South America Self-Healing Materials Industry Revenue Share (%), by Country 2025 & 2033
- Figure 26: Middle East and Africa Self-Healing Materials Industry Revenue (billion), by Type 2025 & 2033
- Figure 27: Middle East and Africa Self-Healing Materials Industry Revenue Share (%), by Type 2025 & 2033
- Figure 28: Middle East and Africa Self-Healing Materials Industry Revenue (billion), by End-user Industry 2025 & 2033
- Figure 29: Middle East and Africa Self-Healing Materials Industry Revenue Share (%), by End-user Industry 2025 & 2033
- Figure 30: Middle East and Africa Self-Healing Materials Industry Revenue (billion), by Country 2025 & 2033
- Figure 31: Middle East and Africa Self-Healing Materials Industry Revenue Share (%), by Country 2025 & 2033
List of Tables
- Table 1: Global Self-Healing Materials Industry Revenue billion Forecast, by Type 2020 & 2033
- Table 2: Global Self-Healing Materials Industry Revenue billion Forecast, by End-user Industry 2020 & 2033
- Table 3: Global Self-Healing Materials Industry Revenue billion Forecast, by Region 2020 & 2033
- Table 4: Global Self-Healing Materials Industry Revenue billion Forecast, by Type 2020 & 2033
- Table 5: Global Self-Healing Materials Industry Revenue billion Forecast, by End-user Industry 2020 & 2033
- Table 6: Global Self-Healing Materials Industry Revenue billion Forecast, by Country 2020 & 2033
- Table 7: China Self-Healing Materials Industry Revenue (billion) Forecast, by Application 2020 & 2033
- Table 8: India Self-Healing Materials Industry Revenue (billion) Forecast, by Application 2020 & 2033
- Table 9: Japan Self-Healing Materials Industry Revenue (billion) Forecast, by Application 2020 & 2033
- Table 10: South Korea Self-Healing Materials Industry Revenue (billion) Forecast, by Application 2020 & 2033
- Table 11: ASEAN Countries Self-Healing Materials Industry Revenue (billion) Forecast, by Application 2020 & 2033
- Table 12: Rest of Asia Pacific Self-Healing Materials Industry Revenue (billion) Forecast, by Application 2020 & 2033
- Table 13: Global Self-Healing Materials Industry Revenue billion Forecast, by Type 2020 & 2033
- Table 14: Global Self-Healing Materials Industry Revenue billion Forecast, by End-user Industry 2020 & 2033
- Table 15: Global Self-Healing Materials Industry Revenue billion Forecast, by Country 2020 & 2033
- Table 16: United States Self-Healing Materials Industry Revenue (billion) Forecast, by Application 2020 & 2033
- Table 17: Canada Self-Healing Materials Industry Revenue (billion) Forecast, by Application 2020 & 2033
- Table 18: Mexico Self-Healing Materials Industry Revenue (billion) Forecast, by Application 2020 & 2033
- Table 19: Global Self-Healing Materials Industry Revenue billion Forecast, by Type 2020 & 2033
- Table 20: Global Self-Healing Materials Industry Revenue billion Forecast, by End-user Industry 2020 & 2033
- Table 21: Global Self-Healing Materials Industry Revenue billion Forecast, by Country 2020 & 2033
- Table 22: Germany Self-Healing Materials Industry Revenue (billion) Forecast, by Application 2020 & 2033
- Table 23: United Kingdom Self-Healing Materials Industry Revenue (billion) Forecast, by Application 2020 & 2033
- Table 24: Italy Self-Healing Materials Industry Revenue (billion) Forecast, by Application 2020 & 2033
- Table 25: France Self-Healing Materials Industry Revenue (billion) Forecast, by Application 2020 & 2033
- Table 26: Rest of Europe Self-Healing Materials Industry Revenue (billion) Forecast, by Application 2020 & 2033
- Table 27: Global Self-Healing Materials Industry Revenue billion Forecast, by Type 2020 & 2033
- Table 28: Global Self-Healing Materials Industry Revenue billion Forecast, by End-user Industry 2020 & 2033
- Table 29: Global Self-Healing Materials Industry Revenue billion Forecast, by Country 2020 & 2033
- Table 30: Brazil Self-Healing Materials Industry Revenue (billion) Forecast, by Application 2020 & 2033
- Table 31: Argentina Self-Healing Materials Industry Revenue (billion) Forecast, by Application 2020 & 2033
- Table 32: Rest of South America Self-Healing Materials Industry Revenue (billion) Forecast, by Application 2020 & 2033
- Table 33: Global Self-Healing Materials Industry Revenue billion Forecast, by Type 2020 & 2033
- Table 34: Global Self-Healing Materials Industry Revenue billion Forecast, by End-user Industry 2020 & 2033
- Table 35: Global Self-Healing Materials Industry Revenue billion Forecast, by Country 2020 & 2033
- Table 36: Saudi Arabia Self-Healing Materials Industry Revenue (billion) Forecast, by Application 2020 & 2033
- Table 37: South Africa Self-Healing Materials Industry Revenue (billion) Forecast, by Application 2020 & 2033
- Table 38: Rest of Middle East and Africa Self-Healing Materials Industry Revenue (billion) Forecast, by Application 2020 & 2033
Frequently Asked Questions
1. What is the projected Compound Annual Growth Rate (CAGR) of the Self-Healing Materials Industry?
The projected CAGR is approximately 31.5%.
2. Which companies are prominent players in the Self-Healing Materials Industry?
Key companies in the market include Autonomic Materials Inc, Michelin North America Inc, The Goodyear Tire and Rubber Company*List Not Exhaustive, Bayer AG, NEI Corporation, Evonik Industries AG, MacDermid Autotype Ltd, BASF SE, Acciona S A, Covestro AG, Apple Inc.
3. What are the main segments of the Self-Healing Materials Industry?
The market segments include Type, End-user Industry.
4. Can you provide details about the market size?
The market size is estimated to be USD 109.3 billion as of 2022.
5. What are some drivers contributing to market growth?
Increased Development in the Construction Industry; Growing Use of Self-healing Materials in Biomimetics; Other Drivers.
6. What are the notable trends driving market growth?
Construction Inudstry to Dominate the Market.
7. Are there any restraints impacting market growth?
High Cost of Self-healing Materials; Other Restraints.
8. Can you provide examples of recent developments in the market?
December 2022: Scientists at Riken, Japan, announced that they had created a self-healing polymer using an off-the-shelf compound for the first time. It is reported that the polymer that heals itself is made from readily available building blocks.
9. What pricing options are available for accessing the report?
Pricing options include single-user, multi-user, and enterprise licenses priced at USD 4750, USD 5250, and USD 8750 respectively.
10. Is the market size provided in terms of value or volume?
The market size is provided in terms of value, measured in billion.
11. Are there any specific market keywords associated with the report?
Yes, the market keyword associated with the report is "Self-Healing Materials Industry," which aids in identifying and referencing the specific market segment covered.
12. How do I determine which pricing option suits my needs best?
The pricing options vary based on user requirements and access needs. Individual users may opt for single-user licenses, while businesses requiring broader access may choose multi-user or enterprise licenses for cost-effective access to the report.
13. Are there any additional resources or data provided in the Self-Healing Materials Industry report?
While the report offers comprehensive insights, it's advisable to review the specific contents or supplementary materials provided to ascertain if additional resources or data are available.
14. How can I stay updated on further developments or reports in the Self-Healing Materials Industry?
To stay informed about further developments, trends, and reports in the Self-Healing Materials Industry, consider subscribing to industry newsletters, following relevant companies and organizations, or regularly checking reputable industry news sources and publications.
Methodology
Step 1 - Identification of Relevant Samples Size from Population Database


Step 2 - Approaches for Defining Global Market Size (Value, Volume* & Price*)

Note*: In applicable scenarios
Step 3 - Data Sources
Primary Research
- Web Analytics
- Survey Reports
- Research Institute
- Latest Research Reports
- Opinion Leaders
Secondary Research
- Annual Reports
- White Paper
- Latest Press Release
- Industry Association
- Paid Database
- Investor Presentations

Step 4 - Data Triangulation
Involves using different sources of information in order to increase the validity of a study
These sources are likely to be stakeholders in a program - participants, other researchers, program staff, other community members, and so on.
Then we put all data in single framework & apply various statistical tools to find out the dynamic on the market.
During the analysis stage, feedback from the stakeholder groups would be compared to determine areas of agreement as well as areas of divergence