

Key Insights
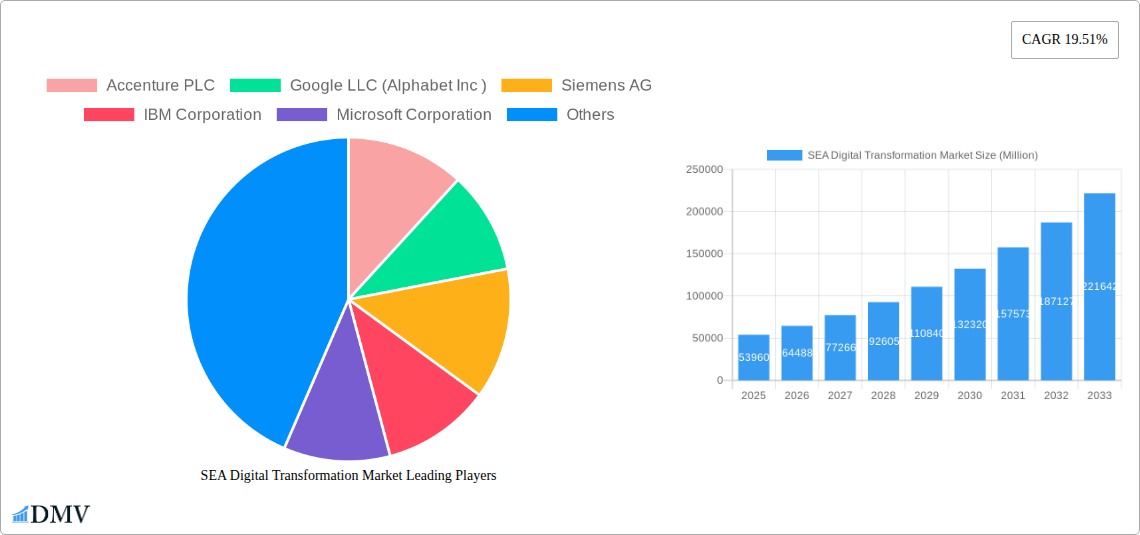
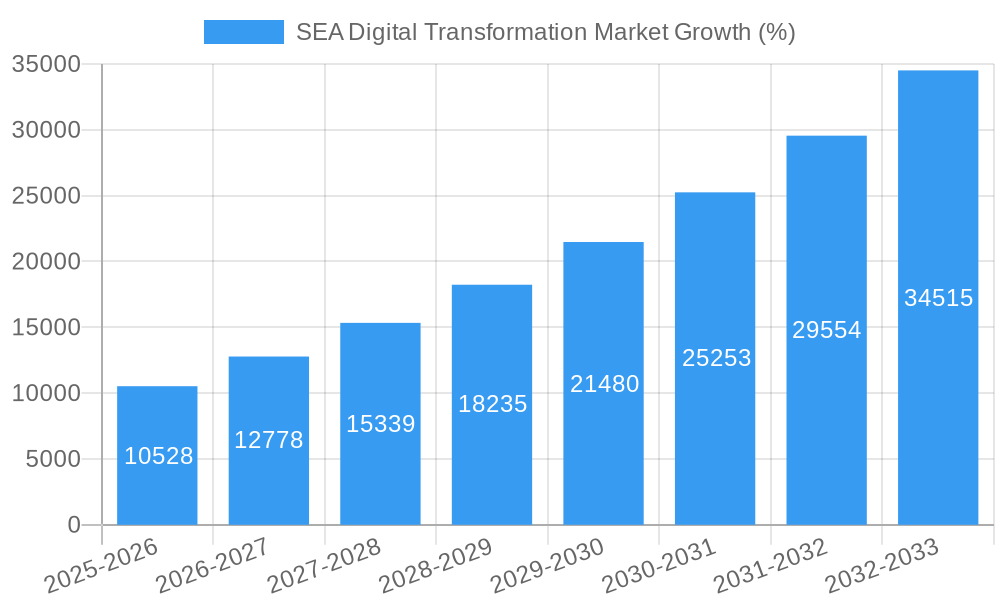
The Southeast Asia (SEA) digital transformation market is experiencing robust growth, projected to reach \$53.96 billion in 2025 and exhibiting a Compound Annual Growth Rate (CAGR) of 19.51% from 2025 to 2033. This expansion is fueled by several key drivers. Firstly, increasing government initiatives promoting digitalization across various sectors, such as finance, healthcare, and education, are creating a favorable environment for investment and adoption. Secondly, the region's burgeoning e-commerce sector and rising smartphone penetration are driving demand for digital solutions. Furthermore, the increasing adoption of cloud computing, big data analytics, and artificial intelligence (AI) is accelerating the pace of digital transformation across enterprises. Finally, a young and tech-savvy population readily embraces new technologies, fueling market growth. Competition is fierce, with major players like Accenture, Google, IBM, Microsoft, and Salesforce competing for market share alongside regional players.
However, the market is not without its challenges. Significant disparities in digital infrastructure and digital literacy across different SEA countries present a key restraint. Addressing the digital divide and fostering digital skills development are crucial for sustained market growth. Data security and privacy concerns also pose a challenge, requiring robust cybersecurity measures and regulatory frameworks. Despite these hurdles, the long-term outlook for the SEA digital transformation market remains positive, driven by continued economic growth, technological advancements, and the ongoing shift towards a digital economy. The market segmentation will likely see increased focus on specific industry verticals like Fintech and healthcare, reflecting sector-specific demands for digital solutions. This will create opportunities for both established tech giants and innovative startups to cater to the diverse needs of the SEA market.
SEA Digital Transformation Market: A Comprehensive Report (2019-2033)
This insightful report provides a detailed analysis of the Southeast Asia (SEA) Digital Transformation Market, offering a comprehensive overview of its current state, future trajectory, and key players. Covering the period from 2019 to 2033, with a focus on 2025, this report is an essential resource for stakeholders seeking to understand and capitalize on the immense opportunities within this rapidly evolving market. The report projects a market valued at XX Million by 2033, representing substantial growth from the 2025 estimated value of XX Million.
SEA Digital Transformation Market Composition & Trends
This section delves into the intricate structure of the SEA digital transformation market, examining its concentration levels, innovation drivers, regulatory landscape, substitute products, and end-user profiles. We analyze market share distribution among key players, revealing the competitive intensity and identifying potential areas for disruption. Furthermore, a detailed examination of mergers and acquisitions (M&A) activity, including deal values, provides critical insights into market consolidation and strategic positioning.
- Market Concentration: The market exhibits a [Describe concentration level, e.g., moderately concentrated] structure with [Number] major players holding approximately [Percentage]% of the market share. Smaller players account for the remaining [Percentage]%.
- Innovation Catalysts: Government initiatives promoting digital adoption, rising consumer demand for digital services, and increasing venture capital investments are driving innovation.
- Regulatory Landscape: Varying regulations across SEA nations influence market development, creating both opportunities and challenges for businesses.
- Substitute Products/Services: The emergence of alternative technologies and solutions poses a potential threat, impacting market growth and share.
- End-User Profiles: The report profiles key end-user segments, including [List key segments, e.g., BFSI, Manufacturing, Retail], highlighting their specific digital transformation needs and adoption rates.
- M&A Activity: Significant M&A activity, with deal values exceeding XX Million in the past five years, indicates a trend toward market consolidation and the integration of complementary technologies.
SEA Digital Transformation Market Industry Evolution
This section charts the evolution of the SEA digital transformation market, analyzing its growth trajectory, technological advancements, and shifting consumer demands. We provide granular data on market growth rates, adoption metrics, and technological trends that shape the industry landscape. The analysis reveals a dynamic market responding to rapid technological change and evolving consumer expectations. We observe a [e.g., CAGR of X%] growth rate between [Year] and [Year], driven by [mention specific reasons]. The market shows a strong positive correlation between the increase in mobile penetration and digital adoption rate, leading to a [quantifiable impact]. Technological innovations such as [mention some specific innovations] significantly impacted market evolution.
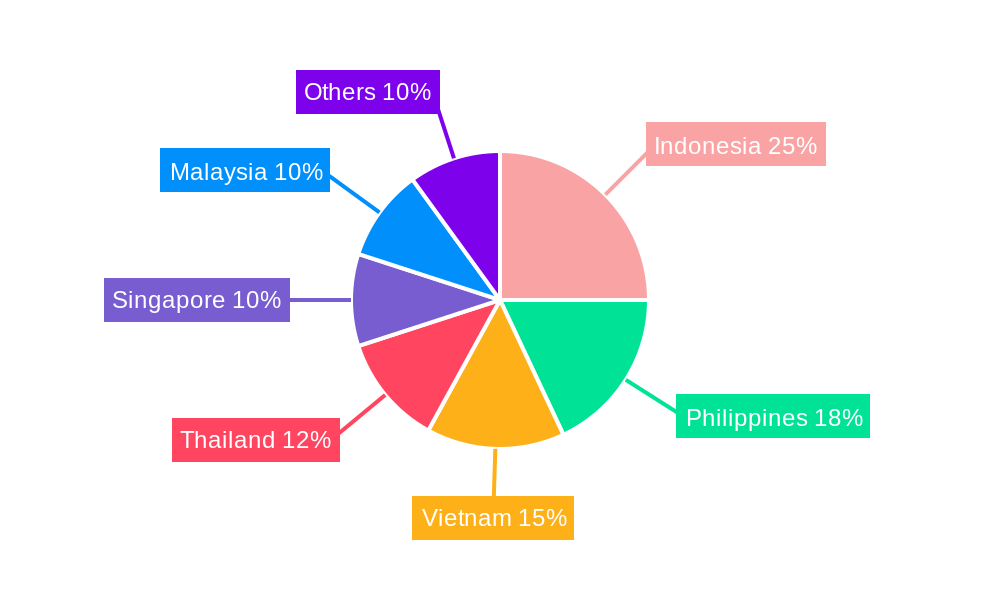
Leading Regions, Countries, or Segments in SEA Digital Transformation Market
This section pinpoints the dominant regions, countries, or segments within the SEA digital transformation market. We provide a detailed analysis of the factors contributing to their leadership position, including investment trends, regulatory support, and market dynamics.
- Dominant Region/Country: [Identify the dominant region/country, e.g., Singapore] leads the market due to its strong digital infrastructure, supportive government policies, and high levels of digital literacy.
- Key Drivers:
- High levels of Foreign Direct Investment (FDI): [Quantify FDI if possible] in the digital sector fuels innovation and expansion.
- Pro-business Government Policies: [Mention specific supportive policies].
- Robust Digital Infrastructure: [Detail the strengths of the infrastructure, e.g., high internet penetration].
- Skilled Workforce: [Mention factors like availability of skilled IT professionals].
SEA Digital Transformation Market Product Innovations
The SEA digital transformation market is witnessing a surge in innovative products and applications, driving efficiency and productivity gains. Cloud computing, AI, and IoT technologies are transforming various sectors, enhancing business processes, and delivering enhanced customer experiences. The unique selling propositions (USPs) of these new offerings emphasize scalability, enhanced security, and seamless integration with existing systems, leading to a wider adoption. Specific performance metrics such as cost reduction, process optimization, and customer satisfaction improvements are documented for several products.
Propelling Factors for SEA Digital Transformation Market Growth
Several factors contribute to the robust growth of the SEA digital transformation market. Technological advancements, favorable economic conditions, and supportive government regulations create a fertile ground for market expansion. The rising adoption of cloud computing, the proliferation of mobile devices, and the increasing penetration of high-speed internet are all significant drivers. Economic factors, including rising disposable incomes and increased business investment in technology, further boost the market's growth trajectory. Government initiatives promoting digital adoption create a conducive environment for market expansion.
Obstacles in the SEA Digital Transformation Market
Despite the significant growth potential, several obstacles hinder the SEA digital transformation market's expansion. Regulatory uncertainties and inconsistencies across different SEA nations create challenges for businesses. Supply chain disruptions, especially evident in the aftermath of recent global events, lead to delays and increased costs. Furthermore, intense competition among established players and new entrants can create price pressures and reduce profitability margins.
Future Opportunities in SEA Digital Transformation Market
The SEA digital transformation market presents significant future opportunities. The untapped potential in rural areas, with their growing internet penetration and adoption of mobile technologies, offers considerable market expansion potential. Emerging technologies like blockchain, extended reality (XR), and quantum computing hold immense possibilities. Shifting consumer preferences toward personalized experiences and seamless digital interactions present new opportunities for businesses to innovate and capture market share.
Major Players in the SEA Digital Transformation Market Ecosystem
- Accenture PLC
- Google LLC (Alphabet Inc)
- Siemens AG
- IBM Corporation
- Microsoft Corporation
- Cognex Corporation
- Hewlett Packard Enterprise
- SAP SE
- EMC Corporation (Dell EMC)
- Oracle Corporation
- Adobe Inc
- Amazon Web Services Inc (Amazon com Inc)
- Apple Inc
- Salesforce com Inc
- Cisco Systems Inc
Key Developments in SEA Digital Transformation Market Industry
- July 2024: The Monetary Authority of Singapore (MAS) pledged an additional USD 134.3 Million to boost financial institutions' expertise in quantum and AI technologies through the FTSI 3.0 grant scheme. This significantly impacts the adoption of these technologies within the financial sector.
- May 2024: Microsoft's USD 2.2 Billion investment in Malaysia over four years, focused on cloud and AI infrastructure development and talent training, will substantially boost Malaysia's digital transformation capabilities and create a strong foundation for future growth in the market.
Strategic SEA Digital Transformation Market Forecast
The SEA digital transformation market is poised for continued robust growth, driven by sustained technological advancements, increasing digital literacy, and supportive government policies. The convergence of emerging technologies and growing consumer demand for digital solutions presents significant opportunities for market expansion and innovation. The market's future trajectory indicates significant potential for growth and substantial returns for businesses strategically positioned to capitalize on these trends.
SEA Digital Transformation Market Segmentation
-
1. Type
-
1.1. Analytic
- 1.1.1. Current
- 1.1.2. Key Grow
- 1.1.3. Use Case Analysis
- 1.1.4. Market Outlook
- 1.2. Extended Reality (XR)
- 1.3. IoT
- 1.4. Industrial Robotics
- 1.5. Blockchain
- 1.6. Additive Manufacturing/3D Printing
- 1.7. Cybersecurity
- 1.8. Cloud and Edge Computing
-
1.9. Others (Digital Twin, Mobility, and Connectivity)
- 1.9.1. Market B
-
1.1. Analytic
-
2. End-user Industry
- 2.1. Manufacturing
- 2.2. Oil, Gas, and Utilities
- 2.3. Retail & e-commerce
- 2.4. Transportation and Logistics
- 2.5. Healthcare
- 2.6. BFSI
- 2.7. Telecom and IT
- 2.8. Government and Public Sector
- 2.9. Other En
SEA Digital Transformation Market Segmentation By Geography
-
1. North America
- 1.1. United States
- 1.2. Canada
- 1.3. Mexico
-
2. South America
- 2.1. Brazil
- 2.2. Argentina
- 2.3. Rest of South America
-
3. Europe
- 3.1. United Kingdom
- 3.2. Germany
- 3.3. France
- 3.4. Italy
- 3.5. Spain
- 3.6. Russia
- 3.7. Benelux
- 3.8. Nordics
- 3.9. Rest of Europe
-
4. Middle East & Africa
- 4.1. Turkey
- 4.2. Israel
- 4.3. GCC
- 4.4. North Africa
- 4.5. South Africa
- 4.6. Rest of Middle East & Africa
-
5. Asia Pacific
- 5.1. China
- 5.2. India
- 5.3. Japan
- 5.4. South Korea
- 5.5. ASEAN
- 5.6. Oceania
- 5.7. Rest of Asia Pacific
SEA Digital Transformation Market REPORT HIGHLIGHTS
| Aspects | Details |
|---|---|
| Study Period | 2019-2033 |
| Base Year | 2024 |
| Estimated Year | 2025 |
| Forecast Period | 2025-2033 |
| Historical Period | 2019-2024 |
| Growth Rate | CAGR of 19.51% from 2019-2033 |
| Segmentation |
|
Table of Contents
- 1. Introduction
- 1.1. Research Scope
- 1.2. Market Segmentation
- 1.3. Research Methodology
- 1.4. Definitions and Assumptions
- 2. Executive Summary
- 2.1. Introduction
- 3. Market Dynamics
- 3.1. Introduction
- 3.2. Market Drivers
- 3.2.1. Increase in the Adoption of Big Data Analytics and Other Technologies to Drive the Market; The Rapid Proliferation of Mobile Devices and Apps
- 3.3. Market Restrains
- 3.3.1. Increase in the Adoption of Big Data Analytics and Other Technologies to Drive the Market; The Rapid Proliferation of Mobile Devices and Apps
- 3.4. Market Trends
- 3.4.1. Increase in the Adoption of Big Data Analytics and Other Technologies to Drive the Market
- 4. Market Factor Analysis
- 4.1. Porters Five Forces
- 4.2. Supply/Value Chain
- 4.3. PESTEL analysis
- 4.4. Market Entropy
- 4.5. Patent/Trademark Analysis
- 5. Global SEA Digital Transformation Market Analysis, Insights and Forecast, 2019-2031
- 5.1. Market Analysis, Insights and Forecast - by Type
- 5.1.1. Analytic
- 5.1.1.1. Current
- 5.1.1.2. Key Grow
- 5.1.1.3. Use Case Analysis
- 5.1.1.4. Market Outlook
- 5.1.2. Extended Reality (XR)
- 5.1.3. IoT
- 5.1.4. Industrial Robotics
- 5.1.5. Blockchain
- 5.1.6. Additive Manufacturing/3D Printing
- 5.1.7. Cybersecurity
- 5.1.8. Cloud and Edge Computing
- 5.1.9. Others (Digital Twin, Mobility, and Connectivity)
- 5.1.9.1. Market B
- 5.1.1. Analytic
- 5.2. Market Analysis, Insights and Forecast - by End-user Industry
- 5.2.1. Manufacturing
- 5.2.2. Oil, Gas, and Utilities
- 5.2.3. Retail & e-commerce
- 5.2.4. Transportation and Logistics
- 5.2.5. Healthcare
- 5.2.6. BFSI
- 5.2.7. Telecom and IT
- 5.2.8. Government and Public Sector
- 5.2.9. Other En
- 5.3. Market Analysis, Insights and Forecast - by Region
- 5.3.1. North America
- 5.3.2. South America
- 5.3.3. Europe
- 5.3.4. Middle East & Africa
- 5.3.5. Asia Pacific
- 5.1. Market Analysis, Insights and Forecast - by Type
- 6. North America SEA Digital Transformation Market Analysis, Insights and Forecast, 2019-2031
- 6.1. Market Analysis, Insights and Forecast - by Type
- 6.1.1. Analytic
- 6.1.1.1. Current
- 6.1.1.2. Key Grow
- 6.1.1.3. Use Case Analysis
- 6.1.1.4. Market Outlook
- 6.1.2. Extended Reality (XR)
- 6.1.3. IoT
- 6.1.4. Industrial Robotics
- 6.1.5. Blockchain
- 6.1.6. Additive Manufacturing/3D Printing
- 6.1.7. Cybersecurity
- 6.1.8. Cloud and Edge Computing
- 6.1.9. Others (Digital Twin, Mobility, and Connectivity)
- 6.1.9.1. Market B
- 6.1.1. Analytic
- 6.2. Market Analysis, Insights and Forecast - by End-user Industry
- 6.2.1. Manufacturing
- 6.2.2. Oil, Gas, and Utilities
- 6.2.3. Retail & e-commerce
- 6.2.4. Transportation and Logistics
- 6.2.5. Healthcare
- 6.2.6. BFSI
- 6.2.7. Telecom and IT
- 6.2.8. Government and Public Sector
- 6.2.9. Other En
- 6.1. Market Analysis, Insights and Forecast - by Type
- 7. South America SEA Digital Transformation Market Analysis, Insights and Forecast, 2019-2031
- 7.1. Market Analysis, Insights and Forecast - by Type
- 7.1.1. Analytic
- 7.1.1.1. Current
- 7.1.1.2. Key Grow
- 7.1.1.3. Use Case Analysis
- 7.1.1.4. Market Outlook
- 7.1.2. Extended Reality (XR)
- 7.1.3. IoT
- 7.1.4. Industrial Robotics
- 7.1.5. Blockchain
- 7.1.6. Additive Manufacturing/3D Printing
- 7.1.7. Cybersecurity
- 7.1.8. Cloud and Edge Computing
- 7.1.9. Others (Digital Twin, Mobility, and Connectivity)
- 7.1.9.1. Market B
- 7.1.1. Analytic
- 7.2. Market Analysis, Insights and Forecast - by End-user Industry
- 7.2.1. Manufacturing
- 7.2.2. Oil, Gas, and Utilities
- 7.2.3. Retail & e-commerce
- 7.2.4. Transportation and Logistics
- 7.2.5. Healthcare
- 7.2.6. BFSI
- 7.2.7. Telecom and IT
- 7.2.8. Government and Public Sector
- 7.2.9. Other En
- 7.1. Market Analysis, Insights and Forecast - by Type
- 8. Europe SEA Digital Transformation Market Analysis, Insights and Forecast, 2019-2031
- 8.1. Market Analysis, Insights and Forecast - by Type
- 8.1.1. Analytic
- 8.1.1.1. Current
- 8.1.1.2. Key Grow
- 8.1.1.3. Use Case Analysis
- 8.1.1.4. Market Outlook
- 8.1.2. Extended Reality (XR)
- 8.1.3. IoT
- 8.1.4. Industrial Robotics
- 8.1.5. Blockchain
- 8.1.6. Additive Manufacturing/3D Printing
- 8.1.7. Cybersecurity
- 8.1.8. Cloud and Edge Computing
- 8.1.9. Others (Digital Twin, Mobility, and Connectivity)
- 8.1.9.1. Market B
- 8.1.1. Analytic
- 8.2. Market Analysis, Insights and Forecast - by End-user Industry
- 8.2.1. Manufacturing
- 8.2.2. Oil, Gas, and Utilities
- 8.2.3. Retail & e-commerce
- 8.2.4. Transportation and Logistics
- 8.2.5. Healthcare
- 8.2.6. BFSI
- 8.2.7. Telecom and IT
- 8.2.8. Government and Public Sector
- 8.2.9. Other En
- 8.1. Market Analysis, Insights and Forecast - by Type
- 9. Middle East & Africa SEA Digital Transformation Market Analysis, Insights and Forecast, 2019-2031
- 9.1. Market Analysis, Insights and Forecast - by Type
- 9.1.1. Analytic
- 9.1.1.1. Current
- 9.1.1.2. Key Grow
- 9.1.1.3. Use Case Analysis
- 9.1.1.4. Market Outlook
- 9.1.2. Extended Reality (XR)
- 9.1.3. IoT
- 9.1.4. Industrial Robotics
- 9.1.5. Blockchain
- 9.1.6. Additive Manufacturing/3D Printing
- 9.1.7. Cybersecurity
- 9.1.8. Cloud and Edge Computing
- 9.1.9. Others (Digital Twin, Mobility, and Connectivity)
- 9.1.9.1. Market B
- 9.1.1. Analytic
- 9.2. Market Analysis, Insights and Forecast - by End-user Industry
- 9.2.1. Manufacturing
- 9.2.2. Oil, Gas, and Utilities
- 9.2.3. Retail & e-commerce
- 9.2.4. Transportation and Logistics
- 9.2.5. Healthcare
- 9.2.6. BFSI
- 9.2.7. Telecom and IT
- 9.2.8. Government and Public Sector
- 9.2.9. Other En
- 9.1. Market Analysis, Insights and Forecast - by Type
- 10. Asia Pacific SEA Digital Transformation Market Analysis, Insights and Forecast, 2019-2031
- 10.1. Market Analysis, Insights and Forecast - by Type
- 10.1.1. Analytic
- 10.1.1.1. Current
- 10.1.1.2. Key Grow
- 10.1.1.3. Use Case Analysis
- 10.1.1.4. Market Outlook
- 10.1.2. Extended Reality (XR)
- 10.1.3. IoT
- 10.1.4. Industrial Robotics
- 10.1.5. Blockchain
- 10.1.6. Additive Manufacturing/3D Printing
- 10.1.7. Cybersecurity
- 10.1.8. Cloud and Edge Computing
- 10.1.9. Others (Digital Twin, Mobility, and Connectivity)
- 10.1.9.1. Market B
- 10.1.1. Analytic
- 10.2. Market Analysis, Insights and Forecast - by End-user Industry
- 10.2.1. Manufacturing
- 10.2.2. Oil, Gas, and Utilities
- 10.2.3. Retail & e-commerce
- 10.2.4. Transportation and Logistics
- 10.2.5. Healthcare
- 10.2.6. BFSI
- 10.2.7. Telecom and IT
- 10.2.8. Government and Public Sector
- 10.2.9. Other En
- 10.1. Market Analysis, Insights and Forecast - by Type
- 11. Competitive Analysis
- 11.1. Global Market Share Analysis 2024
- 11.2. Company Profiles
- 11.2.1 Accenture PLC
- 11.2.1.1. Overview
- 11.2.1.2. Products
- 11.2.1.3. SWOT Analysis
- 11.2.1.4. Recent Developments
- 11.2.1.5. Financials (Based on Availability)
- 11.2.2 Google LLC (Alphabet Inc )
- 11.2.2.1. Overview
- 11.2.2.2. Products
- 11.2.2.3. SWOT Analysis
- 11.2.2.4. Recent Developments
- 11.2.2.5. Financials (Based on Availability)
- 11.2.3 Siemens AG
- 11.2.3.1. Overview
- 11.2.3.2. Products
- 11.2.3.3. SWOT Analysis
- 11.2.3.4. Recent Developments
- 11.2.3.5. Financials (Based on Availability)
- 11.2.4 IBM Corporation
- 11.2.4.1. Overview
- 11.2.4.2. Products
- 11.2.4.3. SWOT Analysis
- 11.2.4.4. Recent Developments
- 11.2.4.5. Financials (Based on Availability)
- 11.2.5 Microsoft Corporation
- 11.2.5.1. Overview
- 11.2.5.2. Products
- 11.2.5.3. SWOT Analysis
- 11.2.5.4. Recent Developments
- 11.2.5.5. Financials (Based on Availability)
- 11.2.6 Cognex Corporation
- 11.2.6.1. Overview
- 11.2.6.2. Products
- 11.2.6.3. SWOT Analysis
- 11.2.6.4. Recent Developments
- 11.2.6.5. Financials (Based on Availability)
- 11.2.7 Hewlett Packard Enterprise
- 11.2.7.1. Overview
- 11.2.7.2. Products
- 11.2.7.3. SWOT Analysis
- 11.2.7.4. Recent Developments
- 11.2.7.5. Financials (Based on Availability)
- 11.2.8 SAP SE
- 11.2.8.1. Overview
- 11.2.8.2. Products
- 11.2.8.3. SWOT Analysis
- 11.2.8.4. Recent Developments
- 11.2.8.5. Financials (Based on Availability)
- 11.2.9 EMC Corporation (Dell EMC)
- 11.2.9.1. Overview
- 11.2.9.2. Products
- 11.2.9.3. SWOT Analysis
- 11.2.9.4. Recent Developments
- 11.2.9.5. Financials (Based on Availability)
- 11.2.10 Oracle Corporation
- 11.2.10.1. Overview
- 11.2.10.2. Products
- 11.2.10.3. SWOT Analysis
- 11.2.10.4. Recent Developments
- 11.2.10.5. Financials (Based on Availability)
- 11.2.11 Adobe Inc
- 11.2.11.1. Overview
- 11.2.11.2. Products
- 11.2.11.3. SWOT Analysis
- 11.2.11.4. Recent Developments
- 11.2.11.5. Financials (Based on Availability)
- 11.2.12 Amazon Web Services Inc (Amazon com Inc )
- 11.2.12.1. Overview
- 11.2.12.2. Products
- 11.2.12.3. SWOT Analysis
- 11.2.12.4. Recent Developments
- 11.2.12.5. Financials (Based on Availability)
- 11.2.13 Apple Inc
- 11.2.13.1. Overview
- 11.2.13.2. Products
- 11.2.13.3. SWOT Analysis
- 11.2.13.4. Recent Developments
- 11.2.13.5. Financials (Based on Availability)
- 11.2.14 Salesforce com Inc
- 11.2.14.1. Overview
- 11.2.14.2. Products
- 11.2.14.3. SWOT Analysis
- 11.2.14.4. Recent Developments
- 11.2.14.5. Financials (Based on Availability)
- 11.2.15 Cisco Systems Inc
- 11.2.15.1. Overview
- 11.2.15.2. Products
- 11.2.15.3. SWOT Analysis
- 11.2.15.4. Recent Developments
- 11.2.15.5. Financials (Based on Availability)
- 11.2.1 Accenture PLC
List of Figures
- Figure 1: Global SEA Digital Transformation Market Revenue Breakdown (Million, %) by Region 2024 & 2032
- Figure 2: Global SEA Digital Transformation Market Volume Breakdown (Billion, %) by Region 2024 & 2032
- Figure 3: North America SEA Digital Transformation Market Revenue (Million), by Type 2024 & 2032
- Figure 4: North America SEA Digital Transformation Market Volume (Billion), by Type 2024 & 2032
- Figure 5: North America SEA Digital Transformation Market Revenue Share (%), by Type 2024 & 2032
- Figure 6: North America SEA Digital Transformation Market Volume Share (%), by Type 2024 & 2032
- Figure 7: North America SEA Digital Transformation Market Revenue (Million), by End-user Industry 2024 & 2032
- Figure 8: North America SEA Digital Transformation Market Volume (Billion), by End-user Industry 2024 & 2032
- Figure 9: North America SEA Digital Transformation Market Revenue Share (%), by End-user Industry 2024 & 2032
- Figure 10: North America SEA Digital Transformation Market Volume Share (%), by End-user Industry 2024 & 2032
- Figure 11: North America SEA Digital Transformation Market Revenue (Million), by Country 2024 & 2032
- Figure 12: North America SEA Digital Transformation Market Volume (Billion), by Country 2024 & 2032
- Figure 13: North America SEA Digital Transformation Market Revenue Share (%), by Country 2024 & 2032
- Figure 14: North America SEA Digital Transformation Market Volume Share (%), by Country 2024 & 2032
- Figure 15: South America SEA Digital Transformation Market Revenue (Million), by Type 2024 & 2032
- Figure 16: South America SEA Digital Transformation Market Volume (Billion), by Type 2024 & 2032
- Figure 17: South America SEA Digital Transformation Market Revenue Share (%), by Type 2024 & 2032
- Figure 18: South America SEA Digital Transformation Market Volume Share (%), by Type 2024 & 2032
- Figure 19: South America SEA Digital Transformation Market Revenue (Million), by End-user Industry 2024 & 2032
- Figure 20: South America SEA Digital Transformation Market Volume (Billion), by End-user Industry 2024 & 2032
- Figure 21: South America SEA Digital Transformation Market Revenue Share (%), by End-user Industry 2024 & 2032
- Figure 22: South America SEA Digital Transformation Market Volume Share (%), by End-user Industry 2024 & 2032
- Figure 23: South America SEA Digital Transformation Market Revenue (Million), by Country 2024 & 2032
- Figure 24: South America SEA Digital Transformation Market Volume (Billion), by Country 2024 & 2032
- Figure 25: South America SEA Digital Transformation Market Revenue Share (%), by Country 2024 & 2032
- Figure 26: South America SEA Digital Transformation Market Volume Share (%), by Country 2024 & 2032
- Figure 27: Europe SEA Digital Transformation Market Revenue (Million), by Type 2024 & 2032
- Figure 28: Europe SEA Digital Transformation Market Volume (Billion), by Type 2024 & 2032
- Figure 29: Europe SEA Digital Transformation Market Revenue Share (%), by Type 2024 & 2032
- Figure 30: Europe SEA Digital Transformation Market Volume Share (%), by Type 2024 & 2032
- Figure 31: Europe SEA Digital Transformation Market Revenue (Million), by End-user Industry 2024 & 2032
- Figure 32: Europe SEA Digital Transformation Market Volume (Billion), by End-user Industry 2024 & 2032
- Figure 33: Europe SEA Digital Transformation Market Revenue Share (%), by End-user Industry 2024 & 2032
- Figure 34: Europe SEA Digital Transformation Market Volume Share (%), by End-user Industry 2024 & 2032
- Figure 35: Europe SEA Digital Transformation Market Revenue (Million), by Country 2024 & 2032
- Figure 36: Europe SEA Digital Transformation Market Volume (Billion), by Country 2024 & 2032
- Figure 37: Europe SEA Digital Transformation Market Revenue Share (%), by Country 2024 & 2032
- Figure 38: Europe SEA Digital Transformation Market Volume Share (%), by Country 2024 & 2032
- Figure 39: Middle East & Africa SEA Digital Transformation Market Revenue (Million), by Type 2024 & 2032
- Figure 40: Middle East & Africa SEA Digital Transformation Market Volume (Billion), by Type 2024 & 2032
- Figure 41: Middle East & Africa SEA Digital Transformation Market Revenue Share (%), by Type 2024 & 2032
- Figure 42: Middle East & Africa SEA Digital Transformation Market Volume Share (%), by Type 2024 & 2032
- Figure 43: Middle East & Africa SEA Digital Transformation Market Revenue (Million), by End-user Industry 2024 & 2032
- Figure 44: Middle East & Africa SEA Digital Transformation Market Volume (Billion), by End-user Industry 2024 & 2032
- Figure 45: Middle East & Africa SEA Digital Transformation Market Revenue Share (%), by End-user Industry 2024 & 2032
- Figure 46: Middle East & Africa SEA Digital Transformation Market Volume Share (%), by End-user Industry 2024 & 2032
- Figure 47: Middle East & Africa SEA Digital Transformation Market Revenue (Million), by Country 2024 & 2032
- Figure 48: Middle East & Africa SEA Digital Transformation Market Volume (Billion), by Country 2024 & 2032
- Figure 49: Middle East & Africa SEA Digital Transformation Market Revenue Share (%), by Country 2024 & 2032
- Figure 50: Middle East & Africa SEA Digital Transformation Market Volume Share (%), by Country 2024 & 2032
- Figure 51: Asia Pacific SEA Digital Transformation Market Revenue (Million), by Type 2024 & 2032
- Figure 52: Asia Pacific SEA Digital Transformation Market Volume (Billion), by Type 2024 & 2032
- Figure 53: Asia Pacific SEA Digital Transformation Market Revenue Share (%), by Type 2024 & 2032
- Figure 54: Asia Pacific SEA Digital Transformation Market Volume Share (%), by Type 2024 & 2032
- Figure 55: Asia Pacific SEA Digital Transformation Market Revenue (Million), by End-user Industry 2024 & 2032
- Figure 56: Asia Pacific SEA Digital Transformation Market Volume (Billion), by End-user Industry 2024 & 2032
- Figure 57: Asia Pacific SEA Digital Transformation Market Revenue Share (%), by End-user Industry 2024 & 2032
- Figure 58: Asia Pacific SEA Digital Transformation Market Volume Share (%), by End-user Industry 2024 & 2032
- Figure 59: Asia Pacific SEA Digital Transformation Market Revenue (Million), by Country 2024 & 2032
- Figure 60: Asia Pacific SEA Digital Transformation Market Volume (Billion), by Country 2024 & 2032
- Figure 61: Asia Pacific SEA Digital Transformation Market Revenue Share (%), by Country 2024 & 2032
- Figure 62: Asia Pacific SEA Digital Transformation Market Volume Share (%), by Country 2024 & 2032
List of Tables
- Table 1: Global SEA Digital Transformation Market Revenue Million Forecast, by Region 2019 & 2032
- Table 2: Global SEA Digital Transformation Market Volume Billion Forecast, by Region 2019 & 2032
- Table 3: Global SEA Digital Transformation Market Revenue Million Forecast, by Type 2019 & 2032
- Table 4: Global SEA Digital Transformation Market Volume Billion Forecast, by Type 2019 & 2032
- Table 5: Global SEA Digital Transformation Market Revenue Million Forecast, by End-user Industry 2019 & 2032
- Table 6: Global SEA Digital Transformation Market Volume Billion Forecast, by End-user Industry 2019 & 2032
- Table 7: Global SEA Digital Transformation Market Revenue Million Forecast, by Region 2019 & 2032
- Table 8: Global SEA Digital Transformation Market Volume Billion Forecast, by Region 2019 & 2032
- Table 9: Global SEA Digital Transformation Market Revenue Million Forecast, by Type 2019 & 2032
- Table 10: Global SEA Digital Transformation Market Volume Billion Forecast, by Type 2019 & 2032
- Table 11: Global SEA Digital Transformation Market Revenue Million Forecast, by End-user Industry 2019 & 2032
- Table 12: Global SEA Digital Transformation Market Volume Billion Forecast, by End-user Industry 2019 & 2032
- Table 13: Global SEA Digital Transformation Market Revenue Million Forecast, by Country 2019 & 2032
- Table 14: Global SEA Digital Transformation Market Volume Billion Forecast, by Country 2019 & 2032
- Table 15: United States SEA Digital Transformation Market Revenue (Million) Forecast, by Application 2019 & 2032
- Table 16: United States SEA Digital Transformation Market Volume (Billion) Forecast, by Application 2019 & 2032
- Table 17: Canada SEA Digital Transformation Market Revenue (Million) Forecast, by Application 2019 & 2032
- Table 18: Canada SEA Digital Transformation Market Volume (Billion) Forecast, by Application 2019 & 2032
- Table 19: Mexico SEA Digital Transformation Market Revenue (Million) Forecast, by Application 2019 & 2032
- Table 20: Mexico SEA Digital Transformation Market Volume (Billion) Forecast, by Application 2019 & 2032
- Table 21: Global SEA Digital Transformation Market Revenue Million Forecast, by Type 2019 & 2032
- Table 22: Global SEA Digital Transformation Market Volume Billion Forecast, by Type 2019 & 2032
- Table 23: Global SEA Digital Transformation Market Revenue Million Forecast, by End-user Industry 2019 & 2032
- Table 24: Global SEA Digital Transformation Market Volume Billion Forecast, by End-user Industry 2019 & 2032
- Table 25: Global SEA Digital Transformation Market Revenue Million Forecast, by Country 2019 & 2032
- Table 26: Global SEA Digital Transformation Market Volume Billion Forecast, by Country 2019 & 2032
- Table 27: Brazil SEA Digital Transformation Market Revenue (Million) Forecast, by Application 2019 & 2032
- Table 28: Brazil SEA Digital Transformation Market Volume (Billion) Forecast, by Application 2019 & 2032
- Table 29: Argentina SEA Digital Transformation Market Revenue (Million) Forecast, by Application 2019 & 2032
- Table 30: Argentina SEA Digital Transformation Market Volume (Billion) Forecast, by Application 2019 & 2032
- Table 31: Rest of South America SEA Digital Transformation Market Revenue (Million) Forecast, by Application 2019 & 2032
- Table 32: Rest of South America SEA Digital Transformation Market Volume (Billion) Forecast, by Application 2019 & 2032
- Table 33: Global SEA Digital Transformation Market Revenue Million Forecast, by Type 2019 & 2032
- Table 34: Global SEA Digital Transformation Market Volume Billion Forecast, by Type 2019 & 2032
- Table 35: Global SEA Digital Transformation Market Revenue Million Forecast, by End-user Industry 2019 & 2032
- Table 36: Global SEA Digital Transformation Market Volume Billion Forecast, by End-user Industry 2019 & 2032
- Table 37: Global SEA Digital Transformation Market Revenue Million Forecast, by Country 2019 & 2032
- Table 38: Global SEA Digital Transformation Market Volume Billion Forecast, by Country 2019 & 2032
- Table 39: United Kingdom SEA Digital Transformation Market Revenue (Million) Forecast, by Application 2019 & 2032
- Table 40: United Kingdom SEA Digital Transformation Market Volume (Billion) Forecast, by Application 2019 & 2032
- Table 41: Germany SEA Digital Transformation Market Revenue (Million) Forecast, by Application 2019 & 2032
- Table 42: Germany SEA Digital Transformation Market Volume (Billion) Forecast, by Application 2019 & 2032
- Table 43: France SEA Digital Transformation Market Revenue (Million) Forecast, by Application 2019 & 2032
- Table 44: France SEA Digital Transformation Market Volume (Billion) Forecast, by Application 2019 & 2032
- Table 45: Italy SEA Digital Transformation Market Revenue (Million) Forecast, by Application 2019 & 2032
- Table 46: Italy SEA Digital Transformation Market Volume (Billion) Forecast, by Application 2019 & 2032
- Table 47: Spain SEA Digital Transformation Market Revenue (Million) Forecast, by Application 2019 & 2032
- Table 48: Spain SEA Digital Transformation Market Volume (Billion) Forecast, by Application 2019 & 2032
- Table 49: Russia SEA Digital Transformation Market Revenue (Million) Forecast, by Application 2019 & 2032
- Table 50: Russia SEA Digital Transformation Market Volume (Billion) Forecast, by Application 2019 & 2032
- Table 51: Benelux SEA Digital Transformation Market Revenue (Million) Forecast, by Application 2019 & 2032
- Table 52: Benelux SEA Digital Transformation Market Volume (Billion) Forecast, by Application 2019 & 2032
- Table 53: Nordics SEA Digital Transformation Market Revenue (Million) Forecast, by Application 2019 & 2032
- Table 54: Nordics SEA Digital Transformation Market Volume (Billion) Forecast, by Application 2019 & 2032
- Table 55: Rest of Europe SEA Digital Transformation Market Revenue (Million) Forecast, by Application 2019 & 2032
- Table 56: Rest of Europe SEA Digital Transformation Market Volume (Billion) Forecast, by Application 2019 & 2032
- Table 57: Global SEA Digital Transformation Market Revenue Million Forecast, by Type 2019 & 2032
- Table 58: Global SEA Digital Transformation Market Volume Billion Forecast, by Type 2019 & 2032
- Table 59: Global SEA Digital Transformation Market Revenue Million Forecast, by End-user Industry 2019 & 2032
- Table 60: Global SEA Digital Transformation Market Volume Billion Forecast, by End-user Industry 2019 & 2032
- Table 61: Global SEA Digital Transformation Market Revenue Million Forecast, by Country 2019 & 2032
- Table 62: Global SEA Digital Transformation Market Volume Billion Forecast, by Country 2019 & 2032
- Table 63: Turkey SEA Digital Transformation Market Revenue (Million) Forecast, by Application 2019 & 2032
- Table 64: Turkey SEA Digital Transformation Market Volume (Billion) Forecast, by Application 2019 & 2032
- Table 65: Israel SEA Digital Transformation Market Revenue (Million) Forecast, by Application 2019 & 2032
- Table 66: Israel SEA Digital Transformation Market Volume (Billion) Forecast, by Application 2019 & 2032
- Table 67: GCC SEA Digital Transformation Market Revenue (Million) Forecast, by Application 2019 & 2032
- Table 68: GCC SEA Digital Transformation Market Volume (Billion) Forecast, by Application 2019 & 2032
- Table 69: North Africa SEA Digital Transformation Market Revenue (Million) Forecast, by Application 2019 & 2032
- Table 70: North Africa SEA Digital Transformation Market Volume (Billion) Forecast, by Application 2019 & 2032
- Table 71: South Africa SEA Digital Transformation Market Revenue (Million) Forecast, by Application 2019 & 2032
- Table 72: South Africa SEA Digital Transformation Market Volume (Billion) Forecast, by Application 2019 & 2032
- Table 73: Rest of Middle East & Africa SEA Digital Transformation Market Revenue (Million) Forecast, by Application 2019 & 2032
- Table 74: Rest of Middle East & Africa SEA Digital Transformation Market Volume (Billion) Forecast, by Application 2019 & 2032
- Table 75: Global SEA Digital Transformation Market Revenue Million Forecast, by Type 2019 & 2032
- Table 76: Global SEA Digital Transformation Market Volume Billion Forecast, by Type 2019 & 2032
- Table 77: Global SEA Digital Transformation Market Revenue Million Forecast, by End-user Industry 2019 & 2032
- Table 78: Global SEA Digital Transformation Market Volume Billion Forecast, by End-user Industry 2019 & 2032
- Table 79: Global SEA Digital Transformation Market Revenue Million Forecast, by Country 2019 & 2032
- Table 80: Global SEA Digital Transformation Market Volume Billion Forecast, by Country 2019 & 2032
- Table 81: China SEA Digital Transformation Market Revenue (Million) Forecast, by Application 2019 & 2032
- Table 82: China SEA Digital Transformation Market Volume (Billion) Forecast, by Application 2019 & 2032
- Table 83: India SEA Digital Transformation Market Revenue (Million) Forecast, by Application 2019 & 2032
- Table 84: India SEA Digital Transformation Market Volume (Billion) Forecast, by Application 2019 & 2032
- Table 85: Japan SEA Digital Transformation Market Revenue (Million) Forecast, by Application 2019 & 2032
- Table 86: Japan SEA Digital Transformation Market Volume (Billion) Forecast, by Application 2019 & 2032
- Table 87: South Korea SEA Digital Transformation Market Revenue (Million) Forecast, by Application 2019 & 2032
- Table 88: South Korea SEA Digital Transformation Market Volume (Billion) Forecast, by Application 2019 & 2032
- Table 89: ASEAN SEA Digital Transformation Market Revenue (Million) Forecast, by Application 2019 & 2032
- Table 90: ASEAN SEA Digital Transformation Market Volume (Billion) Forecast, by Application 2019 & 2032
- Table 91: Oceania SEA Digital Transformation Market Revenue (Million) Forecast, by Application 2019 & 2032
- Table 92: Oceania SEA Digital Transformation Market Volume (Billion) Forecast, by Application 2019 & 2032
- Table 93: Rest of Asia Pacific SEA Digital Transformation Market Revenue (Million) Forecast, by Application 2019 & 2032
- Table 94: Rest of Asia Pacific SEA Digital Transformation Market Volume (Billion) Forecast, by Application 2019 & 2032
Frequently Asked Questions
1. What is the projected Compound Annual Growth Rate (CAGR) of the SEA Digital Transformation Market?
The projected CAGR is approximately 19.51%.
2. Which companies are prominent players in the SEA Digital Transformation Market?
Key companies in the market include Accenture PLC, Google LLC (Alphabet Inc ), Siemens AG, IBM Corporation, Microsoft Corporation, Cognex Corporation, Hewlett Packard Enterprise, SAP SE, EMC Corporation (Dell EMC), Oracle Corporation, Adobe Inc, Amazon Web Services Inc (Amazon com Inc ), Apple Inc, Salesforce com Inc, Cisco Systems Inc.
3. What are the main segments of the SEA Digital Transformation Market?
The market segments include Type, End-user Industry.
4. Can you provide details about the market size?
The market size is estimated to be USD 53.96 Million as of 2022.
5. What are some drivers contributing to market growth?
Increase in the Adoption of Big Data Analytics and Other Technologies to Drive the Market; The Rapid Proliferation of Mobile Devices and Apps.
6. What are the notable trends driving market growth?
Increase in the Adoption of Big Data Analytics and Other Technologies to Drive the Market.
7. Are there any restraints impacting market growth?
Increase in the Adoption of Big Data Analytics and Other Technologies to Drive the Market; The Rapid Proliferation of Mobile Devices and Apps.
8. Can you provide examples of recent developments in the market?
July 2024: The Monetary Authority of Singapore (MAS) has pledged an extra SGD 100 million (USD 134.3 million) to bolster financial institutions' expertise in quantum and artificial intelligence (AI) technologies. This funding, part of the Financial Sector Technology and Innovation Grant Scheme (FTSI 3.0), will specifically cover both manpower expenses and technology solutions in these cutting-edge fields. MAS anticipates that this injection will enhance innovation in quantum and AI within the financial sector and accelerate their adoption.
9. What pricing options are available for accessing the report?
Pricing options include single-user, multi-user, and enterprise licenses priced at USD 3800, USD 4500, and USD 5800 respectively.
10. Is the market size provided in terms of value or volume?
The market size is provided in terms of value, measured in Million and volume, measured in Billion.
11. Are there any specific market keywords associated with the report?
Yes, the market keyword associated with the report is "SEA Digital Transformation Market," which aids in identifying and referencing the specific market segment covered.
12. How do I determine which pricing option suits my needs best?
The pricing options vary based on user requirements and access needs. Individual users may opt for single-user licenses, while businesses requiring broader access may choose multi-user or enterprise licenses for cost-effective access to the report.
13. Are there any additional resources or data provided in the SEA Digital Transformation Market report?
While the report offers comprehensive insights, it's advisable to review the specific contents or supplementary materials provided to ascertain if additional resources or data are available.
14. How can I stay updated on further developments or reports in the SEA Digital Transformation Market?
To stay informed about further developments, trends, and reports in the SEA Digital Transformation Market, consider subscribing to industry newsletters, following relevant companies and organizations, or regularly checking reputable industry news sources and publications.
Methodology
Step 1 - Identification of Relevant Samples Size from Population Database


Step 2 - Approaches for Defining Global Market Size (Value, Volume* & Price*)

Note*: In applicable scenarios
Step 3 - Data Sources
Primary Research
- Web Analytics
- Survey Reports
- Research Institute
- Latest Research Reports
- Opinion Leaders
Secondary Research
- Annual Reports
- White Paper
- Latest Press Release
- Industry Association
- Paid Database
- Investor Presentations

Step 4 - Data Triangulation
Involves using different sources of information in order to increase the validity of a study
These sources are likely to be stakeholders in a program - participants, other researchers, program staff, other community members, and so on.
Then we put all data in single framework & apply various statistical tools to find out the dynamic on the market.
During the analysis stage, feedback from the stakeholder groups would be compared to determine areas of agreement as well as areas of divergence
