


Key Insights
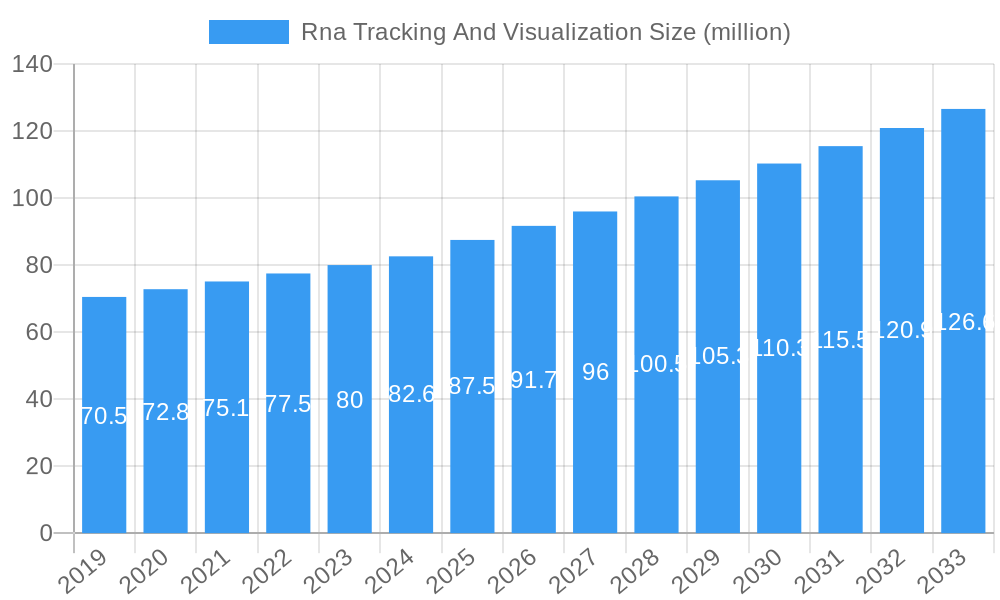
The global RNA Tracking and Visualization market is poised for robust expansion, projected to reach an estimated \$87.5 million by 2025, with a Compound Annual Growth Rate (CAGR) of 4.9% anticipated through 2033. This growth is significantly driven by the escalating demand for advanced tools in basic biological research, enabling scientists to unravel complex cellular processes and gene expression dynamics with unprecedented precision. The increasing understanding of RNA's multifaceted roles in cellular function and disease pathogenesis is fueling a surge in research activities, necessitating sophisticated techniques for real-time monitoring and visualization of RNA molecules. Furthermore, the critical role of RNA analysis in disease diagnosis and treatment development, particularly in oncology, infectious diseases, and genetic disorders, is a key accelerator for market expansion. As personalized medicine gains traction, the ability to track and visualize RNA profiles offers vital insights for identifying biomarkers, developing targeted therapies, and monitoring treatment efficacy. Emerging applications beyond core research and diagnostics, though currently smaller in scope, also contribute to the market's diversification and future potential.
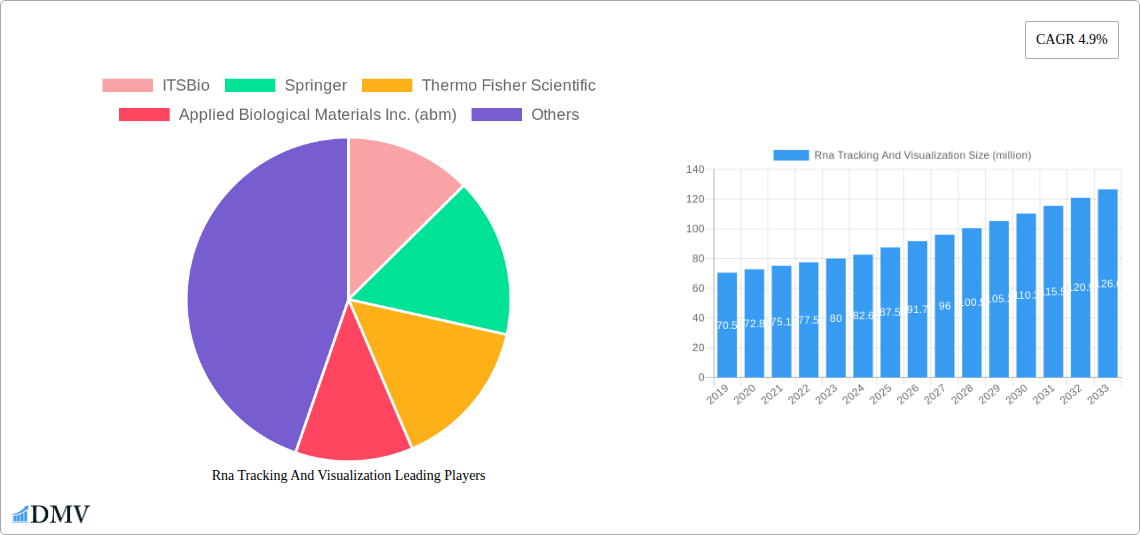
Rna Tracking And Visualization Market Size (In Million)

The market is characterized by the dominance of innovative technologies like the MS2/MCP System and Fluorescence In Situ Hybridization (FISH), which offer high specificity and sensitivity for RNA detection and localization. These techniques are continuously being refined to improve resolution, enable multiplexing, and facilitate live-cell imaging, thereby expanding their utility across various research and clinical settings. Geographically, Asia Pacific is expected to emerge as a significant growth engine, fueled by increasing government investments in life sciences research, a burgeoning biotechnology sector in countries like China and India, and a growing number of research institutions adopting advanced RNA visualization tools. North America and Europe, with their well-established research infrastructure and high adoption rates of cutting-edge technologies, will continue to be major contributors to the global market. While the market benefits from strong growth drivers, challenges such as the high cost of some advanced visualization equipment and the need for specialized expertise in operating these sophisticated systems could temper rapid adoption in certain segments and regions.
Rna Tracking And Visualization Company Market Share
This in-depth report provides an authoritative analysis of the global RNA tracking and visualization market, offering critical insights into its composition, trends, evolution, and future trajectory. Spanning the historical period from 2019 to 2024, with a base year of 2025 and a comprehensive forecast extending to 2033, this study empowers stakeholders with actionable intelligence for strategic decision-making. We delve into the intricate dynamics shaping this rapidly evolving sector, from fundamental biological research applications to advanced disease diagnosis and treatment, and explore the innovative technologies driving its expansion.
RNA Tracking and Visualization Market Composition & Trends
The RNA tracking and visualization market is characterized by a moderate concentration, with a significant portion of the market share held by key players. Innovation remains a primary catalyst, driven by continuous advancements in microscopy, molecular probes, and bioinformatics. Regulatory landscapes, particularly concerning research reagents and diagnostic tools, play a crucial role in market access and product development. The threat of substitute products, while present in some niche areas, is generally limited due to the specificity and sensitivity offered by RNA tracking and visualization techniques. End-user profiles range from academic research institutions and pharmaceutical companies to diagnostic laboratories and biotechnology firms. Mergers and acquisitions (M&A) activities are strategically important for market consolidation and expansion, with an estimated M&A deal value of USD XXX million recorded during the historical period.
- Market Share Distribution: Leading companies like ITSBio and Thermo Fisher Scientific hold substantial market presence.
- Innovation Catalysts: Development of novel fluorescent probes and high-resolution imaging techniques.
- Regulatory Landscapes: Stringent approval processes for diagnostic applications.
- Substitute Products: Limited impact due to the unique capabilities of RNA tracking.
- End-User Profiles: Academic researchers, pharmaceutical developers, and clinical diagnosticians.
- M&A Activities: Strategic acquisitions to enhance product portfolios and market reach, with an estimated value of USD XXX million in the historical period.
RNA Tracking and Visualization Industry Evolution
The RNA tracking and visualization industry has witnessed remarkable evolution, driven by a confluence of scientific breakthroughs and increasing demand for molecular-level insights. From 2019 to 2024, the market experienced a Compound Annual Growth Rate (CAGR) of approximately XX%, fueled by a growing understanding of the critical role of RNA in cellular processes and disease pathogenesis. Technological advancements have been pivotal, with the refinement of techniques such as Fluorescence In Situ Hybridization (FISH) and the development of novel systems like MS2/MCP, significantly enhancing spatial and temporal resolution of RNA dynamics. The adoption of single-cell RNA sequencing and live-cell RNA imaging has democratized access to complex biological information, accelerating research across a multitude of disciplines. Shifting consumer demands, particularly from the biopharmaceutical sector for more precise drug target identification and validation, have further propelled market expansion. The base year of 2025 is expected to see continued robust growth, with a projected CAGR of XX% through 2033. This growth is underpinned by ongoing investments in genomics and transcriptomics research, a rising prevalence of chronic diseases requiring advanced diagnostic tools, and the increasing application of RNA-based therapeutics. The market is transitioning from primarily research-oriented applications to more clinically relevant diagnostics and therapeutic monitoring. The advent of AI-powered image analysis and sophisticated data interpretation tools is also transforming how RNA data is utilized, making it more accessible and actionable for a broader scientific community. The increasing emphasis on personalized medicine and precision oncology is creating a sustained demand for highly specific and sensitive RNA tracking and visualization methods.
Leading Regions, Countries, or Segments in RNA Tracking and Visualization
North America currently stands as the dominant region in the RNA tracking and visualization market, driven by substantial government and private sector investment in life sciences research and development, a robust presence of leading biotechnology and pharmaceutical companies, and a highly skilled scientific workforce. The region's commitment to innovation, coupled with a strong regulatory framework that supports the development and commercialization of advanced diagnostic and research tools, further solidifies its leadership. Within North America, the United States accounts for a significant majority of the market share, propelled by major research hubs and a high volume of clinical trials.
- Dominant Application: Basic Biological Research: This segment remains the largest contributor due to the fundamental need for understanding gene expression, cellular function, and developmental processes. Researchers globally rely on RNA tracking and visualization to unravel complex biological mechanisms.
- Key Driver for Basic Biological Research: Extensive funding for academic research, grants for genomics and transcriptomics studies, and the continuous pursuit of novel scientific discoveries.
- Emerging Application: Disease Diagnosis and Treatment: This segment is experiencing rapid growth. The ability to visualize RNA in diseased tissues or cells is crucial for identifying biomarkers, understanding disease progression, and monitoring therapeutic responses.
- Key Driver for Disease Diagnosis and Treatment: Increasing prevalence of chronic diseases, demand for personalized medicine, and the development of RNA-based diagnostics and therapeutics.
- Dominant Type: Fluorescence In Situ Hybridization (FISH): FISH remains a cornerstone technology due to its specificity, sensitivity, and ability to visualize RNA within its native cellular context. Its versatility in detecting various RNA species and its adaptability to different imaging platforms contribute to its widespread adoption.
- Key Driver for FISH: High resolution, specific target identification, and established protocols enabling broad application.
- Advancements in Type: MS2/MCP System: The MS2/MCP system, while newer, is gaining traction for its ability to provide real-time tracking of RNA localization and dynamics within living cells. This represents a significant technological leap for dynamic RNA studies.
- Key Driver for MS2/MCP System: Live-cell imaging capabilities, dynamic tracking of RNA, and applications in studying RNA transport and fate.
- Other Applications: While smaller, "Other" applications encompass areas like agricultural research and industrial biotechnology, indicating the expanding utility of RNA visualization techniques.
RNA Tracking and Visualization Product Innovations
Recent product innovations in RNA tracking and visualization are transforming research capabilities. Companies are introducing ultra-sensitive fluorescent probes with enhanced photostability, enabling longer observation periods and deeper cellular penetration. Advancements in microscopy hardware, including super-resolution imaging systems and integrated single-molecule detection, are pushing the boundaries of spatial and temporal resolution. Furthermore, the development of multiplexed RNA detection platforms allows for the simultaneous visualization of multiple RNA species, providing a more comprehensive understanding of cellular transcriptomes. The integration of AI-powered analysis software streamlines data interpretation, accelerating discovery and increasing throughput. These innovations collectively offer researchers unprecedented tools to investigate RNA's dynamic roles in health and disease.
Propelling Factors for RNA Tracking and Visualization Growth
Several key factors are propelling the growth of the RNA tracking and visualization market. Technological advancements, including the development of novel fluorescent probes, higher resolution imaging techniques, and sophisticated bioinformatics tools, are significantly enhancing the capabilities and accessibility of RNA analysis. The increasing global prevalence of chronic diseases, such as cancer and neurodegenerative disorders, is driving demand for precise diagnostic and therapeutic monitoring solutions, where RNA visualization plays a crucial role. Furthermore, substantial investments in genomics and transcriptomics research from both government agencies and private enterprises are creating a fertile ground for innovation and adoption. The growing emphasis on personalized medicine and the development of RNA-based therapeutics are also significant growth catalysts.
Obstacles in the RNA Tracking and Visualization Market
Despite robust growth, the RNA tracking and visualization market faces several obstacles. High costs associated with advanced imaging equipment and specialized reagents can be a significant barrier for smaller research institutions and emerging markets. Stringent regulatory approval processes for diagnostic applications, particularly in regions with evolving healthcare policies, can slow down market penetration. Furthermore, the complexity of data analysis and the need for specialized expertise to interpret results can limit broader adoption. Supply chain disruptions for critical reagents and consumables, as experienced in recent global events, can also impact market stability. Finally, intense competition among established players and emerging startups necessitates continuous innovation and competitive pricing strategies.
Future Opportunities in RNA Tracking and Visualization
The RNA tracking and visualization market is poised for significant future opportunities. The expansion of its applications into emerging fields like synthetic biology and agricultural biotechnology presents new avenues for growth. The ongoing development of more advanced, non-invasive in vivo RNA imaging techniques holds immense potential for preclinical and clinical applications. Furthermore, the increasing adoption of cloud-based platforms for data storage and analysis will democratize access to complex RNA datasets. The growing demand for rapid point-of-care diagnostics, where RNA detection could play a vital role, also represents a substantial opportunity for market expansion. The development of AI-driven predictive models that integrate RNA visualization data will further unlock new insights and applications.
Major Players in the RNA Tracking and Visualization Ecosystem
- ITSBio
- Springer
- Thermo Fisher Scientific
- Applied Biological Materials Inc. (abm)
Key Developments in RNA Tracking and Visualization Industry
- 2023 March: Thermo Fisher Scientific launched a new suite of reagents for single-cell RNA visualization, enhancing throughput for researchers.
- 2022 November: ITSBio announced a strategic partnership with a leading academic institution to co-develop novel FISH probes for neurodegenerative disease research.
- 2022 July: Applied Biological Materials Inc. (abm) expanded its portfolio with the introduction of a new range of CRISPR-based RNA tracking tools.
- 2021 October: Springer published a groundbreaking review detailing the latest advancements in live-cell RNA imaging techniques.
- 2020 April: A significant increase in demand for remote research solutions led to the accelerated development of cloud-based RNA data analysis platforms by various industry players.
Strategic RNA Tracking and Visualization Market Forecast
The strategic RNA tracking and visualization market forecast indicates sustained and robust growth driven by escalating demand in both research and clinical settings. The continuous influx of technological innovations, coupled with the broadening applications in personalized medicine and disease diagnostics, will act as powerful growth catalysts. Investments in genomic research, the rising incidence of complex diseases, and the therapeutic potential of RNA-based treatments are expected to fuel market expansion. Emerging markets, particularly in Asia-Pacific, present significant untapped potential. The market is projected to witness a significant CAGR of XX% from 2025 to 2033, reaching an estimated market size of USD XXX million by 2033.
Rna Tracking And Visualization Segmentation
-
1. Application
- 1.1. Basic Biological Research
- 1.2. Disease Diagnosis and Treatment
- 1.3. Others
-
2. Type
- 2.1. Fluorescence in Situ Hybridization (FISH)
- 2.2. MS2/MCP System
- 2.3. Other
Rna Tracking And Visualization Segmentation By Geography
-
1. North America
- 1.1. United States
- 1.2. Canada
- 1.3. Mexico
-
2. South America
- 2.1. Brazil
- 2.2. Argentina
- 2.3. Rest of South America
-
3. Europe
- 3.1. United Kingdom
- 3.2. Germany
- 3.3. France
- 3.4. Italy
- 3.5. Spain
- 3.6. Russia
- 3.7. Benelux
- 3.8. Nordics
- 3.9. Rest of Europe
-
4. Middle East & Africa
- 4.1. Turkey
- 4.2. Israel
- 4.3. GCC
- 4.4. North Africa
- 4.5. South Africa
- 4.6. Rest of Middle East & Africa
-
5. Asia Pacific
- 5.1. China
- 5.2. India
- 5.3. Japan
- 5.4. South Korea
- 5.5. ASEAN
- 5.6. Oceania
- 5.7. Rest of Asia Pacific
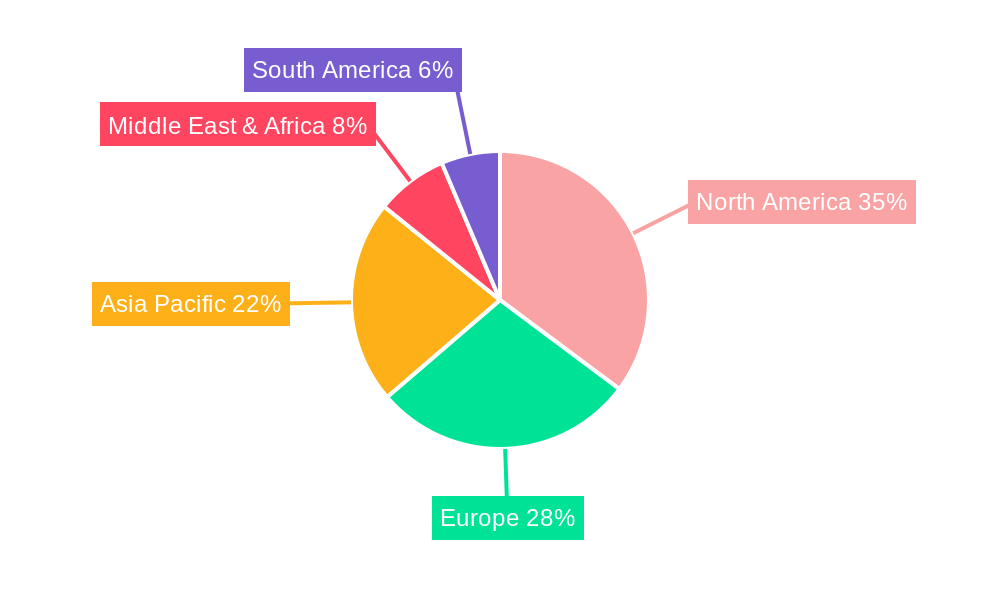
Rna Tracking And Visualization Regional Market Share
Geographic Coverage of Rna Tracking And Visualization
Rna Tracking And Visualization REPORT HIGHLIGHTS
| Aspects | Details |
|---|---|
| Study Period | 2020-2034 |
| Base Year | 2025 |
| Estimated Year | 2026 |
| Forecast Period | 2026-2034 |
| Historical Period | 2020-2025 |
| Growth Rate | CAGR of 4.9% from 2020-2034 |
| Segmentation |
|
Table of Contents
- 1. Introduction
- 1.1. Research Scope
- 1.2. Market Segmentation
- 1.3. Research Objective
- 1.4. Definitions and Assumptions
- 2. Executive Summary
- 2.1. Market Snapshot
- 3. Market Dynamics
- 3.1. Market Drivers
- 3.2. Market Restrains
- 3.3. Market Trends
- 3.4. Market Opportunities
- 4. Market Factor Analysis
- 4.1. Porters Five Forces
- 4.1.1. Bargaining Power of Suppliers
- 4.1.2. Bargaining Power of Buyers
- 4.1.3. Threat of New Entrants
- 4.1.4. Threat of Substitutes
- 4.1.5. Competitive Rivalry
- 4.2. PESTEL analysis
- 4.3. BCG Analysis
- 4.3.1. Stars (High Growth, High Market Share)
- 4.3.2. Cash Cows (Low Growth, High Market Share)
- 4.3.3. Question Mark (High Growth, Low Market Share)
- 4.3.4. Dogs (Low Growth, Low Market Share)
- 4.4. Ansoff Matrix Analysis
- 4.5. Supply Chain Analysis
- 4.6. Regulatory Landscape
- 4.7. Current Market Potential and Opportunity Assessment (TAM–SAM–SOM Framework)
- 4.8. DMV Analyst Note
- 4.1. Porters Five Forces
- 5. Market Analysis, Insights and Forecast 2021-2033
- 5.1. Market Analysis, Insights and Forecast - by Application
- 5.1.1. Basic Biological Research
- 5.1.2. Disease Diagnosis and Treatment
- 5.1.3. Others
- 5.2. Market Analysis, Insights and Forecast - by Type
- 5.2.1. Fluorescence in Situ Hybridization (FISH)
- 5.2.2. MS2/MCP System
- 5.2.3. Other
- 5.3. Market Analysis, Insights and Forecast - by Region
- 5.3.1. North America
- 5.3.2. South America
- 5.3.3. Europe
- 5.3.4. Middle East & Africa
- 5.3.5. Asia Pacific
- 5.1. Market Analysis, Insights and Forecast - by Application
- 6. Global Rna Tracking And Visualization Analysis, Insights and Forecast, 2021-2033
- 6.1. Market Analysis, Insights and Forecast - by Application
- 6.1.1. Basic Biological Research
- 6.1.2. Disease Diagnosis and Treatment
- 6.1.3. Others
- 6.2. Market Analysis, Insights and Forecast - by Type
- 6.2.1. Fluorescence in Situ Hybridization (FISH)
- 6.2.2. MS2/MCP System
- 6.2.3. Other
- 6.1. Market Analysis, Insights and Forecast - by Application
- 7. North America Rna Tracking And Visualization Analysis, Insights and Forecast, 2020-2032
- 7.1. Market Analysis, Insights and Forecast - by Application
- 7.1.1. Basic Biological Research
- 7.1.2. Disease Diagnosis and Treatment
- 7.1.3. Others
- 7.2. Market Analysis, Insights and Forecast - by Type
- 7.2.1. Fluorescence in Situ Hybridization (FISH)
- 7.2.2. MS2/MCP System
- 7.2.3. Other
- 7.1. Market Analysis, Insights and Forecast - by Application
- 8. South America Rna Tracking And Visualization Analysis, Insights and Forecast, 2020-2032
- 8.1. Market Analysis, Insights and Forecast - by Application
- 8.1.1. Basic Biological Research
- 8.1.2. Disease Diagnosis and Treatment
- 8.1.3. Others
- 8.2. Market Analysis, Insights and Forecast - by Type
- 8.2.1. Fluorescence in Situ Hybridization (FISH)
- 8.2.2. MS2/MCP System
- 8.2.3. Other
- 8.1. Market Analysis, Insights and Forecast - by Application
- 9. Europe Rna Tracking And Visualization Analysis, Insights and Forecast, 2020-2032
- 9.1. Market Analysis, Insights and Forecast - by Application
- 9.1.1. Basic Biological Research
- 9.1.2. Disease Diagnosis and Treatment
- 9.1.3. Others
- 9.2. Market Analysis, Insights and Forecast - by Type
- 9.2.1. Fluorescence in Situ Hybridization (FISH)
- 9.2.2. MS2/MCP System
- 9.2.3. Other
- 9.1. Market Analysis, Insights and Forecast - by Application
- 10. Middle East & Africa Rna Tracking And Visualization Analysis, Insights and Forecast, 2020-2032
- 10.1. Market Analysis, Insights and Forecast - by Application
- 10.1.1. Basic Biological Research
- 10.1.2. Disease Diagnosis and Treatment
- 10.1.3. Others
- 10.2. Market Analysis, Insights and Forecast - by Type
- 10.2.1. Fluorescence in Situ Hybridization (FISH)
- 10.2.2. MS2/MCP System
- 10.2.3. Other
- 10.1. Market Analysis, Insights and Forecast - by Application
- 11. Asia Pacific Rna Tracking And Visualization Analysis, Insights and Forecast, 2020-2032
- 11.1. Market Analysis, Insights and Forecast - by Application
- 11.1.1. Basic Biological Research
- 11.1.2. Disease Diagnosis and Treatment
- 11.1.3. Others
- 11.2. Market Analysis, Insights and Forecast - by Type
- 11.2.1. Fluorescence in Situ Hybridization (FISH)
- 11.2.2. MS2/MCP System
- 11.2.3. Other
- 11.1. Market Analysis, Insights and Forecast - by Application
- 12. Competitive Analysis
- 12.1. Company Profiles
- 12.1.1 ITSBio
- 12.1.1.1. Company Overview
- 12.1.1.2. Products
- 12.1.1.3. Company Financials
- 12.1.1.4. SWOT Analysis
- 12.1.2 Springer
- 12.1.2.1. Company Overview
- 12.1.2.2. Products
- 12.1.2.3. Company Financials
- 12.1.2.4. SWOT Analysis
- 12.1.3 Thermo Fisher Scientific
- 12.1.3.1. Company Overview
- 12.1.3.2. Products
- 12.1.3.3. Company Financials
- 12.1.3.4. SWOT Analysis
- 12.1.4 Applied Biological Materials Inc. (abm)
- 12.1.4.1. Company Overview
- 12.1.4.2. Products
- 12.1.4.3. Company Financials
- 12.1.4.4. SWOT Analysis
- 12.1.1 ITSBio
- 12.2. Market Entropy
- 12.2.1 Company's Key Areas Served
- 12.2.2 Recent Developments
- 12.3. Company Market Share Analysis 2025
- 12.3.1 Top 5 Companies Market Share Analysis
- 12.3.2 Top 3 Companies Market Share Analysis
- 12.4. List of Potential Customers
- 13. Research Methodology
List of Figures
- Figure 1: Global Rna Tracking And Visualization Revenue Breakdown (million, %) by Region 2025 & 2033
- Figure 2: North America Rna Tracking And Visualization Revenue (million), by Application 2025 & 2033
- Figure 3: North America Rna Tracking And Visualization Revenue Share (%), by Application 2025 & 2033
- Figure 4: North America Rna Tracking And Visualization Revenue (million), by Type 2025 & 2033
- Figure 5: North America Rna Tracking And Visualization Revenue Share (%), by Type 2025 & 2033
- Figure 6: North America Rna Tracking And Visualization Revenue (million), by Country 2025 & 2033
- Figure 7: North America Rna Tracking And Visualization Revenue Share (%), by Country 2025 & 2033
- Figure 8: South America Rna Tracking And Visualization Revenue (million), by Application 2025 & 2033
- Figure 9: South America Rna Tracking And Visualization Revenue Share (%), by Application 2025 & 2033
- Figure 10: South America Rna Tracking And Visualization Revenue (million), by Type 2025 & 2033
- Figure 11: South America Rna Tracking And Visualization Revenue Share (%), by Type 2025 & 2033
- Figure 12: South America Rna Tracking And Visualization Revenue (million), by Country 2025 & 2033
- Figure 13: South America Rna Tracking And Visualization Revenue Share (%), by Country 2025 & 2033
- Figure 14: Europe Rna Tracking And Visualization Revenue (million), by Application 2025 & 2033
- Figure 15: Europe Rna Tracking And Visualization Revenue Share (%), by Application 2025 & 2033
- Figure 16: Europe Rna Tracking And Visualization Revenue (million), by Type 2025 & 2033
- Figure 17: Europe Rna Tracking And Visualization Revenue Share (%), by Type 2025 & 2033
- Figure 18: Europe Rna Tracking And Visualization Revenue (million), by Country 2025 & 2033
- Figure 19: Europe Rna Tracking And Visualization Revenue Share (%), by Country 2025 & 2033
- Figure 20: Middle East & Africa Rna Tracking And Visualization Revenue (million), by Application 2025 & 2033
- Figure 21: Middle East & Africa Rna Tracking And Visualization Revenue Share (%), by Application 2025 & 2033
- Figure 22: Middle East & Africa Rna Tracking And Visualization Revenue (million), by Type 2025 & 2033
- Figure 23: Middle East & Africa Rna Tracking And Visualization Revenue Share (%), by Type 2025 & 2033
- Figure 24: Middle East & Africa Rna Tracking And Visualization Revenue (million), by Country 2025 & 2033
- Figure 25: Middle East & Africa Rna Tracking And Visualization Revenue Share (%), by Country 2025 & 2033
- Figure 26: Asia Pacific Rna Tracking And Visualization Revenue (million), by Application 2025 & 2033
- Figure 27: Asia Pacific Rna Tracking And Visualization Revenue Share (%), by Application 2025 & 2033
- Figure 28: Asia Pacific Rna Tracking And Visualization Revenue (million), by Type 2025 & 2033
- Figure 29: Asia Pacific Rna Tracking And Visualization Revenue Share (%), by Type 2025 & 2033
- Figure 30: Asia Pacific Rna Tracking And Visualization Revenue (million), by Country 2025 & 2033
- Figure 31: Asia Pacific Rna Tracking And Visualization Revenue Share (%), by Country 2025 & 2033
List of Tables
- Table 1: Global Rna Tracking And Visualization Revenue million Forecast, by Application 2020 & 2033
- Table 2: Global Rna Tracking And Visualization Revenue million Forecast, by Type 2020 & 2033
- Table 3: Global Rna Tracking And Visualization Revenue million Forecast, by Region 2020 & 2033
- Table 4: Global Rna Tracking And Visualization Revenue million Forecast, by Application 2020 & 2033
- Table 5: Global Rna Tracking And Visualization Revenue million Forecast, by Type 2020 & 2033
- Table 6: Global Rna Tracking And Visualization Revenue million Forecast, by Country 2020 & 2033
- Table 7: United States Rna Tracking And Visualization Revenue (million) Forecast, by Application 2020 & 2033
- Table 8: Canada Rna Tracking And Visualization Revenue (million) Forecast, by Application 2020 & 2033
- Table 9: Mexico Rna Tracking And Visualization Revenue (million) Forecast, by Application 2020 & 2033
- Table 10: Global Rna Tracking And Visualization Revenue million Forecast, by Application 2020 & 2033
- Table 11: Global Rna Tracking And Visualization Revenue million Forecast, by Type 2020 & 2033
- Table 12: Global Rna Tracking And Visualization Revenue million Forecast, by Country 2020 & 2033
- Table 13: Brazil Rna Tracking And Visualization Revenue (million) Forecast, by Application 2020 & 2033
- Table 14: Argentina Rna Tracking And Visualization Revenue (million) Forecast, by Application 2020 & 2033
- Table 15: Rest of South America Rna Tracking And Visualization Revenue (million) Forecast, by Application 2020 & 2033
- Table 16: Global Rna Tracking And Visualization Revenue million Forecast, by Application 2020 & 2033
- Table 17: Global Rna Tracking And Visualization Revenue million Forecast, by Type 2020 & 2033
- Table 18: Global Rna Tracking And Visualization Revenue million Forecast, by Country 2020 & 2033
- Table 19: United Kingdom Rna Tracking And Visualization Revenue (million) Forecast, by Application 2020 & 2033
- Table 20: Germany Rna Tracking And Visualization Revenue (million) Forecast, by Application 2020 & 2033
- Table 21: France Rna Tracking And Visualization Revenue (million) Forecast, by Application 2020 & 2033
- Table 22: Italy Rna Tracking And Visualization Revenue (million) Forecast, by Application 2020 & 2033
- Table 23: Spain Rna Tracking And Visualization Revenue (million) Forecast, by Application 2020 & 2033
- Table 24: Russia Rna Tracking And Visualization Revenue (million) Forecast, by Application 2020 & 2033
- Table 25: Benelux Rna Tracking And Visualization Revenue (million) Forecast, by Application 2020 & 2033
- Table 26: Nordics Rna Tracking And Visualization Revenue (million) Forecast, by Application 2020 & 2033
- Table 27: Rest of Europe Rna Tracking And Visualization Revenue (million) Forecast, by Application 2020 & 2033
- Table 28: Global Rna Tracking And Visualization Revenue million Forecast, by Application 2020 & 2033
- Table 29: Global Rna Tracking And Visualization Revenue million Forecast, by Type 2020 & 2033
- Table 30: Global Rna Tracking And Visualization Revenue million Forecast, by Country 2020 & 2033
- Table 31: Turkey Rna Tracking And Visualization Revenue (million) Forecast, by Application 2020 & 2033
- Table 32: Israel Rna Tracking And Visualization Revenue (million) Forecast, by Application 2020 & 2033
- Table 33: GCC Rna Tracking And Visualization Revenue (million) Forecast, by Application 2020 & 2033
- Table 34: North Africa Rna Tracking And Visualization Revenue (million) Forecast, by Application 2020 & 2033
- Table 35: South Africa Rna Tracking And Visualization Revenue (million) Forecast, by Application 2020 & 2033
- Table 36: Rest of Middle East & Africa Rna Tracking And Visualization Revenue (million) Forecast, by Application 2020 & 2033
- Table 37: Global Rna Tracking And Visualization Revenue million Forecast, by Application 2020 & 2033
- Table 38: Global Rna Tracking And Visualization Revenue million Forecast, by Type 2020 & 2033
- Table 39: Global Rna Tracking And Visualization Revenue million Forecast, by Country 2020 & 2033
- Table 40: China Rna Tracking And Visualization Revenue (million) Forecast, by Application 2020 & 2033
- Table 41: India Rna Tracking And Visualization Revenue (million) Forecast, by Application 2020 & 2033
- Table 42: Japan Rna Tracking And Visualization Revenue (million) Forecast, by Application 2020 & 2033
- Table 43: South Korea Rna Tracking And Visualization Revenue (million) Forecast, by Application 2020 & 2033
- Table 44: ASEAN Rna Tracking And Visualization Revenue (million) Forecast, by Application 2020 & 2033
- Table 45: Oceania Rna Tracking And Visualization Revenue (million) Forecast, by Application 2020 & 2033
- Table 46: Rest of Asia Pacific Rna Tracking And Visualization Revenue (million) Forecast, by Application 2020 & 2033
Frequently Asked Questions
1. What is the projected Compound Annual Growth Rate (CAGR) of the Rna Tracking And Visualization?
The projected CAGR is approximately 4.9%.
2. Which companies are prominent players in the Rna Tracking And Visualization?
Key companies in the market include ITSBio, Springer, Thermo Fisher Scientific, Applied Biological Materials Inc. (abm).
3. What are the main segments of the Rna Tracking And Visualization?
The market segments include Application, Type.
4. Can you provide details about the market size?
The market size is estimated to be USD 87.5 million as of 2022.
5. What are some drivers contributing to market growth?
N/A
6. What are the notable trends driving market growth?
N/A
7. Are there any restraints impacting market growth?
N/A
8. Can you provide examples of recent developments in the market?
N/A
9. What pricing options are available for accessing the report?
Pricing options include single-user, multi-user, and enterprise licenses priced at USD 4900.00, USD 7350.00, and USD 9800.00 respectively.
10. Is the market size provided in terms of value or volume?
The market size is provided in terms of value, measured in million.
11. Are there any specific market keywords associated with the report?
Yes, the market keyword associated with the report is "Rna Tracking And Visualization," which aids in identifying and referencing the specific market segment covered.
12. How do I determine which pricing option suits my needs best?
The pricing options vary based on user requirements and access needs. Individual users may opt for single-user licenses, while businesses requiring broader access may choose multi-user or enterprise licenses for cost-effective access to the report.
13. Are there any additional resources or data provided in the Rna Tracking And Visualization report?
While the report offers comprehensive insights, it's advisable to review the specific contents or supplementary materials provided to ascertain if additional resources or data are available.
14. How can I stay updated on further developments or reports in the Rna Tracking And Visualization?
To stay informed about further developments, trends, and reports in the Rna Tracking And Visualization, consider subscribing to industry newsletters, following relevant companies and organizations, or regularly checking reputable industry news sources and publications.
Methodology
Step 1 - Identification of Relevant Samples Size from Population Database



Step 2 - Approaches for Defining Global Market Size (Value, Volume* & Price*)

Note*: In applicable scenarios
Step 3 - Data Sources
Primary Research
- Web Analytics
- Survey Reports
- Research Institute
- Latest Research Reports
- Opinion Leaders
Secondary Research
- Annual Reports
- White Paper
- Latest Press Release
- Industry Association
- Paid Database
- Investor Presentations

Step 4 - Data Triangulation
Involves using different sources of information in order to increase the validity of a study
These sources are likely to be stakeholders in a program - participants, other researchers, program staff, other community members, and so on.
Then we put all data in single framework & apply various statistical tools to find out the dynamic on the market.
During the analysis stage, feedback from the stakeholder groups would be compared to determine areas of agreement as well as areas of divergence