

Key Insights
The RNA analytics market is poised for significant expansion, driven by innovations in sequencing technologies, a deeper understanding of RNA's regulatory functions and disease implications, and burgeoning applications in diagnostics and drug discovery. Projected to reach $8.8 billion by 2025, the market is expected to grow at a compound annual growth rate (CAGR) of 17.1% from 2025 to 2033. This robust growth is propelled by the increasing incidence of chronic diseases, necessitating advanced diagnostic solutions, and the rising demand for personalized medicine. Key technologies fueling this expansion include next-generation sequencing (NGS), microarrays, and PCR, each offering distinct advantages for RNA analysis. The widespread adoption of high-throughput and accurate NGS platforms is a primary contributor to market growth. Reagents and consumables currently represent the largest market segment, followed by instruments. However, innovative RNA analysis tools and software are expected to drive substantial growth in the 'Other Product Types' category. Clinical diagnostics is the leading application, highlighting the clinical importance of RNA biomarkers. Pharmaceutical and biotechnology firms are the dominant end-users, utilizing RNA analytics for drug target identification and development. North America and Europe currently lead the market, with the Asia-Pacific region anticipated to experience considerable growth due to escalating healthcare investments and technological advancements.
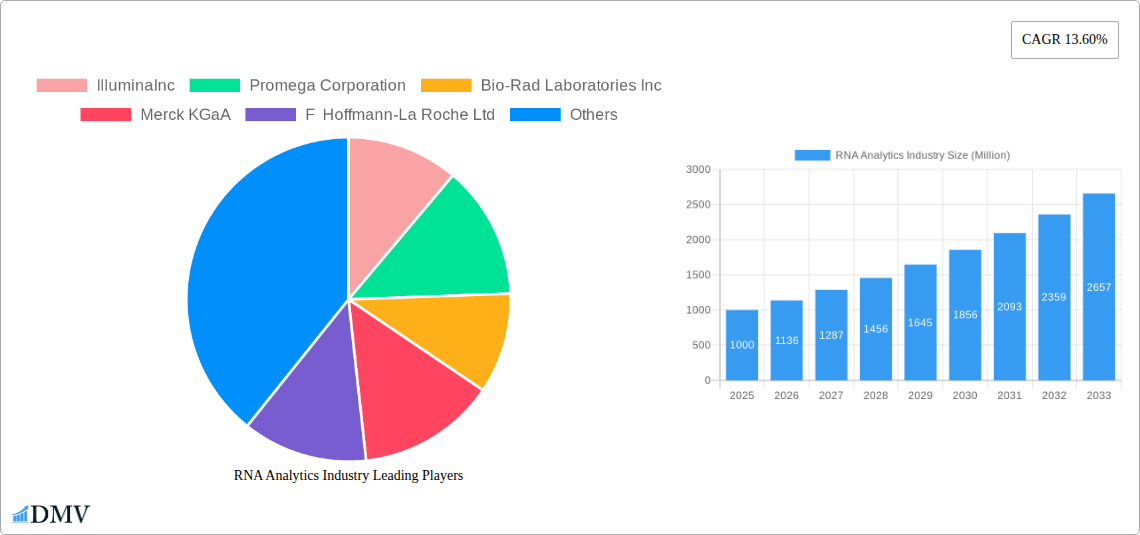
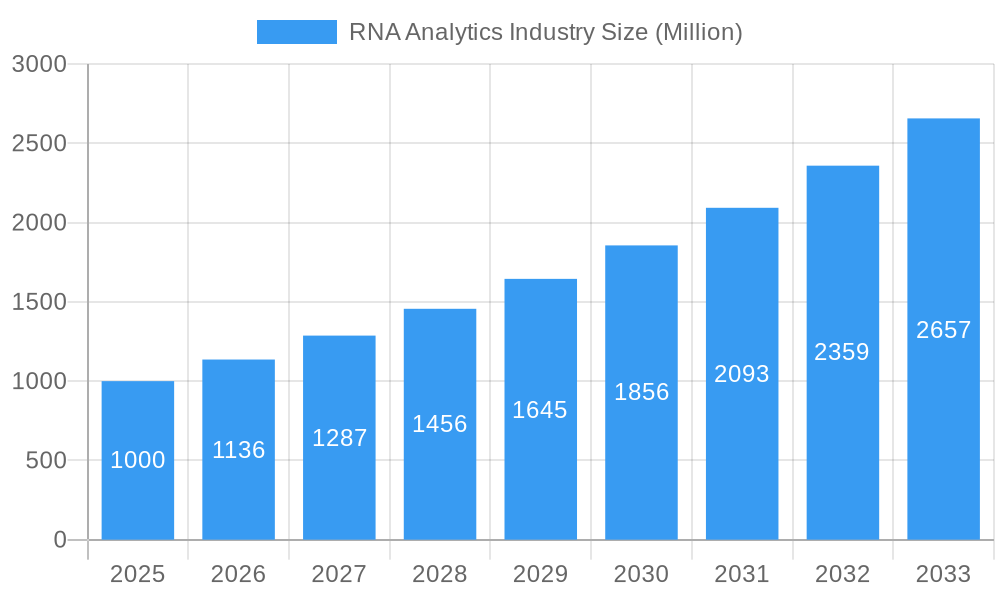
RNA Analytics Industry Market Size (In Billion)
The competitive arena is characterized by established leaders such as Illumina, Thermo Fisher Scientific, and QIAGEN, alongside dynamic emerging companies. Strategic alliances, mergers, and acquisitions are anticipated to further influence market dynamics. While challenges like the high cost of advanced technologies and intricate RNA data analysis persist, the market's growth trajectory remains strong. The development of intuitive software and more accessible solutions is expected to overcome these hurdles and accelerate market adoption. Continued advancements in RNA sequencing technologies, coupled with expanding personalized medicine applications, will sustain the market's impressive growth throughout the forecast period. Future expansion hinges on the development of cost-effective, user-friendly technologies, effective solutions for data analysis complexities, and the exploration of new therapeutic applications.
RNA Analytics Industry Company Market Share
RNA Analytics Industry: A Comprehensive Market Report (2019-2033)
This insightful report provides a comprehensive analysis of the RNA Analytics industry, encompassing market size, segmentation, key players, technological advancements, and future growth prospects. With a detailed study period spanning 2019-2033, a base year of 2025, and a forecast period of 2025-2033, this report is an indispensable resource for stakeholders seeking to understand and capitalize on the dynamic RNA Analytics market. The market is projected to reach xx Million by 2033.
RNA Analytics Industry Market Composition & Trends
The RNA Analytics market is characterized by a moderately concentrated landscape, with key players such as Illumina Inc, Promega Corporation, Bio-Rad Laboratories Inc, Merck KGaA, F Hoffmann-La Roche Ltd, Eurofins Scientific, Agilent Technologies Inc, LC Sciences, GenXPro GmbH, BioMérieux SA, Thermo Fisher Scientific, and QIAGEN holding significant market share. Innovation is driven by advancements in sequencing technologies, the development of novel reagents and consumables, and increasing demand for personalized medicine. Regulatory landscapes, particularly concerning clinical diagnostics, play a significant role, influencing market access and product development. Substitute products, while limited, include traditional methods like microarrays, which face increasing competition from next-generation sequencing technologies.
The market displays a diverse end-user profile, including pharmaceutical and biotechnology companies, hospitals and diagnostic centers, and academic research institutions. Mergers and acquisitions (M&A) activity has been moderate, with deal values totaling approximately xx Million in the past five years. The average deal size is estimated at xx Million.
- Market Share Distribution (2024): Illumina Inc (xx%), Thermo Fisher Scientific (xx%), Roche (xx%), Others (xx%)
- M&A Activity (2019-2024): Total deal value: xx Million; Average deal size: xx Million.
- Key Innovation Catalysts: Next-generation sequencing (NGS), microfluidics, CRISPR-Cas technology.
RNA Analytics Industry Industry Evolution
The RNA Analytics industry has experienced significant growth over the past five years, driven by technological advancements and expanding applications in various sectors. The market registered a Compound Annual Growth Rate (CAGR) of xx% between 2019 and 2024, reaching a value of xx Million in 2024. This growth is projected to continue at a CAGR of xx% during the forecast period (2025-2033), with the market size expected to reach xx Million by 2033. Key factors driving this growth include the increasing adoption of RNA-based diagnostics and therapeutics, growing investments in research and development, and the rising prevalence of chronic diseases. Technological advancements, such as the development of more efficient and cost-effective sequencing technologies and improved data analysis tools, have significantly enhanced the market's capabilities. Shifting consumer demands towards personalized medicine and faster diagnostic turnaround times are also propelling growth. The adoption rate of NGS technologies is estimated to increase by xx% annually during the forecast period. The market for RNA-based therapeutics is anticipated to grow at a CAGR of xx% over the next decade.
Leading Regions, Countries, or Segments in RNA Analytics Industry
North America currently dominates the RNA Analytics market, driven by robust research funding, advanced infrastructure, and the presence of major players. However, the Asia-Pacific region is projected to witness significant growth in the coming years, fueled by rising healthcare expenditure and increasing awareness of RNA-based technologies.
- By Product Type: Reagents/consumables hold the largest market share due to the high volume consumption in research and diagnostic settings.
- By Technology: Next-Generation Sequencing (NGS) is the dominant technology, owing to its high throughput and accuracy.
- By Application: Clinical diagnostics, driven by the rising prevalence of infectious diseases and cancers, is a major application segment.
- By End User: Pharmaceutical and biotechnology companies are the largest end-users, actively utilizing RNA analytics in drug discovery and development.
Key Drivers:
- North America: High R&D investment, established regulatory frameworks, strong presence of major players.
- Asia-Pacific: Rising healthcare expenditure, increasing prevalence of chronic diseases, growing adoption of advanced technologies.
RNA Analytics Industry Product Innovations
Recent innovations in RNA analytics include the development of highly sensitive and specific RNA detection assays, improved sequencing technologies with increased throughput and reduced costs, and advanced bioinformatics tools for analyzing complex RNA data. These advancements enable more accurate and efficient detection of RNA biomarkers, facilitating earlier diagnosis and targeted therapies. For example, Bio-Rad Laboratories' SEQuoia Express Stranded RNA Library Prep Kit streamlines RNA-Seq workflows, improving efficiency and data quality. This translates to faster turnaround times and reduced costs for researchers and clinicians.
Propelling Factors for RNA Analytics Industry Growth
Several factors propel the growth of the RNA Analytics industry. Technological advancements, such as improved sequencing technologies, are reducing costs and increasing throughput, making RNA analysis more accessible. The increasing prevalence of chronic diseases like cancer and infectious diseases is boosting demand for RNA-based diagnostics. Government funding and regulatory support for research and development further fuel the industry's growth. Finally, the growing demand for personalized medicine and the development of novel RNA-based therapeutics create significant growth opportunities.
Obstacles in the RNA Analytics Industry Market
The RNA Analytics market faces challenges including the high cost of sequencing technologies, complex data analysis requirements, and stringent regulatory approvals for clinical diagnostics. Supply chain disruptions can also impact the availability of reagents and consumables. Finally, intense competition among established players and emerging companies poses a challenge to market entrants. The impact of supply chain disruptions on the market was estimated at xx Million in 2022.
Future Opportunities in RNA Analytics Industry
Future opportunities include the expansion of RNA analytics into new applications, such as liquid biopsies and personalized cancer therapies. Advancements in single-cell RNA sequencing are paving the way for more in-depth analysis of cellular heterogeneity. The development of new biomarkers and therapeutic targets based on RNA analysis will drive further growth. Finally, expanding into developing markets offers substantial untapped potential.
Major Players in the RNA Analytics Industry Ecosystem
- Illumina Inc
- Promega Corporation
- Bio-Rad Laboratories Inc
- Merck KGaA
- F Hoffmann-La Roche Ltd
- Eurofins Scientific
- Agilent Technologies Inc
- LC Sciences
- GenXPro GmbH
- BioMérieux SA
- Thermo Fisher Scientific
- QIAGEN
Key Developments in RNA Analytics Industry Industry
- June 2022: Bio-Rad Laboratories, Inc. launched the SEQuoia Express Stranded RNA Library Prep Kit, enhancing RNA-Sequencing workflows for transcriptome profiling. This launch increased market competitiveness and improved workflow efficiency.
- February 2022: eRNA partnered with Merck KGaA for mRNA design and LNP-delivery platform research, fostering innovation in mRNA therapeutics and potentially impacting future market share.
Strategic RNA Analytics Industry Market Forecast
The RNA Analytics market is poised for substantial growth, fueled by technological advancements, increasing applications in diagnostics and therapeutics, and growing investments in research and development. The convergence of next-generation sequencing, artificial intelligence, and big data analytics will create new opportunities for more precise and personalized medicine. This presents a significant market expansion opportunity for existing players and new entrants alike. The market's future growth will be characterized by innovation, collaboration, and the development of comprehensive solutions that integrate hardware, software, and data analysis capabilities.
RNA Analytics Industry Segmentation
-
1. Product Type
- 1.1. Reagents/Consumables
- 1.2. Instruments
- 1.3. Other Product Types
-
2. Technology
- 2.1. Microarrays
- 2.2. Sequencing
- 2.3. Polymerase Chain Reaction (PCR)
- 2.4. Others
-
3. Application
- 3.1. Clinical Diagnostics
- 3.2. Drug Discovery
- 3.3. Toxicogenomic
- 3.4. Other Applications
-
4. End User
- 4.1. Pharmaceutical & Biotechnology Companies
- 4.2. Hospitals and Diagnostic Centers
- 4.3. Others
RNA Analytics Industry Segmentation By Geography
-
1. North America
- 1.1. United States
- 1.2. Canada
- 1.3. Mexico
-
2. Europe
- 2.1. Germany
- 2.2. United Kingdom
- 2.3. France
- 2.4. Italy
- 2.5. Spain
- 2.6. Rest of Europe
-
3. Asia Pacific
- 3.1. China
- 3.2. Japan
- 3.3. India
- 3.4. Australia
- 3.5. South Korea
- 3.6. Rest of Asia Pacific
-
4. Middle East and Africa
- 4.1. GCC
- 4.2. South Africa
- 4.3. Rest of Middle East and Africa
-
5. South America
- 5.1. Brazil
- 5.2. Argentina
- 5.3. Rest of South America
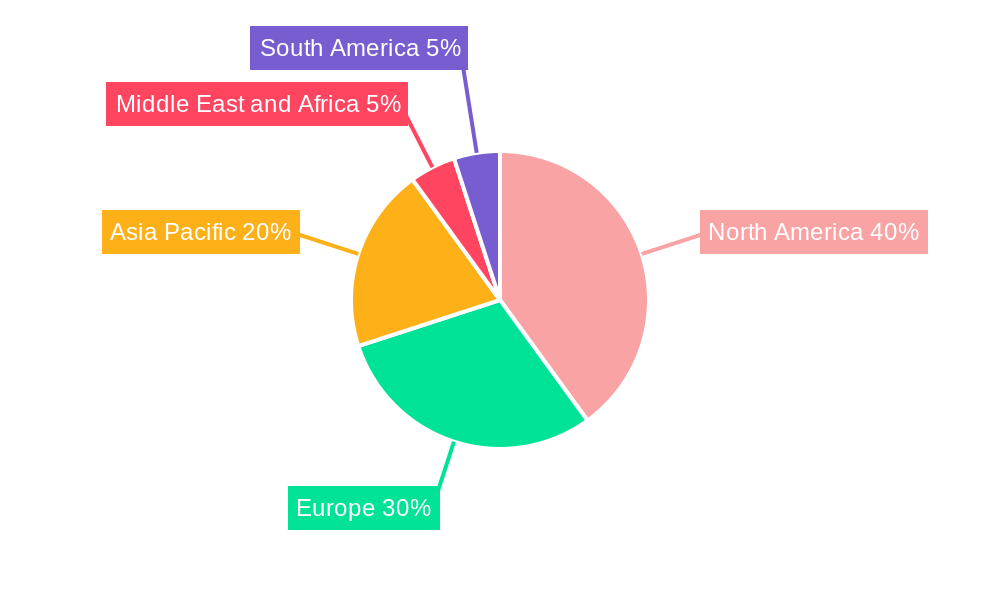
RNA Analytics Industry Regional Market Share
Geographic Coverage of RNA Analytics Industry
RNA Analytics Industry REPORT HIGHLIGHTS
| Aspects | Details |
|---|---|
| Study Period | 2020-2034 |
| Base Year | 2025 |
| Estimated Year | 2026 |
| Forecast Period | 2026-2034 |
| Historical Period | 2020-2025 |
| Growth Rate | CAGR of 17.1% from 2020-2034 |
| Segmentation |
|
Table of Contents
- 1. Introduction
- 1.1. Research Scope
- 1.2. Market Segmentation
- 1.3. Research Objective
- 1.4. Definitions and Assumptions
- 2. Executive Summary
- 2.1. Market Snapshot
- 3. Market Dynamics
- 3.1. Market Drivers
- 3.2. Market Restrains
- 3.3. Market Trends
- 3.4. Market Opportunities
- 4. Market Factor Analysis
- 4.1. Porters Five Forces
- 4.1.1. Bargaining Power of Suppliers
- 4.1.2. Bargaining Power of Buyers
- 4.1.3. Threat of New Entrants
- 4.1.4. Threat of Substitutes
- 4.1.5. Competitive Rivalry
- 4.2. PESTEL analysis
- 4.3. BCG Analysis
- 4.3.1. Stars (High Growth, High Market Share)
- 4.3.2. Cash Cows (Low Growth, High Market Share)
- 4.3.3. Question Mark (High Growth, Low Market Share)
- 4.3.4. Dogs (Low Growth, Low Market Share)
- 4.4. Ansoff Matrix Analysis
- 4.5. Supply Chain Analysis
- 4.6. Regulatory Landscape
- 4.7. Current Market Potential and Opportunity Assessment (TAM–SAM–SOM Framework)
- 4.8. DMV Analyst Note
- 4.1. Porters Five Forces
- 5. Market Analysis, Insights and Forecast 2021-2033
- 5.1. Market Analysis, Insights and Forecast - by Product Type
- 5.1.1. Reagents/Consumables
- 5.1.2. Instruments
- 5.1.3. Other Product Types
- 5.2. Market Analysis, Insights and Forecast - by Technology
- 5.2.1. Microarrays
- 5.2.2. Sequencing
- 5.2.3. Polymerase Chain Reaction (PCR)
- 5.2.4. Others
- 5.3. Market Analysis, Insights and Forecast - by Application
- 5.3.1. Clinical Diagnostics
- 5.3.2. Drug Discovery
- 5.3.3. Toxicogenomic
- 5.3.4. Other Applications
- 5.4. Market Analysis, Insights and Forecast - by End User
- 5.4.1. Pharmaceutical & Biotechnology Companies
- 5.4.2. Hospitals and Diagnostic Centers
- 5.4.3. Others
- 5.5. Market Analysis, Insights and Forecast - by Region
- 5.5.1. North America
- 5.5.2. Europe
- 5.5.3. Asia Pacific
- 5.5.4. Middle East and Africa
- 5.5.5. South America
- 5.1. Market Analysis, Insights and Forecast - by Product Type
- 6. Global RNA Analytics Industry Analysis, Insights and Forecast, 2021-2033
- 6.1. Market Analysis, Insights and Forecast - by Product Type
- 6.1.1. Reagents/Consumables
- 6.1.2. Instruments
- 6.1.3. Other Product Types
- 6.2. Market Analysis, Insights and Forecast - by Technology
- 6.2.1. Microarrays
- 6.2.2. Sequencing
- 6.2.3. Polymerase Chain Reaction (PCR)
- 6.2.4. Others
- 6.3. Market Analysis, Insights and Forecast - by Application
- 6.3.1. Clinical Diagnostics
- 6.3.2. Drug Discovery
- 6.3.3. Toxicogenomic
- 6.3.4. Other Applications
- 6.4. Market Analysis, Insights and Forecast - by End User
- 6.4.1. Pharmaceutical & Biotechnology Companies
- 6.4.2. Hospitals and Diagnostic Centers
- 6.4.3. Others
- 6.1. Market Analysis, Insights and Forecast - by Product Type
- 7. North America RNA Analytics Industry Analysis, Insights and Forecast, 2020-2032
- 7.1. Market Analysis, Insights and Forecast - by Product Type
- 7.1.1. Reagents/Consumables
- 7.1.2. Instruments
- 7.1.3. Other Product Types
- 7.2. Market Analysis, Insights and Forecast - by Technology
- 7.2.1. Microarrays
- 7.2.2. Sequencing
- 7.2.3. Polymerase Chain Reaction (PCR)
- 7.2.4. Others
- 7.3. Market Analysis, Insights and Forecast - by Application
- 7.3.1. Clinical Diagnostics
- 7.3.2. Drug Discovery
- 7.3.3. Toxicogenomic
- 7.3.4. Other Applications
- 7.4. Market Analysis, Insights and Forecast - by End User
- 7.4.1. Pharmaceutical & Biotechnology Companies
- 7.4.2. Hospitals and Diagnostic Centers
- 7.4.3. Others
- 7.1. Market Analysis, Insights and Forecast - by Product Type
- 8. Europe RNA Analytics Industry Analysis, Insights and Forecast, 2020-2032
- 8.1. Market Analysis, Insights and Forecast - by Product Type
- 8.1.1. Reagents/Consumables
- 8.1.2. Instruments
- 8.1.3. Other Product Types
- 8.2. Market Analysis, Insights and Forecast - by Technology
- 8.2.1. Microarrays
- 8.2.2. Sequencing
- 8.2.3. Polymerase Chain Reaction (PCR)
- 8.2.4. Others
- 8.3. Market Analysis, Insights and Forecast - by Application
- 8.3.1. Clinical Diagnostics
- 8.3.2. Drug Discovery
- 8.3.3. Toxicogenomic
- 8.3.4. Other Applications
- 8.4. Market Analysis, Insights and Forecast - by End User
- 8.4.1. Pharmaceutical & Biotechnology Companies
- 8.4.2. Hospitals and Diagnostic Centers
- 8.4.3. Others
- 8.1. Market Analysis, Insights and Forecast - by Product Type
- 9. Asia Pacific RNA Analytics Industry Analysis, Insights and Forecast, 2020-2032
- 9.1. Market Analysis, Insights and Forecast - by Product Type
- 9.1.1. Reagents/Consumables
- 9.1.2. Instruments
- 9.1.3. Other Product Types
- 9.2. Market Analysis, Insights and Forecast - by Technology
- 9.2.1. Microarrays
- 9.2.2. Sequencing
- 9.2.3. Polymerase Chain Reaction (PCR)
- 9.2.4. Others
- 9.3. Market Analysis, Insights and Forecast - by Application
- 9.3.1. Clinical Diagnostics
- 9.3.2. Drug Discovery
- 9.3.3. Toxicogenomic
- 9.3.4. Other Applications
- 9.4. Market Analysis, Insights and Forecast - by End User
- 9.4.1. Pharmaceutical & Biotechnology Companies
- 9.4.2. Hospitals and Diagnostic Centers
- 9.4.3. Others
- 9.1. Market Analysis, Insights and Forecast - by Product Type
- 10. Middle East and Africa RNA Analytics Industry Analysis, Insights and Forecast, 2020-2032
- 10.1. Market Analysis, Insights and Forecast - by Product Type
- 10.1.1. Reagents/Consumables
- 10.1.2. Instruments
- 10.1.3. Other Product Types
- 10.2. Market Analysis, Insights and Forecast - by Technology
- 10.2.1. Microarrays
- 10.2.2. Sequencing
- 10.2.3. Polymerase Chain Reaction (PCR)
- 10.2.4. Others
- 10.3. Market Analysis, Insights and Forecast - by Application
- 10.3.1. Clinical Diagnostics
- 10.3.2. Drug Discovery
- 10.3.3. Toxicogenomic
- 10.3.4. Other Applications
- 10.4. Market Analysis, Insights and Forecast - by End User
- 10.4.1. Pharmaceutical & Biotechnology Companies
- 10.4.2. Hospitals and Diagnostic Centers
- 10.4.3. Others
- 10.1. Market Analysis, Insights and Forecast - by Product Type
- 11. South America RNA Analytics Industry Analysis, Insights and Forecast, 2020-2032
- 11.1. Market Analysis, Insights and Forecast - by Product Type
- 11.1.1. Reagents/Consumables
- 11.1.2. Instruments
- 11.1.3. Other Product Types
- 11.2. Market Analysis, Insights and Forecast - by Technology
- 11.2.1. Microarrays
- 11.2.2. Sequencing
- 11.2.3. Polymerase Chain Reaction (PCR)
- 11.2.4. Others
- 11.3. Market Analysis, Insights and Forecast - by Application
- 11.3.1. Clinical Diagnostics
- 11.3.2. Drug Discovery
- 11.3.3. Toxicogenomic
- 11.3.4. Other Applications
- 11.4. Market Analysis, Insights and Forecast - by End User
- 11.4.1. Pharmaceutical & Biotechnology Companies
- 11.4.2. Hospitals and Diagnostic Centers
- 11.4.3. Others
- 11.1. Market Analysis, Insights and Forecast - by Product Type
- 12. Competitive Analysis
- 12.1. Company Profiles
- 12.1.1 IlluminaInc
- 12.1.1.1. Company Overview
- 12.1.1.2. Products
- 12.1.1.3. Company Financials
- 12.1.1.4. SWOT Analysis
- 12.1.2 Promega Corporation
- 12.1.2.1. Company Overview
- 12.1.2.2. Products
- 12.1.2.3. Company Financials
- 12.1.2.4. SWOT Analysis
- 12.1.3 Bio-Rad Laboratories Inc
- 12.1.3.1. Company Overview
- 12.1.3.2. Products
- 12.1.3.3. Company Financials
- 12.1.3.4. SWOT Analysis
- 12.1.4 Merck KGaA
- 12.1.4.1. Company Overview
- 12.1.4.2. Products
- 12.1.4.3. Company Financials
- 12.1.4.4. SWOT Analysis
- 12.1.5 F Hoffmann-La Roche Ltd
- 12.1.5.1. Company Overview
- 12.1.5.2. Products
- 12.1.5.3. Company Financials
- 12.1.5.4. SWOT Analysis
- 12.1.6 Eurofins Scientific
- 12.1.6.1. Company Overview
- 12.1.6.2. Products
- 12.1.6.3. Company Financials
- 12.1.6.4. SWOT Analysis
- 12.1.7 Agilent Technologies Inc
- 12.1.7.1. Company Overview
- 12.1.7.2. Products
- 12.1.7.3. Company Financials
- 12.1.7.4. SWOT Analysis
- 12.1.8 LC Sciences
- 12.1.8.1. Company Overview
- 12.1.8.2. Products
- 12.1.8.3. Company Financials
- 12.1.8.4. SWOT Analysis
- 12.1.9 GenXPro GmbH
- 12.1.9.1. Company Overview
- 12.1.9.2. Products
- 12.1.9.3. Company Financials
- 12.1.9.4. SWOT Analysis
- 12.1.10 BioMérieux SA
- 12.1.10.1. Company Overview
- 12.1.10.2. Products
- 12.1.10.3. Company Financials
- 12.1.10.4. SWOT Analysis
- 12.1.11 Thermo Fisher Scientific
- 12.1.11.1. Company Overview
- 12.1.11.2. Products
- 12.1.11.3. Company Financials
- 12.1.11.4. SWOT Analysis
- 12.1.12 QIAGEN
- 12.1.12.1. Company Overview
- 12.1.12.2. Products
- 12.1.12.3. Company Financials
- 12.1.12.4. SWOT Analysis
- 12.1.1 IlluminaInc
- 12.2. Market Entropy
- 12.2.1 Company's Key Areas Served
- 12.2.2 Recent Developments
- 12.3. Company Market Share Analysis 2025
- 12.3.1 Top 5 Companies Market Share Analysis
- 12.3.2 Top 3 Companies Market Share Analysis
- 12.4. List of Potential Customers
- 13. Research Methodology
List of Figures
- Figure 1: Global RNA Analytics Industry Revenue Breakdown (billion, %) by Region 2025 & 2033
- Figure 2: Global RNA Analytics Industry Volume Breakdown (K Unit, %) by Region 2025 & 2033
- Figure 3: North America RNA Analytics Industry Revenue (billion), by Product Type 2025 & 2033
- Figure 4: North America RNA Analytics Industry Volume (K Unit), by Product Type 2025 & 2033
- Figure 5: North America RNA Analytics Industry Revenue Share (%), by Product Type 2025 & 2033
- Figure 6: North America RNA Analytics Industry Volume Share (%), by Product Type 2025 & 2033
- Figure 7: North America RNA Analytics Industry Revenue (billion), by Technology 2025 & 2033
- Figure 8: North America RNA Analytics Industry Volume (K Unit), by Technology 2025 & 2033
- Figure 9: North America RNA Analytics Industry Revenue Share (%), by Technology 2025 & 2033
- Figure 10: North America RNA Analytics Industry Volume Share (%), by Technology 2025 & 2033
- Figure 11: North America RNA Analytics Industry Revenue (billion), by Application 2025 & 2033
- Figure 12: North America RNA Analytics Industry Volume (K Unit), by Application 2025 & 2033
- Figure 13: North America RNA Analytics Industry Revenue Share (%), by Application 2025 & 2033
- Figure 14: North America RNA Analytics Industry Volume Share (%), by Application 2025 & 2033
- Figure 15: North America RNA Analytics Industry Revenue (billion), by End User 2025 & 2033
- Figure 16: North America RNA Analytics Industry Volume (K Unit), by End User 2025 & 2033
- Figure 17: North America RNA Analytics Industry Revenue Share (%), by End User 2025 & 2033
- Figure 18: North America RNA Analytics Industry Volume Share (%), by End User 2025 & 2033
- Figure 19: North America RNA Analytics Industry Revenue (billion), by Country 2025 & 2033
- Figure 20: North America RNA Analytics Industry Volume (K Unit), by Country 2025 & 2033
- Figure 21: North America RNA Analytics Industry Revenue Share (%), by Country 2025 & 2033
- Figure 22: North America RNA Analytics Industry Volume Share (%), by Country 2025 & 2033
- Figure 23: Europe RNA Analytics Industry Revenue (billion), by Product Type 2025 & 2033
- Figure 24: Europe RNA Analytics Industry Volume (K Unit), by Product Type 2025 & 2033
- Figure 25: Europe RNA Analytics Industry Revenue Share (%), by Product Type 2025 & 2033
- Figure 26: Europe RNA Analytics Industry Volume Share (%), by Product Type 2025 & 2033
- Figure 27: Europe RNA Analytics Industry Revenue (billion), by Technology 2025 & 2033
- Figure 28: Europe RNA Analytics Industry Volume (K Unit), by Technology 2025 & 2033
- Figure 29: Europe RNA Analytics Industry Revenue Share (%), by Technology 2025 & 2033
- Figure 30: Europe RNA Analytics Industry Volume Share (%), by Technology 2025 & 2033
- Figure 31: Europe RNA Analytics Industry Revenue (billion), by Application 2025 & 2033
- Figure 32: Europe RNA Analytics Industry Volume (K Unit), by Application 2025 & 2033
- Figure 33: Europe RNA Analytics Industry Revenue Share (%), by Application 2025 & 2033
- Figure 34: Europe RNA Analytics Industry Volume Share (%), by Application 2025 & 2033
- Figure 35: Europe RNA Analytics Industry Revenue (billion), by End User 2025 & 2033
- Figure 36: Europe RNA Analytics Industry Volume (K Unit), by End User 2025 & 2033
- Figure 37: Europe RNA Analytics Industry Revenue Share (%), by End User 2025 & 2033
- Figure 38: Europe RNA Analytics Industry Volume Share (%), by End User 2025 & 2033
- Figure 39: Europe RNA Analytics Industry Revenue (billion), by Country 2025 & 2033
- Figure 40: Europe RNA Analytics Industry Volume (K Unit), by Country 2025 & 2033
- Figure 41: Europe RNA Analytics Industry Revenue Share (%), by Country 2025 & 2033
- Figure 42: Europe RNA Analytics Industry Volume Share (%), by Country 2025 & 2033
- Figure 43: Asia Pacific RNA Analytics Industry Revenue (billion), by Product Type 2025 & 2033
- Figure 44: Asia Pacific RNA Analytics Industry Volume (K Unit), by Product Type 2025 & 2033
- Figure 45: Asia Pacific RNA Analytics Industry Revenue Share (%), by Product Type 2025 & 2033
- Figure 46: Asia Pacific RNA Analytics Industry Volume Share (%), by Product Type 2025 & 2033
- Figure 47: Asia Pacific RNA Analytics Industry Revenue (billion), by Technology 2025 & 2033
- Figure 48: Asia Pacific RNA Analytics Industry Volume (K Unit), by Technology 2025 & 2033
- Figure 49: Asia Pacific RNA Analytics Industry Revenue Share (%), by Technology 2025 & 2033
- Figure 50: Asia Pacific RNA Analytics Industry Volume Share (%), by Technology 2025 & 2033
- Figure 51: Asia Pacific RNA Analytics Industry Revenue (billion), by Application 2025 & 2033
- Figure 52: Asia Pacific RNA Analytics Industry Volume (K Unit), by Application 2025 & 2033
- Figure 53: Asia Pacific RNA Analytics Industry Revenue Share (%), by Application 2025 & 2033
- Figure 54: Asia Pacific RNA Analytics Industry Volume Share (%), by Application 2025 & 2033
- Figure 55: Asia Pacific RNA Analytics Industry Revenue (billion), by End User 2025 & 2033
- Figure 56: Asia Pacific RNA Analytics Industry Volume (K Unit), by End User 2025 & 2033
- Figure 57: Asia Pacific RNA Analytics Industry Revenue Share (%), by End User 2025 & 2033
- Figure 58: Asia Pacific RNA Analytics Industry Volume Share (%), by End User 2025 & 2033
- Figure 59: Asia Pacific RNA Analytics Industry Revenue (billion), by Country 2025 & 2033
- Figure 60: Asia Pacific RNA Analytics Industry Volume (K Unit), by Country 2025 & 2033
- Figure 61: Asia Pacific RNA Analytics Industry Revenue Share (%), by Country 2025 & 2033
- Figure 62: Asia Pacific RNA Analytics Industry Volume Share (%), by Country 2025 & 2033
- Figure 63: Middle East and Africa RNA Analytics Industry Revenue (billion), by Product Type 2025 & 2033
- Figure 64: Middle East and Africa RNA Analytics Industry Volume (K Unit), by Product Type 2025 & 2033
- Figure 65: Middle East and Africa RNA Analytics Industry Revenue Share (%), by Product Type 2025 & 2033
- Figure 66: Middle East and Africa RNA Analytics Industry Volume Share (%), by Product Type 2025 & 2033
- Figure 67: Middle East and Africa RNA Analytics Industry Revenue (billion), by Technology 2025 & 2033
- Figure 68: Middle East and Africa RNA Analytics Industry Volume (K Unit), by Technology 2025 & 2033
- Figure 69: Middle East and Africa RNA Analytics Industry Revenue Share (%), by Technology 2025 & 2033
- Figure 70: Middle East and Africa RNA Analytics Industry Volume Share (%), by Technology 2025 & 2033
- Figure 71: Middle East and Africa RNA Analytics Industry Revenue (billion), by Application 2025 & 2033
- Figure 72: Middle East and Africa RNA Analytics Industry Volume (K Unit), by Application 2025 & 2033
- Figure 73: Middle East and Africa RNA Analytics Industry Revenue Share (%), by Application 2025 & 2033
- Figure 74: Middle East and Africa RNA Analytics Industry Volume Share (%), by Application 2025 & 2033
- Figure 75: Middle East and Africa RNA Analytics Industry Revenue (billion), by End User 2025 & 2033
- Figure 76: Middle East and Africa RNA Analytics Industry Volume (K Unit), by End User 2025 & 2033
- Figure 77: Middle East and Africa RNA Analytics Industry Revenue Share (%), by End User 2025 & 2033
- Figure 78: Middle East and Africa RNA Analytics Industry Volume Share (%), by End User 2025 & 2033
- Figure 79: Middle East and Africa RNA Analytics Industry Revenue (billion), by Country 2025 & 2033
- Figure 80: Middle East and Africa RNA Analytics Industry Volume (K Unit), by Country 2025 & 2033
- Figure 81: Middle East and Africa RNA Analytics Industry Revenue Share (%), by Country 2025 & 2033
- Figure 82: Middle East and Africa RNA Analytics Industry Volume Share (%), by Country 2025 & 2033
- Figure 83: South America RNA Analytics Industry Revenue (billion), by Product Type 2025 & 2033
- Figure 84: South America RNA Analytics Industry Volume (K Unit), by Product Type 2025 & 2033
- Figure 85: South America RNA Analytics Industry Revenue Share (%), by Product Type 2025 & 2033
- Figure 86: South America RNA Analytics Industry Volume Share (%), by Product Type 2025 & 2033
- Figure 87: South America RNA Analytics Industry Revenue (billion), by Technology 2025 & 2033
- Figure 88: South America RNA Analytics Industry Volume (K Unit), by Technology 2025 & 2033
- Figure 89: South America RNA Analytics Industry Revenue Share (%), by Technology 2025 & 2033
- Figure 90: South America RNA Analytics Industry Volume Share (%), by Technology 2025 & 2033
- Figure 91: South America RNA Analytics Industry Revenue (billion), by Application 2025 & 2033
- Figure 92: South America RNA Analytics Industry Volume (K Unit), by Application 2025 & 2033
- Figure 93: South America RNA Analytics Industry Revenue Share (%), by Application 2025 & 2033
- Figure 94: South America RNA Analytics Industry Volume Share (%), by Application 2025 & 2033
- Figure 95: South America RNA Analytics Industry Revenue (billion), by End User 2025 & 2033
- Figure 96: South America RNA Analytics Industry Volume (K Unit), by End User 2025 & 2033
- Figure 97: South America RNA Analytics Industry Revenue Share (%), by End User 2025 & 2033
- Figure 98: South America RNA Analytics Industry Volume Share (%), by End User 2025 & 2033
- Figure 99: South America RNA Analytics Industry Revenue (billion), by Country 2025 & 2033
- Figure 100: South America RNA Analytics Industry Volume (K Unit), by Country 2025 & 2033
- Figure 101: South America RNA Analytics Industry Revenue Share (%), by Country 2025 & 2033
- Figure 102: South America RNA Analytics Industry Volume Share (%), by Country 2025 & 2033
List of Tables
- Table 1: Global RNA Analytics Industry Revenue billion Forecast, by Product Type 2020 & 2033
- Table 2: Global RNA Analytics Industry Volume K Unit Forecast, by Product Type 2020 & 2033
- Table 3: Global RNA Analytics Industry Revenue billion Forecast, by Technology 2020 & 2033
- Table 4: Global RNA Analytics Industry Volume K Unit Forecast, by Technology 2020 & 2033
- Table 5: Global RNA Analytics Industry Revenue billion Forecast, by Application 2020 & 2033
- Table 6: Global RNA Analytics Industry Volume K Unit Forecast, by Application 2020 & 2033
- Table 7: Global RNA Analytics Industry Revenue billion Forecast, by End User 2020 & 2033
- Table 8: Global RNA Analytics Industry Volume K Unit Forecast, by End User 2020 & 2033
- Table 9: Global RNA Analytics Industry Revenue billion Forecast, by Region 2020 & 2033
- Table 10: Global RNA Analytics Industry Volume K Unit Forecast, by Region 2020 & 2033
- Table 11: Global RNA Analytics Industry Revenue billion Forecast, by Product Type 2020 & 2033
- Table 12: Global RNA Analytics Industry Volume K Unit Forecast, by Product Type 2020 & 2033
- Table 13: Global RNA Analytics Industry Revenue billion Forecast, by Technology 2020 & 2033
- Table 14: Global RNA Analytics Industry Volume K Unit Forecast, by Technology 2020 & 2033
- Table 15: Global RNA Analytics Industry Revenue billion Forecast, by Application 2020 & 2033
- Table 16: Global RNA Analytics Industry Volume K Unit Forecast, by Application 2020 & 2033
- Table 17: Global RNA Analytics Industry Revenue billion Forecast, by End User 2020 & 2033
- Table 18: Global RNA Analytics Industry Volume K Unit Forecast, by End User 2020 & 2033
- Table 19: Global RNA Analytics Industry Revenue billion Forecast, by Country 2020 & 2033
- Table 20: Global RNA Analytics Industry Volume K Unit Forecast, by Country 2020 & 2033
- Table 21: United States RNA Analytics Industry Revenue (billion) Forecast, by Application 2020 & 2033
- Table 22: United States RNA Analytics Industry Volume (K Unit) Forecast, by Application 2020 & 2033
- Table 23: Canada RNA Analytics Industry Revenue (billion) Forecast, by Application 2020 & 2033
- Table 24: Canada RNA Analytics Industry Volume (K Unit) Forecast, by Application 2020 & 2033
- Table 25: Mexico RNA Analytics Industry Revenue (billion) Forecast, by Application 2020 & 2033
- Table 26: Mexico RNA Analytics Industry Volume (K Unit) Forecast, by Application 2020 & 2033
- Table 27: Global RNA Analytics Industry Revenue billion Forecast, by Product Type 2020 & 2033
- Table 28: Global RNA Analytics Industry Volume K Unit Forecast, by Product Type 2020 & 2033
- Table 29: Global RNA Analytics Industry Revenue billion Forecast, by Technology 2020 & 2033
- Table 30: Global RNA Analytics Industry Volume K Unit Forecast, by Technology 2020 & 2033
- Table 31: Global RNA Analytics Industry Revenue billion Forecast, by Application 2020 & 2033
- Table 32: Global RNA Analytics Industry Volume K Unit Forecast, by Application 2020 & 2033
- Table 33: Global RNA Analytics Industry Revenue billion Forecast, by End User 2020 & 2033
- Table 34: Global RNA Analytics Industry Volume K Unit Forecast, by End User 2020 & 2033
- Table 35: Global RNA Analytics Industry Revenue billion Forecast, by Country 2020 & 2033
- Table 36: Global RNA Analytics Industry Volume K Unit Forecast, by Country 2020 & 2033
- Table 37: Germany RNA Analytics Industry Revenue (billion) Forecast, by Application 2020 & 2033
- Table 38: Germany RNA Analytics Industry Volume (K Unit) Forecast, by Application 2020 & 2033
- Table 39: United Kingdom RNA Analytics Industry Revenue (billion) Forecast, by Application 2020 & 2033
- Table 40: United Kingdom RNA Analytics Industry Volume (K Unit) Forecast, by Application 2020 & 2033
- Table 41: France RNA Analytics Industry Revenue (billion) Forecast, by Application 2020 & 2033
- Table 42: France RNA Analytics Industry Volume (K Unit) Forecast, by Application 2020 & 2033
- Table 43: Italy RNA Analytics Industry Revenue (billion) Forecast, by Application 2020 & 2033
- Table 44: Italy RNA Analytics Industry Volume (K Unit) Forecast, by Application 2020 & 2033
- Table 45: Spain RNA Analytics Industry Revenue (billion) Forecast, by Application 2020 & 2033
- Table 46: Spain RNA Analytics Industry Volume (K Unit) Forecast, by Application 2020 & 2033
- Table 47: Rest of Europe RNA Analytics Industry Revenue (billion) Forecast, by Application 2020 & 2033
- Table 48: Rest of Europe RNA Analytics Industry Volume (K Unit) Forecast, by Application 2020 & 2033
- Table 49: Global RNA Analytics Industry Revenue billion Forecast, by Product Type 2020 & 2033
- Table 50: Global RNA Analytics Industry Volume K Unit Forecast, by Product Type 2020 & 2033
- Table 51: Global RNA Analytics Industry Revenue billion Forecast, by Technology 2020 & 2033
- Table 52: Global RNA Analytics Industry Volume K Unit Forecast, by Technology 2020 & 2033
- Table 53: Global RNA Analytics Industry Revenue billion Forecast, by Application 2020 & 2033
- Table 54: Global RNA Analytics Industry Volume K Unit Forecast, by Application 2020 & 2033
- Table 55: Global RNA Analytics Industry Revenue billion Forecast, by End User 2020 & 2033
- Table 56: Global RNA Analytics Industry Volume K Unit Forecast, by End User 2020 & 2033
- Table 57: Global RNA Analytics Industry Revenue billion Forecast, by Country 2020 & 2033
- Table 58: Global RNA Analytics Industry Volume K Unit Forecast, by Country 2020 & 2033
- Table 59: China RNA Analytics Industry Revenue (billion) Forecast, by Application 2020 & 2033
- Table 60: China RNA Analytics Industry Volume (K Unit) Forecast, by Application 2020 & 2033
- Table 61: Japan RNA Analytics Industry Revenue (billion) Forecast, by Application 2020 & 2033
- Table 62: Japan RNA Analytics Industry Volume (K Unit) Forecast, by Application 2020 & 2033
- Table 63: India RNA Analytics Industry Revenue (billion) Forecast, by Application 2020 & 2033
- Table 64: India RNA Analytics Industry Volume (K Unit) Forecast, by Application 2020 & 2033
- Table 65: Australia RNA Analytics Industry Revenue (billion) Forecast, by Application 2020 & 2033
- Table 66: Australia RNA Analytics Industry Volume (K Unit) Forecast, by Application 2020 & 2033
- Table 67: South Korea RNA Analytics Industry Revenue (billion) Forecast, by Application 2020 & 2033
- Table 68: South Korea RNA Analytics Industry Volume (K Unit) Forecast, by Application 2020 & 2033
- Table 69: Rest of Asia Pacific RNA Analytics Industry Revenue (billion) Forecast, by Application 2020 & 2033
- Table 70: Rest of Asia Pacific RNA Analytics Industry Volume (K Unit) Forecast, by Application 2020 & 2033
- Table 71: Global RNA Analytics Industry Revenue billion Forecast, by Product Type 2020 & 2033
- Table 72: Global RNA Analytics Industry Volume K Unit Forecast, by Product Type 2020 & 2033
- Table 73: Global RNA Analytics Industry Revenue billion Forecast, by Technology 2020 & 2033
- Table 74: Global RNA Analytics Industry Volume K Unit Forecast, by Technology 2020 & 2033
- Table 75: Global RNA Analytics Industry Revenue billion Forecast, by Application 2020 & 2033
- Table 76: Global RNA Analytics Industry Volume K Unit Forecast, by Application 2020 & 2033
- Table 77: Global RNA Analytics Industry Revenue billion Forecast, by End User 2020 & 2033
- Table 78: Global RNA Analytics Industry Volume K Unit Forecast, by End User 2020 & 2033
- Table 79: Global RNA Analytics Industry Revenue billion Forecast, by Country 2020 & 2033
- Table 80: Global RNA Analytics Industry Volume K Unit Forecast, by Country 2020 & 2033
- Table 81: GCC RNA Analytics Industry Revenue (billion) Forecast, by Application 2020 & 2033
- Table 82: GCC RNA Analytics Industry Volume (K Unit) Forecast, by Application 2020 & 2033
- Table 83: South Africa RNA Analytics Industry Revenue (billion) Forecast, by Application 2020 & 2033
- Table 84: South Africa RNA Analytics Industry Volume (K Unit) Forecast, by Application 2020 & 2033
- Table 85: Rest of Middle East and Africa RNA Analytics Industry Revenue (billion) Forecast, by Application 2020 & 2033
- Table 86: Rest of Middle East and Africa RNA Analytics Industry Volume (K Unit) Forecast, by Application 2020 & 2033
- Table 87: Global RNA Analytics Industry Revenue billion Forecast, by Product Type 2020 & 2033
- Table 88: Global RNA Analytics Industry Volume K Unit Forecast, by Product Type 2020 & 2033
- Table 89: Global RNA Analytics Industry Revenue billion Forecast, by Technology 2020 & 2033
- Table 90: Global RNA Analytics Industry Volume K Unit Forecast, by Technology 2020 & 2033
- Table 91: Global RNA Analytics Industry Revenue billion Forecast, by Application 2020 & 2033
- Table 92: Global RNA Analytics Industry Volume K Unit Forecast, by Application 2020 & 2033
- Table 93: Global RNA Analytics Industry Revenue billion Forecast, by End User 2020 & 2033
- Table 94: Global RNA Analytics Industry Volume K Unit Forecast, by End User 2020 & 2033
- Table 95: Global RNA Analytics Industry Revenue billion Forecast, by Country 2020 & 2033
- Table 96: Global RNA Analytics Industry Volume K Unit Forecast, by Country 2020 & 2033
- Table 97: Brazil RNA Analytics Industry Revenue (billion) Forecast, by Application 2020 & 2033
- Table 98: Brazil RNA Analytics Industry Volume (K Unit) Forecast, by Application 2020 & 2033
- Table 99: Argentina RNA Analytics Industry Revenue (billion) Forecast, by Application 2020 & 2033
- Table 100: Argentina RNA Analytics Industry Volume (K Unit) Forecast, by Application 2020 & 2033
- Table 101: Rest of South America RNA Analytics Industry Revenue (billion) Forecast, by Application 2020 & 2033
- Table 102: Rest of South America RNA Analytics Industry Volume (K Unit) Forecast, by Application 2020 & 2033
Frequently Asked Questions
1. What is the projected Compound Annual Growth Rate (CAGR) of the RNA Analytics Industry?
The projected CAGR is approximately 17.1%.
2. Which companies are prominent players in the RNA Analytics Industry?
Key companies in the market include IlluminaInc, Promega Corporation, Bio-Rad Laboratories Inc, Merck KGaA, F Hoffmann-La Roche Ltd, Eurofins Scientific, Agilent Technologies Inc, LC Sciences, GenXPro GmbH, BioMérieux SA, Thermo Fisher Scientific, QIAGEN.
3. What are the main segments of the RNA Analytics Industry?
The market segments include Product Type, Technology, Application, End User.
4. Can you provide details about the market size?
The market size is estimated to be USD 8.8 billion as of 2022.
5. What are some drivers contributing to market growth?
Rising RNA Analysis in Cancer Personalized or Precision Medicine; Growing Applications of RNA Sequencing in Transcriptomics.
6. What are the notable trends driving market growth?
Reagents/Consumables Segment is Expected to Hold a Significant Share.
7. Are there any restraints impacting market growth?
High Cost Associated With Platforms; High Capital Investments for Research and Development.
8. Can you provide examples of recent developments in the market?
June 2022: Bio-Rad Laboratories, Inc. launched the SEQuoia Express Stranded RNA Library Prep Kit. The kit provides biopharmaceutical and research scientists with an easy-to-use solution for constructing robust libraries to support efficient RNA-Sequencing workflows for comprehensive transcriptome profiling.
9. What pricing options are available for accessing the report?
Pricing options include single-user, multi-user, and enterprise licenses priced at USD 4750, USD 5250, and USD 8750 respectively.
10. Is the market size provided in terms of value or volume?
The market size is provided in terms of value, measured in billion and volume, measured in K Unit.
11. Are there any specific market keywords associated with the report?
Yes, the market keyword associated with the report is "RNA Analytics Industry," which aids in identifying and referencing the specific market segment covered.
12. How do I determine which pricing option suits my needs best?
The pricing options vary based on user requirements and access needs. Individual users may opt for single-user licenses, while businesses requiring broader access may choose multi-user or enterprise licenses for cost-effective access to the report.
13. Are there any additional resources or data provided in the RNA Analytics Industry report?
While the report offers comprehensive insights, it's advisable to review the specific contents or supplementary materials provided to ascertain if additional resources or data are available.
14. How can I stay updated on further developments or reports in the RNA Analytics Industry?
To stay informed about further developments, trends, and reports in the RNA Analytics Industry, consider subscribing to industry newsletters, following relevant companies and organizations, or regularly checking reputable industry news sources and publications.
Methodology
Step 1 - Identification of Relevant Samples Size from Population Database


Step 2 - Approaches for Defining Global Market Size (Value, Volume* & Price*)

Note*: In applicable scenarios
Step 3 - Data Sources
Primary Research
- Web Analytics
- Survey Reports
- Research Institute
- Latest Research Reports
- Opinion Leaders
Secondary Research
- Annual Reports
- White Paper
- Latest Press Release
- Industry Association
- Paid Database
- Investor Presentations

Step 4 - Data Triangulation
Involves using different sources of information in order to increase the validity of a study
These sources are likely to be stakeholders in a program - participants, other researchers, program staff, other community members, and so on.
Then we put all data in single framework & apply various statistical tools to find out the dynamic on the market.
During the analysis stage, feedback from the stakeholder groups would be compared to determine areas of agreement as well as areas of divergence