

Key Insights
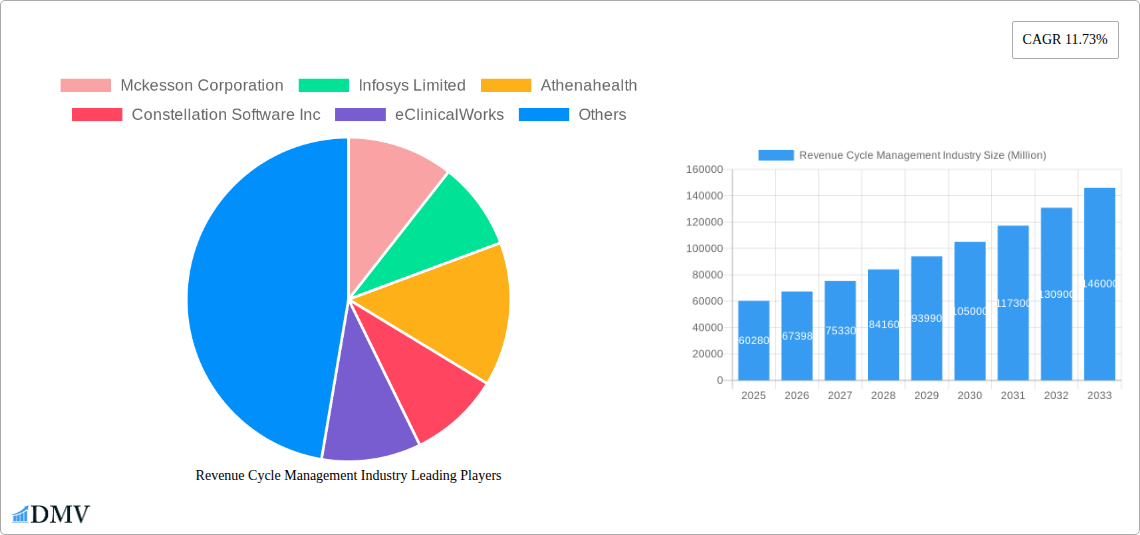
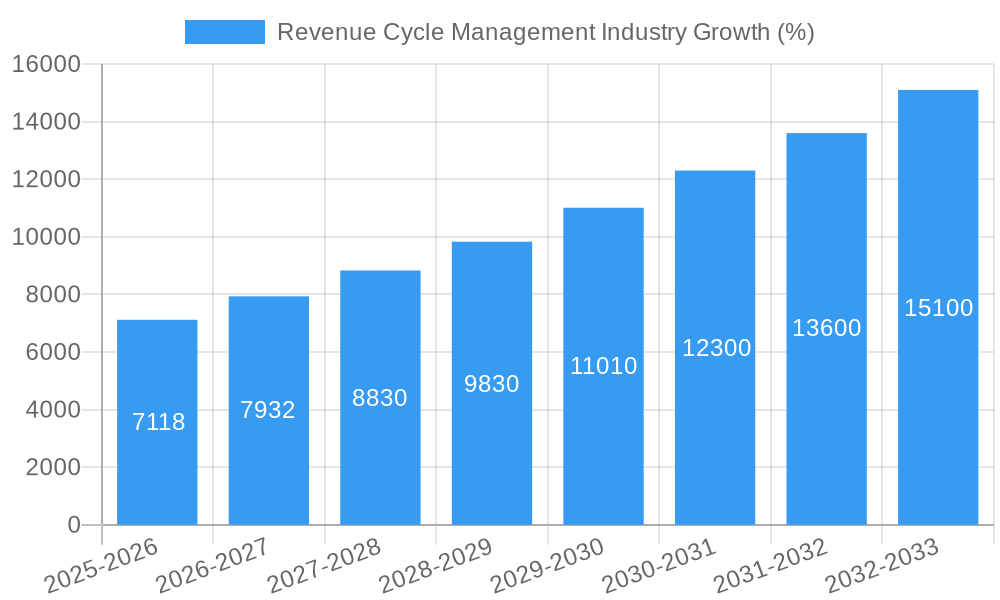
The Revenue Cycle Management (RCM) industry is experiencing robust growth, projected to reach a market size of $60.28 billion in 2025 and exhibiting a Compound Annual Growth Rate (CAGR) of 11.73%. This expansion is driven by several key factors. The increasing adoption of electronic health records (EHRs) and the rising demand for efficient healthcare billing and coding solutions are significantly contributing to market growth. Furthermore, the increasing focus on improving revenue cycle efficiency and reducing denials through advanced analytics and automation are key drivers. The shift towards cloud-based RCM solutions offers enhanced scalability, accessibility, and cost-effectiveness, further fueling market expansion. Hospitals and laboratories constitute the largest end-user segments, reflecting the critical role of efficient RCM in ensuring financial stability within healthcare organizations. Competition is fierce, with established players like McKesson, Epic Systems, and Athenahealth alongside emerging technology providers vying for market share. The industry is also witnessing a trend towards specialized RCM solutions catering to specific functions like claims and denial management and clinical documentation improvement (CDI).
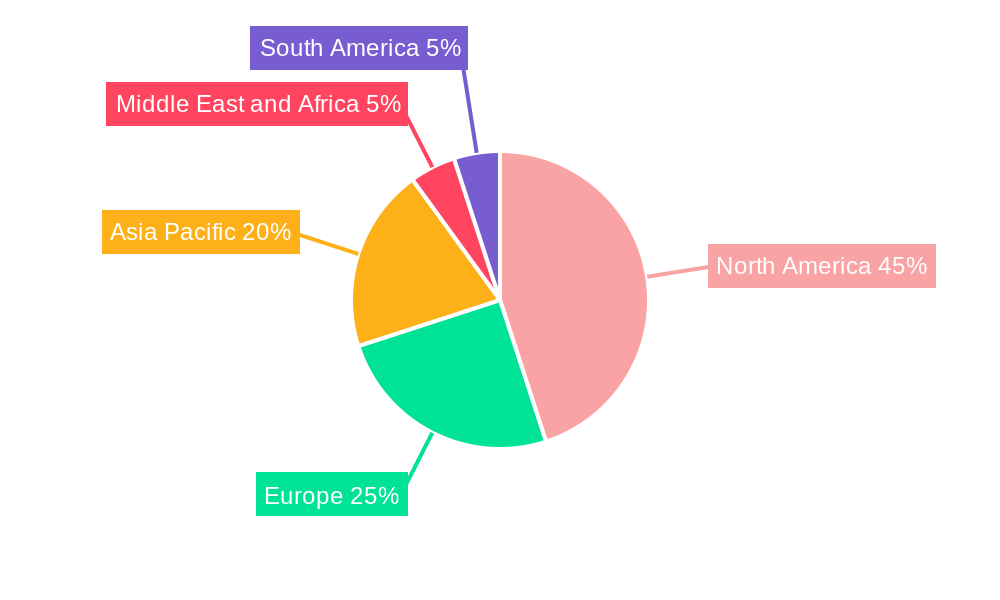
The geographical distribution of the RCM market reveals significant regional variations. North America currently holds the largest market share, driven by advanced healthcare infrastructure and the early adoption of technological advancements. However, Asia-Pacific is projected to experience rapid growth in the coming years, fueled by increasing healthcare spending and government initiatives promoting digital healthcare. Europe and other regions are also contributing to the overall market growth, although at a potentially slower pace compared to North America and Asia-Pacific. Continued regulatory changes and increasing cybersecurity concerns pose potential restraints on market growth. However, the ongoing investments in RCM technology and the focus on improving healthcare efficiency are expected to outweigh these challenges, driving sustained market expansion over the forecast period (2025-2033).
Revenue Cycle Management (RCM) Industry Report: 2019-2033
This comprehensive report provides an in-depth analysis of the global Revenue Cycle Management (RCM) industry, encompassing market trends, leading players, technological advancements, and future growth prospects. The study period covers 2019-2033, with a base year of 2025 and a forecast period of 2025-2033. The market is projected to reach $xx Million by 2033, showcasing significant growth opportunities for stakeholders.
Revenue Cycle Management Industry Market Composition & Trends
The global Revenue Cycle Management (RCM) market is characterized by a moderately concentrated landscape with key players like McKesson Corporation, Mckesson Corporation, Infosys Limited, Infosys Limited, Athenahealth, Athenahealth, Constellation Software Inc, eClinicalWorks, Epic Systems Corporation, R1 RCM Inc, Accenture, GeBBs, Veradigm LLC, Conifer Health Solutions LLC, and Oracle holding significant market share. Market concentration is influenced by factors such as technological capabilities, established client networks, and strategic acquisitions. Innovation is driven by the need for improved efficiency, reduced operational costs, and enhanced patient experience. The regulatory environment, particularly HIPAA compliance and evolving reimbursement policies, heavily shapes industry practices. Substitute products, including basic billing systems, pose limited competition due to the complex nature of RCM.
- Market Share Distribution (2024 Estimate): McKesson Corporation (15%), Infosys Limited (10%), Athenahealth (8%), Others (67%).
- M&A Activity (2019-2024): Total deal value estimated at $xx Million, with a noticeable increase in activity since 2021 driven by the need to scale operations and expand service offerings.
Revenue Cycle Management Industry Industry Evolution
The RCM industry has undergone significant transformation in recent years. The historical period (2019-2024) witnessed a Compound Annual Growth Rate (CAGR) of xx%, driven primarily by the increasing adoption of cloud-based solutions and the growing demand for improved revenue cycle management efficiencies. Technological advancements, including artificial intelligence (AI), machine learning (ML), and robotic process automation (RPA), are revolutionizing processes like claims processing and denial management. Consumer demands for faster and more convenient healthcare services have accelerated the adoption of digital and automated RCM solutions. The forecast period (2025-2033) is expected to see continued growth, with a projected CAGR of xx%, fueled by factors such as the increasing volume of healthcare data and the rising adoption of value-based care models. The adoption of cloud-based RCM solutions is expected to reach xx% by 2033, exceeding the adoption rate of on-premise solutions.
Leading Regions, Countries, or Segments in Revenue Cycle Management Industry
The North American RCM market holds the leading position, driven by factors such as advanced healthcare infrastructure, substantial investments in healthcare IT, and a favorable regulatory environment. Within North America, the United States commands the largest market share due to its sizable healthcare industry and high adoption of advanced RCM technologies.
Key Drivers of North American Dominance:
- High levels of private and public investment in healthcare IT.
- Stringent regulatory requirements driving the adoption of sophisticated RCM solutions.
- Strong presence of major RCM vendors and technology providers.
Leading Segments:
- By Deployment: Cloud-based solutions are experiencing rapid growth, owing to their scalability, cost-effectiveness, and accessibility. The cloud-based segment holds xx% of the market share as of 2024.
- By Function: Claims and denial management remains the largest segment, followed closely by medical coding and billing. The Clinical Documentation Improvement (CDI) segment is witnessing the fastest growth due to its importance in improving the accuracy of medical records and claim reimbursements.
Revenue Cycle Management Industry Product Innovations
Recent product innovations in the RCM space include AI-powered claims processing systems that significantly reduce manual intervention and improve accuracy, automated denial management tools that proactively identify and resolve claim denials, and integrated EHR systems that streamline data flow and reduce administrative overhead. These innovations offer enhanced automation, improved analytics, and reduced operational costs, thus increasing their unique selling propositions.
Propelling Factors for Revenue Cycle Management Industry Growth
The RCM market is experiencing robust growth due to several factors:
- Technological Advancements: The adoption of AI, ML, and RPA is automating processes, improving efficiency, and reducing costs.
- Increasing Healthcare Data Volume: The growth of electronic health records (EHRs) and the need for efficient data management are driving demand for sophisticated RCM solutions.
- Shift Towards Value-Based Care: RCM solutions play a crucial role in tracking performance and improving reimbursement under value-based care models.
- Government Regulations: Regulations focused on improving healthcare efficiency and reducing administrative burdens encourage RCM adoption.
Obstacles in the Revenue Cycle Management Industry Market
Several factors hinder the growth of the RCM market:
- High Implementation Costs: Implementing advanced RCM solutions requires significant upfront investment.
- Integration Challenges: Integrating RCM systems with existing healthcare IT infrastructure can be complex and time-consuming.
- Data Security Concerns: Protecting sensitive patient data is crucial and necessitates robust security measures.
- Lack of Skilled Personnel: A shortage of trained professionals in RCM can hinder the effective implementation and use of RCM solutions.
Future Opportunities in Revenue Cycle Management Industry
Future opportunities include:
- Expansion into Emerging Markets: Developing countries are increasingly investing in healthcare IT, creating opportunities for RCM providers.
- Advanced Analytics and Predictive Modeling: Using data analytics to predict claim denials and optimize revenue cycle processes.
- Increased focus on patient engagement: solutions providing improved patient communication and billing transparency.
- Blockchain technology: Utilizing Blockchain for secure and transparent data management in revenue cycle processes.
Major Players in the Revenue Cycle Management Industry Ecosystem
- Mckesson Corporation
- Infosys Limited
- Athenahealth
- Constellation Software Inc
- eClinicalWorks
- Epic Systems Corporation
- R1 RCM Inc
- Accenture
- GeBBs
- Veradigm LLC
- Conifer Health Solutions LLC
- Oracle
Key Developments in Revenue Cycle Management Industry Industry
- February 2024: Konwtian Health was awarded as the top healthcare revenue cycle management company in the United States by the Health Tech Outlook Magazine due to its innovative technological contributions to the advancement of healthcare administration. This highlights the growing importance of innovative technology in the RCM space.
- November 2023: Nym expanded its strengths to revenue cycle management solutions by helping hospitals and healthcare facilities automate medical coding for inpatient care. This demonstrates the increasing focus on automation within the RCM market.
Strategic Revenue Cycle Management Industry Market Forecast
The RCM market is poised for sustained growth driven by technological advancements, increasing healthcare data volumes, and the transition to value-based care. The continued adoption of cloud-based solutions, coupled with the integration of AI and ML capabilities, will create new opportunities for optimization and efficiency gains. The expanding use of RCM solutions across diverse healthcare settings will further fuel market expansion. Continued regulatory support for technology adoption within the healthcare sector will create further favorable conditions for robust growth in the forecast period.
Revenue Cycle Management Industry Segmentation
-
1. Deployment
- 1.1. Cloud-based
- 1.2. On-premise
-
2. Function
- 2.1. Claims and Denial Management
- 2.2. Medical Coding and Billing
- 2.3. Electronic Health Record (EHR)
- 2.4. Clinical Documentation Improvement (CDI)
- 2.5. Insurance
- 2.6. Other Functions
-
3. End User
- 3.1. Hospitals
- 3.2. Laboratories
- 3.3. Other End Users
Revenue Cycle Management Industry Segmentation By Geography
-
1. North America
- 1.1. United States
- 1.2. Canada
- 1.3. Mexico
-
2. Europe
- 2.1. Germany
- 2.2. United Kingdom
- 2.3. France
- 2.4. Italy
- 2.5. Spain
- 2.6. Rest of Europe
-
3. Asia Pacific
- 3.1. China
- 3.2. Japan
- 3.3. India
- 3.4. Australia
- 3.5. South Korea
- 3.6. Rest of Asia Pacific
-
4. Middle East and Africa
- 4.1. GCC
- 4.2. South Africa
- 4.3. Rest of Middle East and Africa
-
5. South America
- 5.1. Brazil
- 5.2. Argentina
- 5.3. Rest of South America
Revenue Cycle Management Industry REPORT HIGHLIGHTS
| Aspects | Details |
|---|---|
| Study Period | 2019-2033 |
| Base Year | 2024 |
| Estimated Year | 2025 |
| Forecast Period | 2025-2033 |
| Historical Period | 2019-2024 |
| Growth Rate | CAGR of 11.73% from 2019-2033 |
| Segmentation |
|
Table of Contents
- 1. Introduction
- 1.1. Research Scope
- 1.2. Market Segmentation
- 1.3. Research Methodology
- 1.4. Definitions and Assumptions
- 2. Executive Summary
- 2.1. Introduction
- 3. Market Dynamics
- 3.1. Introduction
- 3.2. Market Drivers
- 3.2.1. Government Initiatives to Boost the Adoption of RCM Solutions; Increasing Revenue Loss Due to Billing Errors; Process Improvements in Healthcare Organizations
- 3.3. Market Restrains
- 3.3.1. High Pricing and Maintenance of RCM Solutions; Lack of Proper IT Infrastructure
- 3.4. Market Trends
- 3.4.1. The Claims and Denial Management Segment is Expected to Witness Significant Growth Over the Forecast Period
- 4. Market Factor Analysis
- 4.1. Porters Five Forces
- 4.2. Supply/Value Chain
- 4.3. PESTEL analysis
- 4.4. Market Entropy
- 4.5. Patent/Trademark Analysis
- 5. Global Revenue Cycle Management Industry Analysis, Insights and Forecast, 2019-2031
- 5.1. Market Analysis, Insights and Forecast - by Deployment
- 5.1.1. Cloud-based
- 5.1.2. On-premise
- 5.2. Market Analysis, Insights and Forecast - by Function
- 5.2.1. Claims and Denial Management
- 5.2.2. Medical Coding and Billing
- 5.2.3. Electronic Health Record (EHR)
- 5.2.4. Clinical Documentation Improvement (CDI)
- 5.2.5. Insurance
- 5.2.6. Other Functions
- 5.3. Market Analysis, Insights and Forecast - by End User
- 5.3.1. Hospitals
- 5.3.2. Laboratories
- 5.3.3. Other End Users
- 5.4. Market Analysis, Insights and Forecast - by Region
- 5.4.1. North America
- 5.4.2. Europe
- 5.4.3. Asia Pacific
- 5.4.4. Middle East and Africa
- 5.4.5. South America
- 5.1. Market Analysis, Insights and Forecast - by Deployment
- 6. North America Revenue Cycle Management Industry Analysis, Insights and Forecast, 2019-2031
- 6.1. Market Analysis, Insights and Forecast - by Deployment
- 6.1.1. Cloud-based
- 6.1.2. On-premise
- 6.2. Market Analysis, Insights and Forecast - by Function
- 6.2.1. Claims and Denial Management
- 6.2.2. Medical Coding and Billing
- 6.2.3. Electronic Health Record (EHR)
- 6.2.4. Clinical Documentation Improvement (CDI)
- 6.2.5. Insurance
- 6.2.6. Other Functions
- 6.3. Market Analysis, Insights and Forecast - by End User
- 6.3.1. Hospitals
- 6.3.2. Laboratories
- 6.3.3. Other End Users
- 6.1. Market Analysis, Insights and Forecast - by Deployment
- 7. Europe Revenue Cycle Management Industry Analysis, Insights and Forecast, 2019-2031
- 7.1. Market Analysis, Insights and Forecast - by Deployment
- 7.1.1. Cloud-based
- 7.1.2. On-premise
- 7.2. Market Analysis, Insights and Forecast - by Function
- 7.2.1. Claims and Denial Management
- 7.2.2. Medical Coding and Billing
- 7.2.3. Electronic Health Record (EHR)
- 7.2.4. Clinical Documentation Improvement (CDI)
- 7.2.5. Insurance
- 7.2.6. Other Functions
- 7.3. Market Analysis, Insights and Forecast - by End User
- 7.3.1. Hospitals
- 7.3.2. Laboratories
- 7.3.3. Other End Users
- 7.1. Market Analysis, Insights and Forecast - by Deployment
- 8. Asia Pacific Revenue Cycle Management Industry Analysis, Insights and Forecast, 2019-2031
- 8.1. Market Analysis, Insights and Forecast - by Deployment
- 8.1.1. Cloud-based
- 8.1.2. On-premise
- 8.2. Market Analysis, Insights and Forecast - by Function
- 8.2.1. Claims and Denial Management
- 8.2.2. Medical Coding and Billing
- 8.2.3. Electronic Health Record (EHR)
- 8.2.4. Clinical Documentation Improvement (CDI)
- 8.2.5. Insurance
- 8.2.6. Other Functions
- 8.3. Market Analysis, Insights and Forecast - by End User
- 8.3.1. Hospitals
- 8.3.2. Laboratories
- 8.3.3. Other End Users
- 8.1. Market Analysis, Insights and Forecast - by Deployment
- 9. Middle East and Africa Revenue Cycle Management Industry Analysis, Insights and Forecast, 2019-2031
- 9.1. Market Analysis, Insights and Forecast - by Deployment
- 9.1.1. Cloud-based
- 9.1.2. On-premise
- 9.2. Market Analysis, Insights and Forecast - by Function
- 9.2.1. Claims and Denial Management
- 9.2.2. Medical Coding and Billing
- 9.2.3. Electronic Health Record (EHR)
- 9.2.4. Clinical Documentation Improvement (CDI)
- 9.2.5. Insurance
- 9.2.6. Other Functions
- 9.3. Market Analysis, Insights and Forecast - by End User
- 9.3.1. Hospitals
- 9.3.2. Laboratories
- 9.3.3. Other End Users
- 9.1. Market Analysis, Insights and Forecast - by Deployment
- 10. South America Revenue Cycle Management Industry Analysis, Insights and Forecast, 2019-2031
- 10.1. Market Analysis, Insights and Forecast - by Deployment
- 10.1.1. Cloud-based
- 10.1.2. On-premise
- 10.2. Market Analysis, Insights and Forecast - by Function
- 10.2.1. Claims and Denial Management
- 10.2.2. Medical Coding and Billing
- 10.2.3. Electronic Health Record (EHR)
- 10.2.4. Clinical Documentation Improvement (CDI)
- 10.2.5. Insurance
- 10.2.6. Other Functions
- 10.3. Market Analysis, Insights and Forecast - by End User
- 10.3.1. Hospitals
- 10.3.2. Laboratories
- 10.3.3. Other End Users
- 10.1. Market Analysis, Insights and Forecast - by Deployment
- 11. North America Revenue Cycle Management Industry Analysis, Insights and Forecast, 2019-2031
- 11.1. Market Analysis, Insights and Forecast - By Country/Sub-region
- 11.1.1 United States
- 11.1.2 Canada
- 11.1.3 Mexico
- 12. Europe Revenue Cycle Management Industry Analysis, Insights and Forecast, 2019-2031
- 12.1. Market Analysis, Insights and Forecast - By Country/Sub-region
- 12.1.1 Germany
- 12.1.2 United Kingdom
- 12.1.3 France
- 12.1.4 Italy
- 12.1.5 Spain
- 12.1.6 Rest of Europe
- 13. Asia Pacific Revenue Cycle Management Industry Analysis, Insights and Forecast, 2019-2031
- 13.1. Market Analysis, Insights and Forecast - By Country/Sub-region
- 13.1.1 China
- 13.1.2 Japan
- 13.1.3 India
- 13.1.4 Australia
- 13.1.5 South Korea
- 13.1.6 Rest of Asia Pacific
- 14. Middle East and Africa Revenue Cycle Management Industry Analysis, Insights and Forecast, 2019-2031
- 14.1. Market Analysis, Insights and Forecast - By Country/Sub-region
- 14.1.1 GCC
- 14.1.2 South Africa
- 14.1.3 Rest of Middle East and Africa
- 15. South America Revenue Cycle Management Industry Analysis, Insights and Forecast, 2019-2031
- 15.1. Market Analysis, Insights and Forecast - By Country/Sub-region
- 15.1.1 Brazil
- 15.1.2 Argentina
- 15.1.3 Rest of South America
- 16. Competitive Analysis
- 16.1. Global Market Share Analysis 2024
- 16.2. Company Profiles
- 16.2.1 Mckesson Corporation
- 16.2.1.1. Overview
- 16.2.1.2. Products
- 16.2.1.3. SWOT Analysis
- 16.2.1.4. Recent Developments
- 16.2.1.5. Financials (Based on Availability)
- 16.2.2 Infosys Limited
- 16.2.2.1. Overview
- 16.2.2.2. Products
- 16.2.2.3. SWOT Analysis
- 16.2.2.4. Recent Developments
- 16.2.2.5. Financials (Based on Availability)
- 16.2.3 Athenahealth
- 16.2.3.1. Overview
- 16.2.3.2. Products
- 16.2.3.3. SWOT Analysis
- 16.2.3.4. Recent Developments
- 16.2.3.5. Financials (Based on Availability)
- 16.2.4 Constellation Software Inc
- 16.2.4.1. Overview
- 16.2.4.2. Products
- 16.2.4.3. SWOT Analysis
- 16.2.4.4. Recent Developments
- 16.2.4.5. Financials (Based on Availability)
- 16.2.5 eClinicalWorks
- 16.2.5.1. Overview
- 16.2.5.2. Products
- 16.2.5.3. SWOT Analysis
- 16.2.5.4. Recent Developments
- 16.2.5.5. Financials (Based on Availability)
- 16.2.6 Epic Systems Corporation
- 16.2.6.1. Overview
- 16.2.6.2. Products
- 16.2.6.3. SWOT Analysis
- 16.2.6.4. Recent Developments
- 16.2.6.5. Financials (Based on Availability)
- 16.2.7 R1 RCM Inc
- 16.2.7.1. Overview
- 16.2.7.2. Products
- 16.2.7.3. SWOT Analysis
- 16.2.7.4. Recent Developments
- 16.2.7.5. Financials (Based on Availability)
- 16.2.8 Accenture
- 16.2.8.1. Overview
- 16.2.8.2. Products
- 16.2.8.3. SWOT Analysis
- 16.2.8.4. Recent Developments
- 16.2.8.5. Financials (Based on Availability)
- 16.2.9 GeBBs
- 16.2.9.1. Overview
- 16.2.9.2. Products
- 16.2.9.3. SWOT Analysis
- 16.2.9.4. Recent Developments
- 16.2.9.5. Financials (Based on Availability)
- 16.2.10 Veradigm LLC
- 16.2.10.1. Overview
- 16.2.10.2. Products
- 16.2.10.3. SWOT Analysis
- 16.2.10.4. Recent Developments
- 16.2.10.5. Financials (Based on Availability)
- 16.2.11 Conifer Health Solutions LLC
- 16.2.11.1. Overview
- 16.2.11.2. Products
- 16.2.11.3. SWOT Analysis
- 16.2.11.4. Recent Developments
- 16.2.11.5. Financials (Based on Availability)
- 16.2.12 Oracle
- 16.2.12.1. Overview
- 16.2.12.2. Products
- 16.2.12.3. SWOT Analysis
- 16.2.12.4. Recent Developments
- 16.2.12.5. Financials (Based on Availability)
- 16.2.1 Mckesson Corporation
List of Figures
- Figure 1: Global Revenue Cycle Management Industry Revenue Breakdown (Million, %) by Region 2024 & 2032
- Figure 2: North America Revenue Cycle Management Industry Revenue (Million), by Country 2024 & 2032
- Figure 3: North America Revenue Cycle Management Industry Revenue Share (%), by Country 2024 & 2032
- Figure 4: Europe Revenue Cycle Management Industry Revenue (Million), by Country 2024 & 2032
- Figure 5: Europe Revenue Cycle Management Industry Revenue Share (%), by Country 2024 & 2032
- Figure 6: Asia Pacific Revenue Cycle Management Industry Revenue (Million), by Country 2024 & 2032
- Figure 7: Asia Pacific Revenue Cycle Management Industry Revenue Share (%), by Country 2024 & 2032
- Figure 8: Middle East and Africa Revenue Cycle Management Industry Revenue (Million), by Country 2024 & 2032
- Figure 9: Middle East and Africa Revenue Cycle Management Industry Revenue Share (%), by Country 2024 & 2032
- Figure 10: South America Revenue Cycle Management Industry Revenue (Million), by Country 2024 & 2032
- Figure 11: South America Revenue Cycle Management Industry Revenue Share (%), by Country 2024 & 2032
- Figure 12: North America Revenue Cycle Management Industry Revenue (Million), by Deployment 2024 & 2032
- Figure 13: North America Revenue Cycle Management Industry Revenue Share (%), by Deployment 2024 & 2032
- Figure 14: North America Revenue Cycle Management Industry Revenue (Million), by Function 2024 & 2032
- Figure 15: North America Revenue Cycle Management Industry Revenue Share (%), by Function 2024 & 2032
- Figure 16: North America Revenue Cycle Management Industry Revenue (Million), by End User 2024 & 2032
- Figure 17: North America Revenue Cycle Management Industry Revenue Share (%), by End User 2024 & 2032
- Figure 18: North America Revenue Cycle Management Industry Revenue (Million), by Country 2024 & 2032
- Figure 19: North America Revenue Cycle Management Industry Revenue Share (%), by Country 2024 & 2032
- Figure 20: Europe Revenue Cycle Management Industry Revenue (Million), by Deployment 2024 & 2032
- Figure 21: Europe Revenue Cycle Management Industry Revenue Share (%), by Deployment 2024 & 2032
- Figure 22: Europe Revenue Cycle Management Industry Revenue (Million), by Function 2024 & 2032
- Figure 23: Europe Revenue Cycle Management Industry Revenue Share (%), by Function 2024 & 2032
- Figure 24: Europe Revenue Cycle Management Industry Revenue (Million), by End User 2024 & 2032
- Figure 25: Europe Revenue Cycle Management Industry Revenue Share (%), by End User 2024 & 2032
- Figure 26: Europe Revenue Cycle Management Industry Revenue (Million), by Country 2024 & 2032
- Figure 27: Europe Revenue Cycle Management Industry Revenue Share (%), by Country 2024 & 2032
- Figure 28: Asia Pacific Revenue Cycle Management Industry Revenue (Million), by Deployment 2024 & 2032
- Figure 29: Asia Pacific Revenue Cycle Management Industry Revenue Share (%), by Deployment 2024 & 2032
- Figure 30: Asia Pacific Revenue Cycle Management Industry Revenue (Million), by Function 2024 & 2032
- Figure 31: Asia Pacific Revenue Cycle Management Industry Revenue Share (%), by Function 2024 & 2032
- Figure 32: Asia Pacific Revenue Cycle Management Industry Revenue (Million), by End User 2024 & 2032
- Figure 33: Asia Pacific Revenue Cycle Management Industry Revenue Share (%), by End User 2024 & 2032
- Figure 34: Asia Pacific Revenue Cycle Management Industry Revenue (Million), by Country 2024 & 2032
- Figure 35: Asia Pacific Revenue Cycle Management Industry Revenue Share (%), by Country 2024 & 2032
- Figure 36: Middle East and Africa Revenue Cycle Management Industry Revenue (Million), by Deployment 2024 & 2032
- Figure 37: Middle East and Africa Revenue Cycle Management Industry Revenue Share (%), by Deployment 2024 & 2032
- Figure 38: Middle East and Africa Revenue Cycle Management Industry Revenue (Million), by Function 2024 & 2032
- Figure 39: Middle East and Africa Revenue Cycle Management Industry Revenue Share (%), by Function 2024 & 2032
- Figure 40: Middle East and Africa Revenue Cycle Management Industry Revenue (Million), by End User 2024 & 2032
- Figure 41: Middle East and Africa Revenue Cycle Management Industry Revenue Share (%), by End User 2024 & 2032
- Figure 42: Middle East and Africa Revenue Cycle Management Industry Revenue (Million), by Country 2024 & 2032
- Figure 43: Middle East and Africa Revenue Cycle Management Industry Revenue Share (%), by Country 2024 & 2032
- Figure 44: South America Revenue Cycle Management Industry Revenue (Million), by Deployment 2024 & 2032
- Figure 45: South America Revenue Cycle Management Industry Revenue Share (%), by Deployment 2024 & 2032
- Figure 46: South America Revenue Cycle Management Industry Revenue (Million), by Function 2024 & 2032
- Figure 47: South America Revenue Cycle Management Industry Revenue Share (%), by Function 2024 & 2032
- Figure 48: South America Revenue Cycle Management Industry Revenue (Million), by End User 2024 & 2032
- Figure 49: South America Revenue Cycle Management Industry Revenue Share (%), by End User 2024 & 2032
- Figure 50: South America Revenue Cycle Management Industry Revenue (Million), by Country 2024 & 2032
- Figure 51: South America Revenue Cycle Management Industry Revenue Share (%), by Country 2024 & 2032
List of Tables
- Table 1: Global Revenue Cycle Management Industry Revenue Million Forecast, by Region 2019 & 2032
- Table 2: Global Revenue Cycle Management Industry Revenue Million Forecast, by Deployment 2019 & 2032
- Table 3: Global Revenue Cycle Management Industry Revenue Million Forecast, by Function 2019 & 2032
- Table 4: Global Revenue Cycle Management Industry Revenue Million Forecast, by End User 2019 & 2032
- Table 5: Global Revenue Cycle Management Industry Revenue Million Forecast, by Region 2019 & 2032
- Table 6: Global Revenue Cycle Management Industry Revenue Million Forecast, by Country 2019 & 2032
- Table 7: United States Revenue Cycle Management Industry Revenue (Million) Forecast, by Application 2019 & 2032
- Table 8: Canada Revenue Cycle Management Industry Revenue (Million) Forecast, by Application 2019 & 2032
- Table 9: Mexico Revenue Cycle Management Industry Revenue (Million) Forecast, by Application 2019 & 2032
- Table 10: Global Revenue Cycle Management Industry Revenue Million Forecast, by Country 2019 & 2032
- Table 11: Germany Revenue Cycle Management Industry Revenue (Million) Forecast, by Application 2019 & 2032
- Table 12: United Kingdom Revenue Cycle Management Industry Revenue (Million) Forecast, by Application 2019 & 2032
- Table 13: France Revenue Cycle Management Industry Revenue (Million) Forecast, by Application 2019 & 2032
- Table 14: Italy Revenue Cycle Management Industry Revenue (Million) Forecast, by Application 2019 & 2032
- Table 15: Spain Revenue Cycle Management Industry Revenue (Million) Forecast, by Application 2019 & 2032
- Table 16: Rest of Europe Revenue Cycle Management Industry Revenue (Million) Forecast, by Application 2019 & 2032
- Table 17: Global Revenue Cycle Management Industry Revenue Million Forecast, by Country 2019 & 2032
- Table 18: China Revenue Cycle Management Industry Revenue (Million) Forecast, by Application 2019 & 2032
- Table 19: Japan Revenue Cycle Management Industry Revenue (Million) Forecast, by Application 2019 & 2032
- Table 20: India Revenue Cycle Management Industry Revenue (Million) Forecast, by Application 2019 & 2032
- Table 21: Australia Revenue Cycle Management Industry Revenue (Million) Forecast, by Application 2019 & 2032
- Table 22: South Korea Revenue Cycle Management Industry Revenue (Million) Forecast, by Application 2019 & 2032
- Table 23: Rest of Asia Pacific Revenue Cycle Management Industry Revenue (Million) Forecast, by Application 2019 & 2032
- Table 24: Global Revenue Cycle Management Industry Revenue Million Forecast, by Country 2019 & 2032
- Table 25: GCC Revenue Cycle Management Industry Revenue (Million) Forecast, by Application 2019 & 2032
- Table 26: South Africa Revenue Cycle Management Industry Revenue (Million) Forecast, by Application 2019 & 2032
- Table 27: Rest of Middle East and Africa Revenue Cycle Management Industry Revenue (Million) Forecast, by Application 2019 & 2032
- Table 28: Global Revenue Cycle Management Industry Revenue Million Forecast, by Country 2019 & 2032
- Table 29: Brazil Revenue Cycle Management Industry Revenue (Million) Forecast, by Application 2019 & 2032
- Table 30: Argentina Revenue Cycle Management Industry Revenue (Million) Forecast, by Application 2019 & 2032
- Table 31: Rest of South America Revenue Cycle Management Industry Revenue (Million) Forecast, by Application 2019 & 2032
- Table 32: Global Revenue Cycle Management Industry Revenue Million Forecast, by Deployment 2019 & 2032
- Table 33: Global Revenue Cycle Management Industry Revenue Million Forecast, by Function 2019 & 2032
- Table 34: Global Revenue Cycle Management Industry Revenue Million Forecast, by End User 2019 & 2032
- Table 35: Global Revenue Cycle Management Industry Revenue Million Forecast, by Country 2019 & 2032
- Table 36: United States Revenue Cycle Management Industry Revenue (Million) Forecast, by Application 2019 & 2032
- Table 37: Canada Revenue Cycle Management Industry Revenue (Million) Forecast, by Application 2019 & 2032
- Table 38: Mexico Revenue Cycle Management Industry Revenue (Million) Forecast, by Application 2019 & 2032
- Table 39: Global Revenue Cycle Management Industry Revenue Million Forecast, by Deployment 2019 & 2032
- Table 40: Global Revenue Cycle Management Industry Revenue Million Forecast, by Function 2019 & 2032
- Table 41: Global Revenue Cycle Management Industry Revenue Million Forecast, by End User 2019 & 2032
- Table 42: Global Revenue Cycle Management Industry Revenue Million Forecast, by Country 2019 & 2032
- Table 43: Germany Revenue Cycle Management Industry Revenue (Million) Forecast, by Application 2019 & 2032
- Table 44: United Kingdom Revenue Cycle Management Industry Revenue (Million) Forecast, by Application 2019 & 2032
- Table 45: France Revenue Cycle Management Industry Revenue (Million) Forecast, by Application 2019 & 2032
- Table 46: Italy Revenue Cycle Management Industry Revenue (Million) Forecast, by Application 2019 & 2032
- Table 47: Spain Revenue Cycle Management Industry Revenue (Million) Forecast, by Application 2019 & 2032
- Table 48: Rest of Europe Revenue Cycle Management Industry Revenue (Million) Forecast, by Application 2019 & 2032
- Table 49: Global Revenue Cycle Management Industry Revenue Million Forecast, by Deployment 2019 & 2032
- Table 50: Global Revenue Cycle Management Industry Revenue Million Forecast, by Function 2019 & 2032
- Table 51: Global Revenue Cycle Management Industry Revenue Million Forecast, by End User 2019 & 2032
- Table 52: Global Revenue Cycle Management Industry Revenue Million Forecast, by Country 2019 & 2032
- Table 53: China Revenue Cycle Management Industry Revenue (Million) Forecast, by Application 2019 & 2032
- Table 54: Japan Revenue Cycle Management Industry Revenue (Million) Forecast, by Application 2019 & 2032
- Table 55: India Revenue Cycle Management Industry Revenue (Million) Forecast, by Application 2019 & 2032
- Table 56: Australia Revenue Cycle Management Industry Revenue (Million) Forecast, by Application 2019 & 2032
- Table 57: South Korea Revenue Cycle Management Industry Revenue (Million) Forecast, by Application 2019 & 2032
- Table 58: Rest of Asia Pacific Revenue Cycle Management Industry Revenue (Million) Forecast, by Application 2019 & 2032
- Table 59: Global Revenue Cycle Management Industry Revenue Million Forecast, by Deployment 2019 & 2032
- Table 60: Global Revenue Cycle Management Industry Revenue Million Forecast, by Function 2019 & 2032
- Table 61: Global Revenue Cycle Management Industry Revenue Million Forecast, by End User 2019 & 2032
- Table 62: Global Revenue Cycle Management Industry Revenue Million Forecast, by Country 2019 & 2032
- Table 63: GCC Revenue Cycle Management Industry Revenue (Million) Forecast, by Application 2019 & 2032
- Table 64: South Africa Revenue Cycle Management Industry Revenue (Million) Forecast, by Application 2019 & 2032
- Table 65: Rest of Middle East and Africa Revenue Cycle Management Industry Revenue (Million) Forecast, by Application 2019 & 2032
- Table 66: Global Revenue Cycle Management Industry Revenue Million Forecast, by Deployment 2019 & 2032
- Table 67: Global Revenue Cycle Management Industry Revenue Million Forecast, by Function 2019 & 2032
- Table 68: Global Revenue Cycle Management Industry Revenue Million Forecast, by End User 2019 & 2032
- Table 69: Global Revenue Cycle Management Industry Revenue Million Forecast, by Country 2019 & 2032
- Table 70: Brazil Revenue Cycle Management Industry Revenue (Million) Forecast, by Application 2019 & 2032
- Table 71: Argentina Revenue Cycle Management Industry Revenue (Million) Forecast, by Application 2019 & 2032
- Table 72: Rest of South America Revenue Cycle Management Industry Revenue (Million) Forecast, by Application 2019 & 2032
Frequently Asked Questions
1. What is the projected Compound Annual Growth Rate (CAGR) of the Revenue Cycle Management Industry?
The projected CAGR is approximately 11.73%.
2. Which companies are prominent players in the Revenue Cycle Management Industry?
Key companies in the market include Mckesson Corporation, Infosys Limited, Athenahealth, Constellation Software Inc, eClinicalWorks, Epic Systems Corporation, R1 RCM Inc, Accenture, GeBBs, Veradigm LLC, Conifer Health Solutions LLC, Oracle.
3. What are the main segments of the Revenue Cycle Management Industry?
The market segments include Deployment, Function, End User.
4. Can you provide details about the market size?
The market size is estimated to be USD 60.28 Million as of 2022.
5. What are some drivers contributing to market growth?
Government Initiatives to Boost the Adoption of RCM Solutions; Increasing Revenue Loss Due to Billing Errors; Process Improvements in Healthcare Organizations.
6. What are the notable trends driving market growth?
The Claims and Denial Management Segment is Expected to Witness Significant Growth Over the Forecast Period.
7. Are there any restraints impacting market growth?
High Pricing and Maintenance of RCM Solutions; Lack of Proper IT Infrastructure.
8. Can you provide examples of recent developments in the market?
February 2024: Konwtian Health was awarded as the top healthcare revenue cycle management company in the United States by the Health Tech Outlook Magazine due to its innovative technological contributions to the advancement of healthcare administration.
9. What pricing options are available for accessing the report?
Pricing options include single-user, multi-user, and enterprise licenses priced at USD 4750, USD 5250, and USD 8750 respectively.
10. Is the market size provided in terms of value or volume?
The market size is provided in terms of value, measured in Million.
11. Are there any specific market keywords associated with the report?
Yes, the market keyword associated with the report is "Revenue Cycle Management Industry," which aids in identifying and referencing the specific market segment covered.
12. How do I determine which pricing option suits my needs best?
The pricing options vary based on user requirements and access needs. Individual users may opt for single-user licenses, while businesses requiring broader access may choose multi-user or enterprise licenses for cost-effective access to the report.
13. Are there any additional resources or data provided in the Revenue Cycle Management Industry report?
While the report offers comprehensive insights, it's advisable to review the specific contents or supplementary materials provided to ascertain if additional resources or data are available.
14. How can I stay updated on further developments or reports in the Revenue Cycle Management Industry?
To stay informed about further developments, trends, and reports in the Revenue Cycle Management Industry, consider subscribing to industry newsletters, following relevant companies and organizations, or regularly checking reputable industry news sources and publications.
Methodology
Step 1 - Identification of Relevant Samples Size from Population Database


Step 2 - Approaches for Defining Global Market Size (Value, Volume* & Price*)

Note*: In applicable scenarios
Step 3 - Data Sources
Primary Research
- Web Analytics
- Survey Reports
- Research Institute
- Latest Research Reports
- Opinion Leaders
Secondary Research
- Annual Reports
- White Paper
- Latest Press Release
- Industry Association
- Paid Database
- Investor Presentations

Step 4 - Data Triangulation
Involves using different sources of information in order to increase the validity of a study
These sources are likely to be stakeholders in a program - participants, other researchers, program staff, other community members, and so on.
Then we put all data in single framework & apply various statistical tools to find out the dynamic on the market.
During the analysis stage, feedback from the stakeholder groups would be compared to determine areas of agreement as well as areas of divergence
