

Key Insights
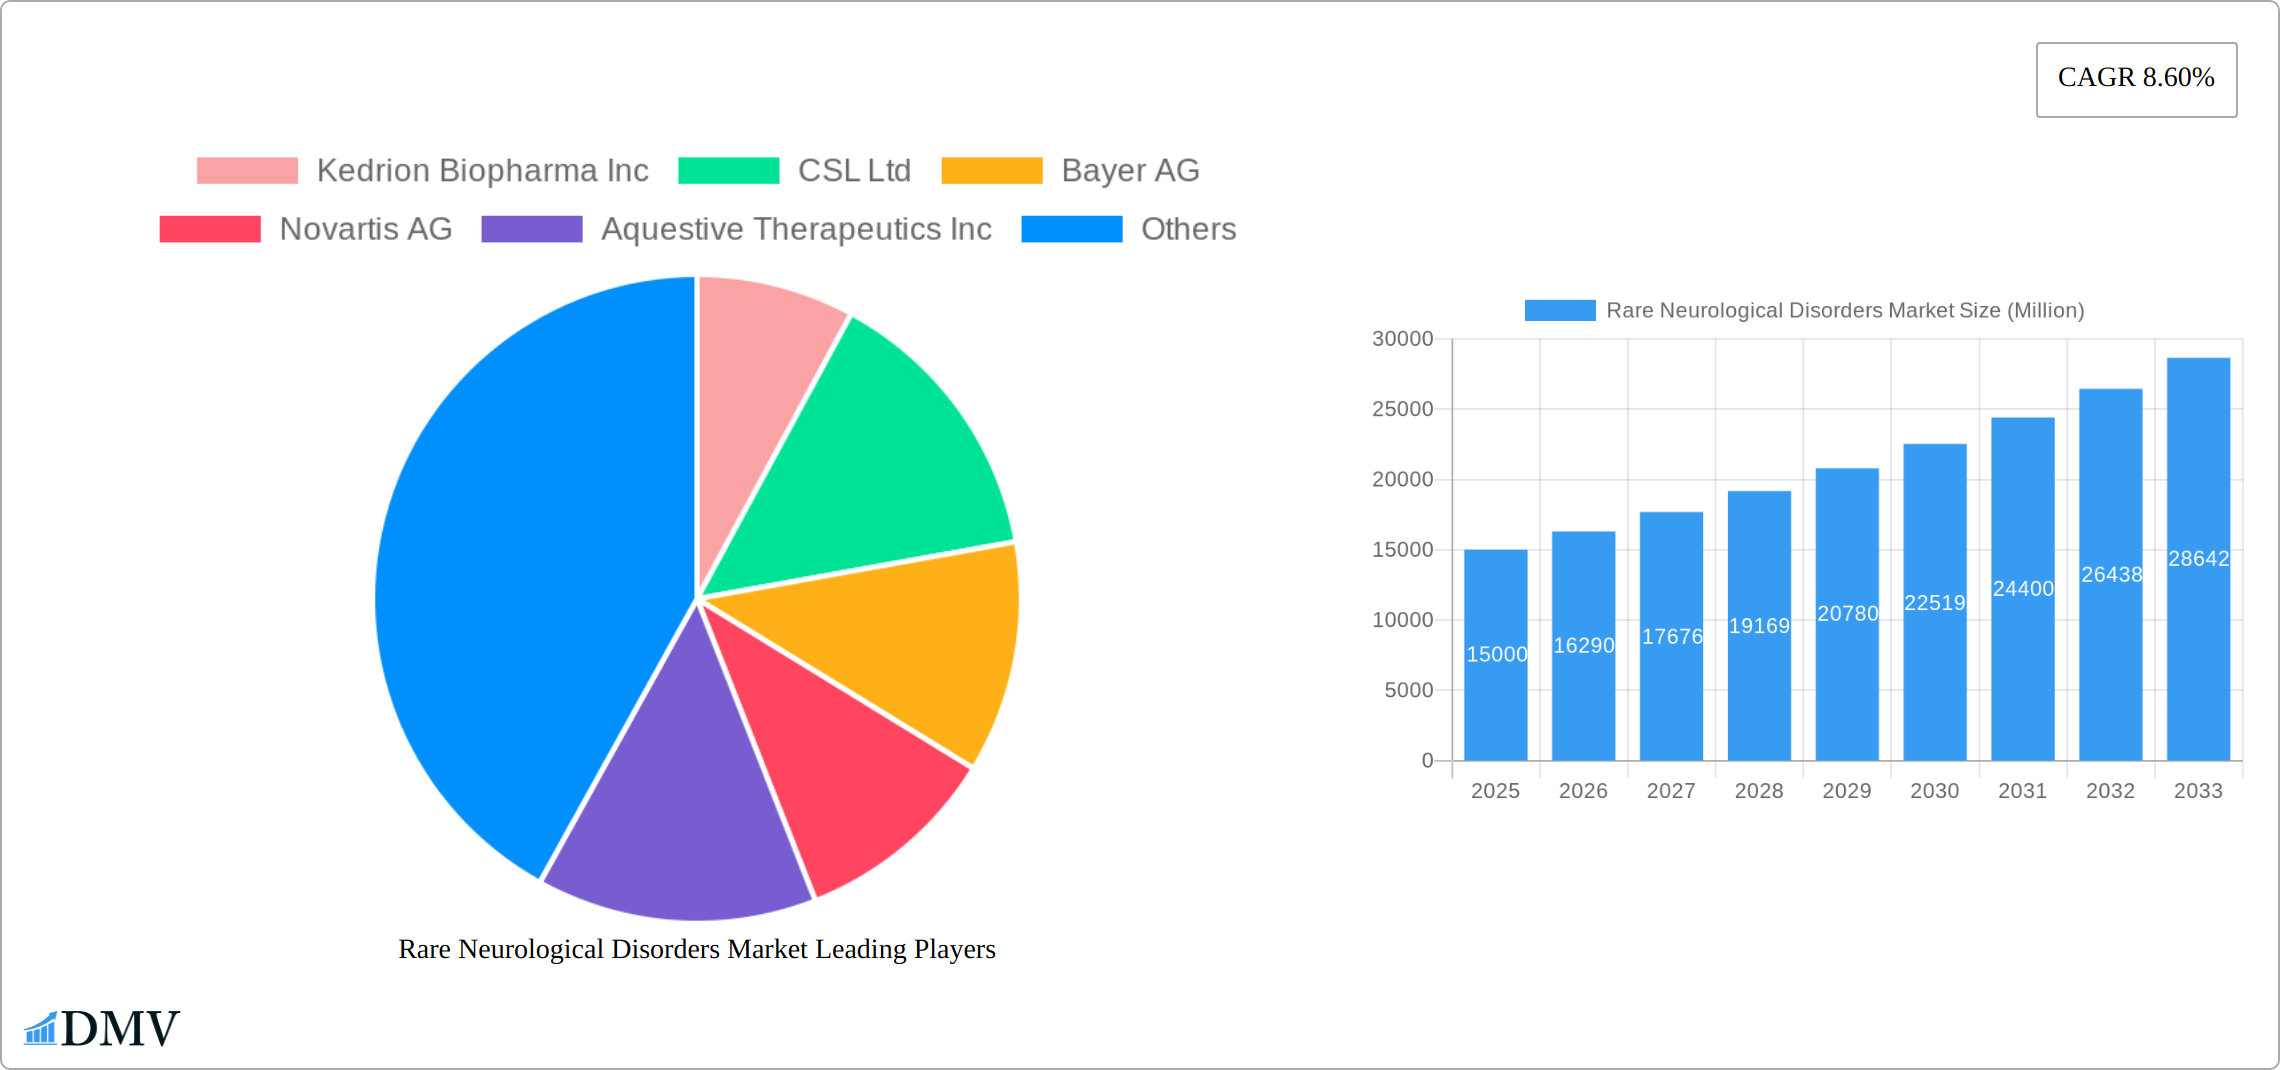
The Rare Neurological Disorders market, currently exhibiting robust growth, is projected to expand significantly over the forecast period (2025-2033). A CAGR of 8.60% indicates a substantial market expansion driven by several key factors. Increasing prevalence of rare neurological disorders, coupled with advancements in diagnostic technologies and therapeutic interventions, are major contributors to this growth. The rising awareness and improved access to specialized healthcare are also fueling market expansion. The market is segmented by drug type (biologics and small molecules) and mode of administration (intravenous and oral), reflecting the diversity of treatment approaches. Biologics, given their targeted nature, are likely to command a larger share of the market, while intravenous administration may be dominant due to the severity and nature of many rare neurological disorders requiring direct delivery. However, the development of more effective and convenient oral formulations is anticipated to drive growth in this segment. Geographic variations exist, with North America and Europe likely holding significant market shares initially due to established healthcare infrastructure and higher per capita spending on healthcare. However, emerging economies in Asia Pacific are projected to exhibit strong growth potential driven by increasing healthcare investments and rising disposable incomes.
Despite the market's growth trajectory, certain challenges persist. High research and development costs associated with developing treatments for rare diseases, coupled with the complexities of clinical trials and regulatory approvals, pose significant hurdles. Furthermore, the limited number of patients with each specific disorder can affect the profitability of novel therapies. To address this, increased public-private partnerships, targeted funding initiatives, and innovative pricing models are crucial. The market will also likely witness increased competition amongst established pharmaceutical giants like Novartis, Biogen, and Pfizer, along with smaller, specialized biotech companies focusing on innovative treatment approaches. This competitive landscape will accelerate innovation, improving treatment options and potentially lowering costs in the long run. The market's future outlook remains positive, underpinned by the continuous quest for effective therapies and improved quality of life for patients affected by these debilitating disorders.
Rare Neurological Disorders Market: A Comprehensive Report (2019-2033)
This insightful report offers a meticulous analysis of the Rare Neurological Disorders market, providing a comprehensive overview of its current state and future trajectory. Covering the period from 2019 to 2033, with a base year of 2025 and an estimated year of 2025, this report is an invaluable resource for stakeholders seeking to understand and capitalize on this dynamic market. The global Rare Neurological Disorders market is projected to reach xx Million by 2033, exhibiting a Compound Annual Growth Rate (CAGR) of xx% during the forecast period (2025-2033).
Rare Neurological Disorders Market Market Composition & Trends
The Rare Neurological Disorders market is characterized by a moderately concentrated landscape, with key players holding significant market share. Market share distribution amongst the top five players is estimated at xx%, reflecting a consolidated yet competitive environment. Innovation is a crucial driver, fueled by substantial R&D investments focused on novel therapies, particularly in gene therapy and biologics. The regulatory landscape, while stringent, is increasingly supportive of accelerated approvals for rare disease treatments, fostering market expansion. Substitute products are limited, given the specificity of these disorders, although supportive care therapies contribute to overall market size. End-users comprise hospitals, specialized clinics, and research institutions. M&A activity is prevalent, with notable deals in recent years exceeding xx Million in aggregate value. Specific examples include collaborations focused on gene therapy, further enhancing market growth potential.
- Market Concentration: Moderately concentrated, top 5 players holding xx% market share.
- Innovation Catalysts: Gene therapy, biologics, and targeted therapies.
- Regulatory Landscape: Supportive of accelerated approvals for rare diseases.
- Substitute Products: Limited, predominantly supportive care therapies.
- End-User Profile: Hospitals, specialized clinics, research institutions.
- M&A Activity: Significant, with deals exceeding xx Million in recent years.

Rare Neurological Disorders Market Industry Evolution
The Rare Neurological Disorders market has witnessed substantial evolution over the historical period (2019-2024), driven by several key factors. Technological advancements in diagnostics and therapeutics have played a pivotal role, enabling earlier diagnosis and more effective treatments. This has led to a significant increase in the number of patients receiving treatment and improved patient outcomes. The market has experienced robust growth, with a CAGR of xx% during the historical period. This growth has been influenced by rising prevalence of rare neurological disorders, increased healthcare spending, and growing awareness amongst both patients and healthcare professionals. Shifting consumer demands focus on personalized medicine and improved quality of life, further stimulating innovation within the industry. Adoption rates of new therapies are steadily increasing, particularly for newer, targeted treatment modalities. Increased government funding for research and development and orphan drug designations also serve to bolster the market's expansion trajectory.
Leading Regions, Countries, or Segments in Rare Neurological Disorders Market
The North American region currently dominates the Rare Neurological Disorders market, driven by factors such as high healthcare expenditure, a robust regulatory framework supportive of rare disease therapies, and strong research infrastructure.
- By Drug Type:
- Biologics: Dominates the market due to their high efficacy and targeted action in treating complex neurological disorders. Investment trends in this segment are exceptionally strong. Regulatory approvals are often faster compared to small molecules for rare diseases.
- Small Molecules: A smaller segment, but showing growth potential due to ongoing research and development efforts.
- By Mode of Administration:
- Intravenous: Prevalent due to the need for rapid delivery of treatment for severe conditions.
- Oral: Growing segment reflecting the preference for convenient and less invasive administration routes.
The dominance of North America stems from a combination of factors: high per capita healthcare spending, increased prevalence of rare neurological disorders, and a supportive regulatory environment. Furthermore, substantial R&D investments made by both public and private entities fuel innovation within the region, further cementing its leading position. European markets exhibit significant growth potential, driven by increasing healthcare budgets and evolving regulatory frameworks.
Rare Neurological Disorders Market Product Innovations
Recent years have witnessed significant innovations in rare neurological disorder treatments, focusing on targeted therapies, gene editing, and advanced drug delivery systems. Novel biologics are offering increased efficacy with improved safety profiles. Advances in personalized medicine allow for tailored treatment approaches based on individual genetic profiles and disease characteristics. These advancements are not only improving patient outcomes but are also creating a strong market for innovative therapies with significant unique selling propositions.
Propelling Factors for Rare Neurological Disorders Market Growth
Several factors are driving the growth of the Rare Neurological Disorders market. Technological advancements, particularly in gene therapy and personalized medicine, are enabling the development of more effective and targeted treatments. Increased awareness of these disorders, coupled with enhanced diagnostic capabilities, is leading to earlier diagnosis and improved patient outcomes. Furthermore, supportive regulatory frameworks, including orphan drug designations and accelerated approval pathways, are facilitating market entry for new therapies. Economic factors, including increasing healthcare spending and health insurance coverage, also contribute to market expansion.
Obstacles in the Rare Neurological Disorders Market Market
Despite its growth potential, the Rare Neurological Disorders market faces certain challenges. Stringent regulatory requirements and lengthy approval processes can delay market entry for new therapies. Supply chain disruptions can affect the availability of treatments, especially for specialized therapies. Furthermore, high treatment costs and limited insurance coverage can create access barriers for many patients. Competitive pressures among pharmaceutical companies are intense, leading to pricing pressures.
Future Opportunities in Rare Neurological Disorders Market
Future opportunities within the Rare Neurological Disorders market lie in the development of novel therapies targeting previously untreatable disorders. Advancements in gene editing technologies and artificial intelligence hold significant potential for personalized medicine. The expansion of market access in emerging economies represents a significant growth opportunity. Furthermore, the development of companion diagnostics can enable better selection of patients for targeted therapies, ultimately leading to improved patient outcomes and market expansion.
Major Players in the Rare Neurological Disorders Market Ecosystem
- Kedrion Biopharma Inc
- CSL Ltd
- Bayer AG
- Novartis AG
- Aquestive Therapeutics Inc
- US WorldMeds LLC (Solstice Neurosciences LLC)
- Merz Pharma GmbH & Co KGaA
- Teva Pharmaceutical Industries Ltd
- Merck & Co Inc (EMD Serono Inc)
- Biogen Inc
- F Hoffmann - La Roche Ltd
- Pfizer Inc
Key Developments in Rare Neurological Disorders Market Industry
- July 2021: Roche launched the prescription medicine Evrysdi in India, which is used for spinal muscular atrophy in adults and children aged two months and older. This significantly expanded access to treatment for this devastating disease.
- September 2021: NeuExcell Therapeutics and Spark Therapeutics entered a gene therapy collaboration to develop a safe and effective treatment for patients with Huntington's Disease (HD). This collaboration highlights the growing interest in gene therapy as a potential treatment for rare neurological disorders.
Strategic Rare Neurological Disorders Market Market Forecast
The Rare Neurological Disorders market is poised for significant growth over the forecast period (2025-2033). Continued innovation in drug development, particularly in gene therapy and personalized medicine, will drive market expansion. Increased awareness of these disorders and improved diagnostic capabilities will further fuel growth. Expanding market access in emerging economies and ongoing regulatory support for rare disease therapies will also contribute to the market's future potential. The market is expected to witness a robust CAGR, driven by unmet medical needs and advancements in scientific understanding of these complex disorders.
Rare Neurological Disorders Market Segmentation
-
1. Drug Type
- 1.1. Biologics
- 1.2. Small Molecules
-
2. Mode of Administration
- 2.1. Intravenous
- 2.2. Oral
Rare Neurological Disorders Market Segmentation By Geography
-
1. North America
- 1.1. United States
- 1.2. Canada
- 1.3. Mexico
-
2. Europe
- 2.1. Germany
- 2.2. United Kingdom
- 2.3. France
- 2.4. Italy
- 2.5. Spain
- 2.6. Rest of Europe
-
3. Asia Pacific
- 3.1. China
- 3.2. Japan
- 3.3. India
- 3.4. Australia
- 3.5. South Korea
- 3.6. Rest of Asia Pacific
-
4. Middle East and Africa
- 4.1. GCC
- 4.2. South Africa
- 4.3. Rest of Middle East and Africa
-
5. South America
- 5.1. Brazil
- 5.2. Argentina
- 5.3. Rest of South America

Rare Neurological Disorders Market REPORT HIGHLIGHTS
| Aspects | Details |
|---|---|
| Study Period | 2019-2033 |
| Base Year | 2024 |
| Estimated Year | 2025 |
| Forecast Period | 2025-2033 |
| Historical Period | 2019-2024 |
| Growth Rate | CAGR of 8.60% from 2019-2033 |
| Segmentation |
|
Table of Contents
- 1. Introduction
- 1.1. Research Scope
- 1.2. Market Segmentation
- 1.3. Research Methodology
- 1.4. Definitions and Assumptions
- 2. Executive Summary
- 2.1. Introduction
- 3. Market Dynamics
- 3.1. Introduction
- 3.2. Market Drivers
- 3.2.1. Increasing Prevalence of Rare Neurological Diseases; Promising Pipeline Drugs for Treatment of Rare Neurological Diseases; Favorable Government Policies Worldwide for Speeding up Diagnostic Processes
- 3.3. Market Restrains
- 3.3.1. High Cost of Rare Neurological Disease Treatment
- 3.4. Market Trends
- 3.4.1. The Small Molecules Segment is Expected to Hold a Major Share in the Rare Neurological Disease Treatment Market
- 4. Market Factor Analysis
- 4.1. Porters Five Forces
- 4.2. Supply/Value Chain
- 4.3. PESTEL analysis
- 4.4. Market Entropy
- 4.5. Patent/Trademark Analysis
- 5. Global Rare Neurological Disorders Market Analysis, Insights and Forecast, 2019-2031
- 5.1. Market Analysis, Insights and Forecast - by Drug Type
- 5.1.1. Biologics
- 5.1.2. Small Molecules
- 5.2. Market Analysis, Insights and Forecast - by Mode of Administration
- 5.2.1. Intravenous
- 5.2.2. Oral
- 5.3. Market Analysis, Insights and Forecast - by Region
- 5.3.1. North America
- 5.3.2. Europe
- 5.3.3. Asia Pacific
- 5.3.4. Middle East and Africa
- 5.3.5. South America
- 5.1. Market Analysis, Insights and Forecast - by Drug Type
- 6. North America Rare Neurological Disorders Market Analysis, Insights and Forecast, 2019-2031
- 6.1. Market Analysis, Insights and Forecast - by Drug Type
- 6.1.1. Biologics
- 6.1.2. Small Molecules
- 6.2. Market Analysis, Insights and Forecast - by Mode of Administration
- 6.2.1. Intravenous
- 6.2.2. Oral
- 6.1. Market Analysis, Insights and Forecast - by Drug Type
- 7. Europe Rare Neurological Disorders Market Analysis, Insights and Forecast, 2019-2031
- 7.1. Market Analysis, Insights and Forecast - by Drug Type
- 7.1.1. Biologics
- 7.1.2. Small Molecules
- 7.2. Market Analysis, Insights and Forecast - by Mode of Administration
- 7.2.1. Intravenous
- 7.2.2. Oral
- 7.1. Market Analysis, Insights and Forecast - by Drug Type
- 8. Asia Pacific Rare Neurological Disorders Market Analysis, Insights and Forecast, 2019-2031
- 8.1. Market Analysis, Insights and Forecast - by Drug Type
- 8.1.1. Biologics
- 8.1.2. Small Molecules
- 8.2. Market Analysis, Insights and Forecast - by Mode of Administration
- 8.2.1. Intravenous
- 8.2.2. Oral
- 8.1. Market Analysis, Insights and Forecast - by Drug Type
- 9. Middle East and Africa Rare Neurological Disorders Market Analysis, Insights and Forecast, 2019-2031
- 9.1. Market Analysis, Insights and Forecast - by Drug Type
- 9.1.1. Biologics
- 9.1.2. Small Molecules
- 9.2. Market Analysis, Insights and Forecast - by Mode of Administration
- 9.2.1. Intravenous
- 9.2.2. Oral
- 9.1. Market Analysis, Insights and Forecast - by Drug Type
- 10. South America Rare Neurological Disorders Market Analysis, Insights and Forecast, 2019-2031
- 10.1. Market Analysis, Insights and Forecast - by Drug Type
- 10.1.1. Biologics
- 10.1.2. Small Molecules
- 10.2. Market Analysis, Insights and Forecast - by Mode of Administration
- 10.2.1. Intravenous
- 10.2.2. Oral
- 10.1. Market Analysis, Insights and Forecast - by Drug Type
- 11. North America Rare Neurological Disorders Market Analysis, Insights and Forecast, 2019-2031
- 11.1. Market Analysis, Insights and Forecast - By Country/Sub-region
- 11.1.1 United States
- 11.1.2 Canada
- 11.1.3 Mexico
- 12. Europe Rare Neurological Disorders Market Analysis, Insights and Forecast, 2019-2031
- 12.1. Market Analysis, Insights and Forecast - By Country/Sub-region
- 12.1.1 Germany
- 12.1.2 United Kingdom
- 12.1.3 France
- 12.1.4 Italy
- 12.1.5 Spain
- 12.1.6 Rest of Europe
- 13. Asia Pacific Rare Neurological Disorders Market Analysis, Insights and Forecast, 2019-2031
- 13.1. Market Analysis, Insights and Forecast - By Country/Sub-region
- 13.1.1 China
- 13.1.2 Japan
- 13.1.3 India
- 13.1.4 Australia
- 13.1.5 South Korea
- 13.1.6 Rest of Asia Pacific
- 14. Middle East and Africa Rare Neurological Disorders Market Analysis, Insights and Forecast, 2019-2031
- 14.1. Market Analysis, Insights and Forecast - By Country/Sub-region
- 14.1.1 GCC
- 14.1.2 South Africa
- 14.1.3 Rest of Middle East and Africa
- 15. South America Rare Neurological Disorders Market Analysis, Insights and Forecast, 2019-2031
- 15.1. Market Analysis, Insights and Forecast - By Country/Sub-region
- 15.1.1 Brazil
- 15.1.2 Argentina
- 15.1.3 Rest of South America
- 16. Competitive Analysis
- 16.1. Global Market Share Analysis 2024
- 16.2. Company Profiles
- 16.2.1 Kedrion Biopharma Inc
- 16.2.1.1. Overview
- 16.2.1.2. Products
- 16.2.1.3. SWOT Analysis
- 16.2.1.4. Recent Developments
- 16.2.1.5. Financials (Based on Availability)
- 16.2.2 CSL Ltd
- 16.2.2.1. Overview
- 16.2.2.2. Products
- 16.2.2.3. SWOT Analysis
- 16.2.2.4. Recent Developments
- 16.2.2.5. Financials (Based on Availability)
- 16.2.3 Bayer AG
- 16.2.3.1. Overview
- 16.2.3.2. Products
- 16.2.3.3. SWOT Analysis
- 16.2.3.4. Recent Developments
- 16.2.3.5. Financials (Based on Availability)
- 16.2.4 Novartis AG
- 16.2.4.1. Overview
- 16.2.4.2. Products
- 16.2.4.3. SWOT Analysis
- 16.2.4.4. Recent Developments
- 16.2.4.5. Financials (Based on Availability)
- 16.2.5 Aquestive Therapeutics Inc
- 16.2.5.1. Overview
- 16.2.5.2. Products
- 16.2.5.3. SWOT Analysis
- 16.2.5.4. Recent Developments
- 16.2.5.5. Financials (Based on Availability)
- 16.2.6 US WorldMeds LLC (Solstice Neurosciences LLC)
- 16.2.6.1. Overview
- 16.2.6.2. Products
- 16.2.6.3. SWOT Analysis
- 16.2.6.4. Recent Developments
- 16.2.6.5. Financials (Based on Availability)
- 16.2.7 Merz Pharma GmbH & Co KGaA
- 16.2.7.1. Overview
- 16.2.7.2. Products
- 16.2.7.3. SWOT Analysis
- 16.2.7.4. Recent Developments
- 16.2.7.5. Financials (Based on Availability)
- 16.2.8 Teva Pharmaceutical Industries Ltd
- 16.2.8.1. Overview
- 16.2.8.2. Products
- 16.2.8.3. SWOT Analysis
- 16.2.8.4. Recent Developments
- 16.2.8.5. Financials (Based on Availability)
- 16.2.9 Merck & Co Inc (EMD Serono Inc )
- 16.2.9.1. Overview
- 16.2.9.2. Products
- 16.2.9.3. SWOT Analysis
- 16.2.9.4. Recent Developments
- 16.2.9.5. Financials (Based on Availability)
- 16.2.10 Biogen Inc
- 16.2.10.1. Overview
- 16.2.10.2. Products
- 16.2.10.3. SWOT Analysis
- 16.2.10.4. Recent Developments
- 16.2.10.5. Financials (Based on Availability)
- 16.2.11 F Hoffmann - La Roche Ltd
- 16.2.11.1. Overview
- 16.2.11.2. Products
- 16.2.11.3. SWOT Analysis
- 16.2.11.4. Recent Developments
- 16.2.11.5. Financials (Based on Availability)
- 16.2.12 Pfizer Inc
- 16.2.12.1. Overview
- 16.2.12.2. Products
- 16.2.12.3. SWOT Analysis
- 16.2.12.4. Recent Developments
- 16.2.12.5. Financials (Based on Availability)
- 16.2.1 Kedrion Biopharma Inc
List of Figures
- Figure 1: Global Rare Neurological Disorders Market Revenue Breakdown (Million, %) by Region 2024 & 2032
- Figure 2: Global Rare Neurological Disorders Market Volume Breakdown (K Unit, %) by Region 2024 & 2032
- Figure 3: North America Rare Neurological Disorders Market Revenue (Million), by Country 2024 & 2032
- Figure 4: North America Rare Neurological Disorders Market Volume (K Unit), by Country 2024 & 2032
- Figure 5: North America Rare Neurological Disorders Market Revenue Share (%), by Country 2024 & 2032
- Figure 6: North America Rare Neurological Disorders Market Volume Share (%), by Country 2024 & 2032
- Figure 7: Europe Rare Neurological Disorders Market Revenue (Million), by Country 2024 & 2032
- Figure 8: Europe Rare Neurological Disorders Market Volume (K Unit), by Country 2024 & 2032
- Figure 9: Europe Rare Neurological Disorders Market Revenue Share (%), by Country 2024 & 2032
- Figure 10: Europe Rare Neurological Disorders Market Volume Share (%), by Country 2024 & 2032
- Figure 11: Asia Pacific Rare Neurological Disorders Market Revenue (Million), by Country 2024 & 2032
- Figure 12: Asia Pacific Rare Neurological Disorders Market Volume (K Unit), by Country 2024 & 2032
- Figure 13: Asia Pacific Rare Neurological Disorders Market Revenue Share (%), by Country 2024 & 2032
- Figure 14: Asia Pacific Rare Neurological Disorders Market Volume Share (%), by Country 2024 & 2032
- Figure 15: Middle East and Africa Rare Neurological Disorders Market Revenue (Million), by Country 2024 & 2032
- Figure 16: Middle East and Africa Rare Neurological Disorders Market Volume (K Unit), by Country 2024 & 2032
- Figure 17: Middle East and Africa Rare Neurological Disorders Market Revenue Share (%), by Country 2024 & 2032
- Figure 18: Middle East and Africa Rare Neurological Disorders Market Volume Share (%), by Country 2024 & 2032
- Figure 19: South America Rare Neurological Disorders Market Revenue (Million), by Country 2024 & 2032
- Figure 20: South America Rare Neurological Disorders Market Volume (K Unit), by Country 2024 & 2032
- Figure 21: South America Rare Neurological Disorders Market Revenue Share (%), by Country 2024 & 2032
- Figure 22: South America Rare Neurological Disorders Market Volume Share (%), by Country 2024 & 2032
- Figure 23: North America Rare Neurological Disorders Market Revenue (Million), by Drug Type 2024 & 2032
- Figure 24: North America Rare Neurological Disorders Market Volume (K Unit), by Drug Type 2024 & 2032
- Figure 25: North America Rare Neurological Disorders Market Revenue Share (%), by Drug Type 2024 & 2032
- Figure 26: North America Rare Neurological Disorders Market Volume Share (%), by Drug Type 2024 & 2032
- Figure 27: North America Rare Neurological Disorders Market Revenue (Million), by Mode of Administration 2024 & 2032
- Figure 28: North America Rare Neurological Disorders Market Volume (K Unit), by Mode of Administration 2024 & 2032
- Figure 29: North America Rare Neurological Disorders Market Revenue Share (%), by Mode of Administration 2024 & 2032
- Figure 30: North America Rare Neurological Disorders Market Volume Share (%), by Mode of Administration 2024 & 2032
- Figure 31: North America Rare Neurological Disorders Market Revenue (Million), by Country 2024 & 2032
- Figure 32: North America Rare Neurological Disorders Market Volume (K Unit), by Country 2024 & 2032
- Figure 33: North America Rare Neurological Disorders Market Revenue Share (%), by Country 2024 & 2032
- Figure 34: North America Rare Neurological Disorders Market Volume Share (%), by Country 2024 & 2032
- Figure 35: Europe Rare Neurological Disorders Market Revenue (Million), by Drug Type 2024 & 2032
- Figure 36: Europe Rare Neurological Disorders Market Volume (K Unit), by Drug Type 2024 & 2032
- Figure 37: Europe Rare Neurological Disorders Market Revenue Share (%), by Drug Type 2024 & 2032
- Figure 38: Europe Rare Neurological Disorders Market Volume Share (%), by Drug Type 2024 & 2032
- Figure 39: Europe Rare Neurological Disorders Market Revenue (Million), by Mode of Administration 2024 & 2032
- Figure 40: Europe Rare Neurological Disorders Market Volume (K Unit), by Mode of Administration 2024 & 2032
- Figure 41: Europe Rare Neurological Disorders Market Revenue Share (%), by Mode of Administration 2024 & 2032
- Figure 42: Europe Rare Neurological Disorders Market Volume Share (%), by Mode of Administration 2024 & 2032
- Figure 43: Europe Rare Neurological Disorders Market Revenue (Million), by Country 2024 & 2032
- Figure 44: Europe Rare Neurological Disorders Market Volume (K Unit), by Country 2024 & 2032
- Figure 45: Europe Rare Neurological Disorders Market Revenue Share (%), by Country 2024 & 2032
- Figure 46: Europe Rare Neurological Disorders Market Volume Share (%), by Country 2024 & 2032
- Figure 47: Asia Pacific Rare Neurological Disorders Market Revenue (Million), by Drug Type 2024 & 2032
- Figure 48: Asia Pacific Rare Neurological Disorders Market Volume (K Unit), by Drug Type 2024 & 2032
- Figure 49: Asia Pacific Rare Neurological Disorders Market Revenue Share (%), by Drug Type 2024 & 2032
- Figure 50: Asia Pacific Rare Neurological Disorders Market Volume Share (%), by Drug Type 2024 & 2032
- Figure 51: Asia Pacific Rare Neurological Disorders Market Revenue (Million), by Mode of Administration 2024 & 2032
- Figure 52: Asia Pacific Rare Neurological Disorders Market Volume (K Unit), by Mode of Administration 2024 & 2032
- Figure 53: Asia Pacific Rare Neurological Disorders Market Revenue Share (%), by Mode of Administration 2024 & 2032
- Figure 54: Asia Pacific Rare Neurological Disorders Market Volume Share (%), by Mode of Administration 2024 & 2032
- Figure 55: Asia Pacific Rare Neurological Disorders Market Revenue (Million), by Country 2024 & 2032
- Figure 56: Asia Pacific Rare Neurological Disorders Market Volume (K Unit), by Country 2024 & 2032
- Figure 57: Asia Pacific Rare Neurological Disorders Market Revenue Share (%), by Country 2024 & 2032
- Figure 58: Asia Pacific Rare Neurological Disorders Market Volume Share (%), by Country 2024 & 2032
- Figure 59: Middle East and Africa Rare Neurological Disorders Market Revenue (Million), by Drug Type 2024 & 2032
- Figure 60: Middle East and Africa Rare Neurological Disorders Market Volume (K Unit), by Drug Type 2024 & 2032
- Figure 61: Middle East and Africa Rare Neurological Disorders Market Revenue Share (%), by Drug Type 2024 & 2032
- Figure 62: Middle East and Africa Rare Neurological Disorders Market Volume Share (%), by Drug Type 2024 & 2032
- Figure 63: Middle East and Africa Rare Neurological Disorders Market Revenue (Million), by Mode of Administration 2024 & 2032
- Figure 64: Middle East and Africa Rare Neurological Disorders Market Volume (K Unit), by Mode of Administration 2024 & 2032
- Figure 65: Middle East and Africa Rare Neurological Disorders Market Revenue Share (%), by Mode of Administration 2024 & 2032
- Figure 66: Middle East and Africa Rare Neurological Disorders Market Volume Share (%), by Mode of Administration 2024 & 2032
- Figure 67: Middle East and Africa Rare Neurological Disorders Market Revenue (Million), by Country 2024 & 2032
- Figure 68: Middle East and Africa Rare Neurological Disorders Market Volume (K Unit), by Country 2024 & 2032
- Figure 69: Middle East and Africa Rare Neurological Disorders Market Revenue Share (%), by Country 2024 & 2032
- Figure 70: Middle East and Africa Rare Neurological Disorders Market Volume Share (%), by Country 2024 & 2032
- Figure 71: South America Rare Neurological Disorders Market Revenue (Million), by Drug Type 2024 & 2032
- Figure 72: South America Rare Neurological Disorders Market Volume (K Unit), by Drug Type 2024 & 2032
- Figure 73: South America Rare Neurological Disorders Market Revenue Share (%), by Drug Type 2024 & 2032
- Figure 74: South America Rare Neurological Disorders Market Volume Share (%), by Drug Type 2024 & 2032
- Figure 75: South America Rare Neurological Disorders Market Revenue (Million), by Mode of Administration 2024 & 2032
- Figure 76: South America Rare Neurological Disorders Market Volume (K Unit), by Mode of Administration 2024 & 2032
- Figure 77: South America Rare Neurological Disorders Market Revenue Share (%), by Mode of Administration 2024 & 2032
- Figure 78: South America Rare Neurological Disorders Market Volume Share (%), by Mode of Administration 2024 & 2032
- Figure 79: South America Rare Neurological Disorders Market Revenue (Million), by Country 2024 & 2032
- Figure 80: South America Rare Neurological Disorders Market Volume (K Unit), by Country 2024 & 2032
- Figure 81: South America Rare Neurological Disorders Market Revenue Share (%), by Country 2024 & 2032
- Figure 82: South America Rare Neurological Disorders Market Volume Share (%), by Country 2024 & 2032
List of Tables
- Table 1: Global Rare Neurological Disorders Market Revenue Million Forecast, by Region 2019 & 2032
- Table 2: Global Rare Neurological Disorders Market Volume K Unit Forecast, by Region 2019 & 2032
- Table 3: Global Rare Neurological Disorders Market Revenue Million Forecast, by Drug Type 2019 & 2032
- Table 4: Global Rare Neurological Disorders Market Volume K Unit Forecast, by Drug Type 2019 & 2032
- Table 5: Global Rare Neurological Disorders Market Revenue Million Forecast, by Mode of Administration 2019 & 2032
- Table 6: Global Rare Neurological Disorders Market Volume K Unit Forecast, by Mode of Administration 2019 & 2032
- Table 7: Global Rare Neurological Disorders Market Revenue Million Forecast, by Region 2019 & 2032
- Table 8: Global Rare Neurological Disorders Market Volume K Unit Forecast, by Region 2019 & 2032
- Table 9: Global Rare Neurological Disorders Market Revenue Million Forecast, by Country 2019 & 2032
- Table 10: Global Rare Neurological Disorders Market Volume K Unit Forecast, by Country 2019 & 2032
- Table 11: United States Rare Neurological Disorders Market Revenue (Million) Forecast, by Application 2019 & 2032
- Table 12: United States Rare Neurological Disorders Market Volume (K Unit) Forecast, by Application 2019 & 2032
- Table 13: Canada Rare Neurological Disorders Market Revenue (Million) Forecast, by Application 2019 & 2032
- Table 14: Canada Rare Neurological Disorders Market Volume (K Unit) Forecast, by Application 2019 & 2032
- Table 15: Mexico Rare Neurological Disorders Market Revenue (Million) Forecast, by Application 2019 & 2032
- Table 16: Mexico Rare Neurological Disorders Market Volume (K Unit) Forecast, by Application 2019 & 2032
- Table 17: Global Rare Neurological Disorders Market Revenue Million Forecast, by Country 2019 & 2032
- Table 18: Global Rare Neurological Disorders Market Volume K Unit Forecast, by Country 2019 & 2032
- Table 19: Germany Rare Neurological Disorders Market Revenue (Million) Forecast, by Application 2019 & 2032
- Table 20: Germany Rare Neurological Disorders Market Volume (K Unit) Forecast, by Application 2019 & 2032
- Table 21: United Kingdom Rare Neurological Disorders Market Revenue (Million) Forecast, by Application 2019 & 2032
- Table 22: United Kingdom Rare Neurological Disorders Market Volume (K Unit) Forecast, by Application 2019 & 2032
- Table 23: France Rare Neurological Disorders Market Revenue (Million) Forecast, by Application 2019 & 2032
- Table 24: France Rare Neurological Disorders Market Volume (K Unit) Forecast, by Application 2019 & 2032
- Table 25: Italy Rare Neurological Disorders Market Revenue (Million) Forecast, by Application 2019 & 2032
- Table 26: Italy Rare Neurological Disorders Market Volume (K Unit) Forecast, by Application 2019 & 2032
- Table 27: Spain Rare Neurological Disorders Market Revenue (Million) Forecast, by Application 2019 & 2032
- Table 28: Spain Rare Neurological Disorders Market Volume (K Unit) Forecast, by Application 2019 & 2032
- Table 29: Rest of Europe Rare Neurological Disorders Market Revenue (Million) Forecast, by Application 2019 & 2032
- Table 30: Rest of Europe Rare Neurological Disorders Market Volume (K Unit) Forecast, by Application 2019 & 2032
- Table 31: Global Rare Neurological Disorders Market Revenue Million Forecast, by Country 2019 & 2032
- Table 32: Global Rare Neurological Disorders Market Volume K Unit Forecast, by Country 2019 & 2032
- Table 33: China Rare Neurological Disorders Market Revenue (Million) Forecast, by Application 2019 & 2032
- Table 34: China Rare Neurological Disorders Market Volume (K Unit) Forecast, by Application 2019 & 2032
- Table 35: Japan Rare Neurological Disorders Market Revenue (Million) Forecast, by Application 2019 & 2032
- Table 36: Japan Rare Neurological Disorders Market Volume (K Unit) Forecast, by Application 2019 & 2032
- Table 37: India Rare Neurological Disorders Market Revenue (Million) Forecast, by Application 2019 & 2032
- Table 38: India Rare Neurological Disorders Market Volume (K Unit) Forecast, by Application 2019 & 2032
- Table 39: Australia Rare Neurological Disorders Market Revenue (Million) Forecast, by Application 2019 & 2032
- Table 40: Australia Rare Neurological Disorders Market Volume (K Unit) Forecast, by Application 2019 & 2032
- Table 41: South Korea Rare Neurological Disorders Market Revenue (Million) Forecast, by Application 2019 & 2032
- Table 42: South Korea Rare Neurological Disorders Market Volume (K Unit) Forecast, by Application 2019 & 2032
- Table 43: Rest of Asia Pacific Rare Neurological Disorders Market Revenue (Million) Forecast, by Application 2019 & 2032
- Table 44: Rest of Asia Pacific Rare Neurological Disorders Market Volume (K Unit) Forecast, by Application 2019 & 2032
- Table 45: Global Rare Neurological Disorders Market Revenue Million Forecast, by Country 2019 & 2032
- Table 46: Global Rare Neurological Disorders Market Volume K Unit Forecast, by Country 2019 & 2032
- Table 47: GCC Rare Neurological Disorders Market Revenue (Million) Forecast, by Application 2019 & 2032
- Table 48: GCC Rare Neurological Disorders Market Volume (K Unit) Forecast, by Application 2019 & 2032
- Table 49: South Africa Rare Neurological Disorders Market Revenue (Million) Forecast, by Application 2019 & 2032
- Table 50: South Africa Rare Neurological Disorders Market Volume (K Unit) Forecast, by Application 2019 & 2032
- Table 51: Rest of Middle East and Africa Rare Neurological Disorders Market Revenue (Million) Forecast, by Application 2019 & 2032
- Table 52: Rest of Middle East and Africa Rare Neurological Disorders Market Volume (K Unit) Forecast, by Application 2019 & 2032
- Table 53: Global Rare Neurological Disorders Market Revenue Million Forecast, by Country 2019 & 2032
- Table 54: Global Rare Neurological Disorders Market Volume K Unit Forecast, by Country 2019 & 2032
- Table 55: Brazil Rare Neurological Disorders Market Revenue (Million) Forecast, by Application 2019 & 2032
- Table 56: Brazil Rare Neurological Disorders Market Volume (K Unit) Forecast, by Application 2019 & 2032
- Table 57: Argentina Rare Neurological Disorders Market Revenue (Million) Forecast, by Application 2019 & 2032
- Table 58: Argentina Rare Neurological Disorders Market Volume (K Unit) Forecast, by Application 2019 & 2032
- Table 59: Rest of South America Rare Neurological Disorders Market Revenue (Million) Forecast, by Application 2019 & 2032
- Table 60: Rest of South America Rare Neurological Disorders Market Volume (K Unit) Forecast, by Application 2019 & 2032
- Table 61: Global Rare Neurological Disorders Market Revenue Million Forecast, by Drug Type 2019 & 2032
- Table 62: Global Rare Neurological Disorders Market Volume K Unit Forecast, by Drug Type 2019 & 2032
- Table 63: Global Rare Neurological Disorders Market Revenue Million Forecast, by Mode of Administration 2019 & 2032
- Table 64: Global Rare Neurological Disorders Market Volume K Unit Forecast, by Mode of Administration 2019 & 2032
- Table 65: Global Rare Neurological Disorders Market Revenue Million Forecast, by Country 2019 & 2032
- Table 66: Global Rare Neurological Disorders Market Volume K Unit Forecast, by Country 2019 & 2032
- Table 67: United States Rare Neurological Disorders Market Revenue (Million) Forecast, by Application 2019 & 2032
- Table 68: United States Rare Neurological Disorders Market Volume (K Unit) Forecast, by Application 2019 & 2032
- Table 69: Canada Rare Neurological Disorders Market Revenue (Million) Forecast, by Application 2019 & 2032
- Table 70: Canada Rare Neurological Disorders Market Volume (K Unit) Forecast, by Application 2019 & 2032
- Table 71: Mexico Rare Neurological Disorders Market Revenue (Million) Forecast, by Application 2019 & 2032
- Table 72: Mexico Rare Neurological Disorders Market Volume (K Unit) Forecast, by Application 2019 & 2032
- Table 73: Global Rare Neurological Disorders Market Revenue Million Forecast, by Drug Type 2019 & 2032
- Table 74: Global Rare Neurological Disorders Market Volume K Unit Forecast, by Drug Type 2019 & 2032
- Table 75: Global Rare Neurological Disorders Market Revenue Million Forecast, by Mode of Administration 2019 & 2032
- Table 76: Global Rare Neurological Disorders Market Volume K Unit Forecast, by Mode of Administration 2019 & 2032
- Table 77: Global Rare Neurological Disorders Market Revenue Million Forecast, by Country 2019 & 2032
- Table 78: Global Rare Neurological Disorders Market Volume K Unit Forecast, by Country 2019 & 2032
- Table 79: Germany Rare Neurological Disorders Market Revenue (Million) Forecast, by Application 2019 & 2032
- Table 80: Germany Rare Neurological Disorders Market Volume (K Unit) Forecast, by Application 2019 & 2032
- Table 81: United Kingdom Rare Neurological Disorders Market Revenue (Million) Forecast, by Application 2019 & 2032
- Table 82: United Kingdom Rare Neurological Disorders Market Volume (K Unit) Forecast, by Application 2019 & 2032
- Table 83: France Rare Neurological Disorders Market Revenue (Million) Forecast, by Application 2019 & 2032
- Table 84: France Rare Neurological Disorders Market Volume (K Unit) Forecast, by Application 2019 & 2032
- Table 85: Italy Rare Neurological Disorders Market Revenue (Million) Forecast, by Application 2019 & 2032
- Table 86: Italy Rare Neurological Disorders Market Volume (K Unit) Forecast, by Application 2019 & 2032
- Table 87: Spain Rare Neurological Disorders Market Revenue (Million) Forecast, by Application 2019 & 2032
- Table 88: Spain Rare Neurological Disorders Market Volume (K Unit) Forecast, by Application 2019 & 2032
- Table 89: Rest of Europe Rare Neurological Disorders Market Revenue (Million) Forecast, by Application 2019 & 2032
- Table 90: Rest of Europe Rare Neurological Disorders Market Volume (K Unit) Forecast, by Application 2019 & 2032
- Table 91: Global Rare Neurological Disorders Market Revenue Million Forecast, by Drug Type 2019 & 2032
- Table 92: Global Rare Neurological Disorders Market Volume K Unit Forecast, by Drug Type 2019 & 2032
- Table 93: Global Rare Neurological Disorders Market Revenue Million Forecast, by Mode of Administration 2019 & 2032
- Table 94: Global Rare Neurological Disorders Market Volume K Unit Forecast, by Mode of Administration 2019 & 2032
- Table 95: Global Rare Neurological Disorders Market Revenue Million Forecast, by Country 2019 & 2032
- Table 96: Global Rare Neurological Disorders Market Volume K Unit Forecast, by Country 2019 & 2032
- Table 97: China Rare Neurological Disorders Market Revenue (Million) Forecast, by Application 2019 & 2032
- Table 98: China Rare Neurological Disorders Market Volume (K Unit) Forecast, by Application 2019 & 2032
- Table 99: Japan Rare Neurological Disorders Market Revenue (Million) Forecast, by Application 2019 & 2032
- Table 100: Japan Rare Neurological Disorders Market Volume (K Unit) Forecast, by Application 2019 & 2032
- Table 101: India Rare Neurological Disorders Market Revenue (Million) Forecast, by Application 2019 & 2032
- Table 102: India Rare Neurological Disorders Market Volume (K Unit) Forecast, by Application 2019 & 2032
- Table 103: Australia Rare Neurological Disorders Market Revenue (Million) Forecast, by Application 2019 & 2032
- Table 104: Australia Rare Neurological Disorders Market Volume (K Unit) Forecast, by Application 2019 & 2032
- Table 105: South Korea Rare Neurological Disorders Market Revenue (Million) Forecast, by Application 2019 & 2032
- Table 106: South Korea Rare Neurological Disorders Market Volume (K Unit) Forecast, by Application 2019 & 2032
- Table 107: Rest of Asia Pacific Rare Neurological Disorders Market Revenue (Million) Forecast, by Application 2019 & 2032
- Table 108: Rest of Asia Pacific Rare Neurological Disorders Market Volume (K Unit) Forecast, by Application 2019 & 2032
- Table 109: Global Rare Neurological Disorders Market Revenue Million Forecast, by Drug Type 2019 & 2032
- Table 110: Global Rare Neurological Disorders Market Volume K Unit Forecast, by Drug Type 2019 & 2032
- Table 111: Global Rare Neurological Disorders Market Revenue Million Forecast, by Mode of Administration 2019 & 2032
- Table 112: Global Rare Neurological Disorders Market Volume K Unit Forecast, by Mode of Administration 2019 & 2032
- Table 113: Global Rare Neurological Disorders Market Revenue Million Forecast, by Country 2019 & 2032
- Table 114: Global Rare Neurological Disorders Market Volume K Unit Forecast, by Country 2019 & 2032
- Table 115: GCC Rare Neurological Disorders Market Revenue (Million) Forecast, by Application 2019 & 2032
- Table 116: GCC Rare Neurological Disorders Market Volume (K Unit) Forecast, by Application 2019 & 2032
- Table 117: South Africa Rare Neurological Disorders Market Revenue (Million) Forecast, by Application 2019 & 2032
- Table 118: South Africa Rare Neurological Disorders Market Volume (K Unit) Forecast, by Application 2019 & 2032
- Table 119: Rest of Middle East and Africa Rare Neurological Disorders Market Revenue (Million) Forecast, by Application 2019 & 2032
- Table 120: Rest of Middle East and Africa Rare Neurological Disorders Market Volume (K Unit) Forecast, by Application 2019 & 2032
- Table 121: Global Rare Neurological Disorders Market Revenue Million Forecast, by Drug Type 2019 & 2032
- Table 122: Global Rare Neurological Disorders Market Volume K Unit Forecast, by Drug Type 2019 & 2032
- Table 123: Global Rare Neurological Disorders Market Revenue Million Forecast, by Mode of Administration 2019 & 2032
- Table 124: Global Rare Neurological Disorders Market Volume K Unit Forecast, by Mode of Administration 2019 & 2032
- Table 125: Global Rare Neurological Disorders Market Revenue Million Forecast, by Country 2019 & 2032
- Table 126: Global Rare Neurological Disorders Market Volume K Unit Forecast, by Country 2019 & 2032
- Table 127: Brazil Rare Neurological Disorders Market Revenue (Million) Forecast, by Application 2019 & 2032
- Table 128: Brazil Rare Neurological Disorders Market Volume (K Unit) Forecast, by Application 2019 & 2032
- Table 129: Argentina Rare Neurological Disorders Market Revenue (Million) Forecast, by Application 2019 & 2032
- Table 130: Argentina Rare Neurological Disorders Market Volume (K Unit) Forecast, by Application 2019 & 2032
- Table 131: Rest of South America Rare Neurological Disorders Market Revenue (Million) Forecast, by Application 2019 & 2032
- Table 132: Rest of South America Rare Neurological Disorders Market Volume (K Unit) Forecast, by Application 2019 & 2032
Frequently Asked Questions
1. What is the projected Compound Annual Growth Rate (CAGR) of the Rare Neurological Disorders Market?
The projected CAGR is approximately 8.60%.
2. Which companies are prominent players in the Rare Neurological Disorders Market?
Key companies in the market include Kedrion Biopharma Inc, CSL Ltd, Bayer AG, Novartis AG, Aquestive Therapeutics Inc, US WorldMeds LLC (Solstice Neurosciences LLC), Merz Pharma GmbH & Co KGaA, Teva Pharmaceutical Industries Ltd, Merck & Co Inc (EMD Serono Inc ), Biogen Inc, F Hoffmann - La Roche Ltd, Pfizer Inc.
3. What are the main segments of the Rare Neurological Disorders Market?
The market segments include Drug Type, Mode of Administration.
4. Can you provide details about the market size?
The market size is estimated to be USD XX Million as of 2022.
5. What are some drivers contributing to market growth?
Increasing Prevalence of Rare Neurological Diseases; Promising Pipeline Drugs for Treatment of Rare Neurological Diseases; Favorable Government Policies Worldwide for Speeding up Diagnostic Processes.
6. What are the notable trends driving market growth?
The Small Molecules Segment is Expected to Hold a Major Share in the Rare Neurological Disease Treatment Market.
7. Are there any restraints impacting market growth?
High Cost of Rare Neurological Disease Treatment.
8. Can you provide examples of recent developments in the market?
September 2021: NeuExcell Therapeutics and Spark Therapeutics entered a gene therapy collaboration to develop a safe and effective treatment for patients with Huntington's Disease (HD).
9. What pricing options are available for accessing the report?
Pricing options include single-user, multi-user, and enterprise licenses priced at USD 4750, USD 5250, and USD 8750 respectively.
10. Is the market size provided in terms of value or volume?
The market size is provided in terms of value, measured in Million and volume, measured in K Unit.
11. Are there any specific market keywords associated with the report?
Yes, the market keyword associated with the report is "Rare Neurological Disorders Market," which aids in identifying and referencing the specific market segment covered.
12. How do I determine which pricing option suits my needs best?
The pricing options vary based on user requirements and access needs. Individual users may opt for single-user licenses, while businesses requiring broader access may choose multi-user or enterprise licenses for cost-effective access to the report.
13. Are there any additional resources or data provided in the Rare Neurological Disorders Market report?
While the report offers comprehensive insights, it's advisable to review the specific contents or supplementary materials provided to ascertain if additional resources or data are available.
14. How can I stay updated on further developments or reports in the Rare Neurological Disorders Market?
To stay informed about further developments, trends, and reports in the Rare Neurological Disorders Market, consider subscribing to industry newsletters, following relevant companies and organizations, or regularly checking reputable industry news sources and publications.
Methodology
Step 1 - Identification of Relevant Samples Size from Population Database


Step 2 - Approaches for Defining Global Market Size (Value, Volume* & Price*)

Note*: In applicable scenarios
Step 3 - Data Sources
Primary Research
- Web Analytics
- Survey Reports
- Research Institute
- Latest Research Reports
- Opinion Leaders
Secondary Research
- Annual Reports
- White Paper
- Latest Press Release
- Industry Association
- Paid Database
- Investor Presentations

Step 4 - Data Triangulation
Involves using different sources of information in order to increase the validity of a study
These sources are likely to be stakeholders in a program - participants, other researchers, program staff, other community members, and so on.
Then we put all data in single framework & apply various statistical tools to find out the dynamic on the market.
During the analysis stage, feedback from the stakeholder groups would be compared to determine areas of agreement as well as areas of divergence
