


Key Insights
The global Radioactive Isotope Labeling Services market is poised for significant expansion, with an estimated market size of USD 2.5 billion in 2025. This robust growth is driven by an impressive Compound Annual Growth Rate (CAGR) of 18.6% projected from 2025 to 2033. This dynamic trajectory is primarily fueled by the escalating demand for personalized medicine, advancements in drug discovery and development, and the increasing complexity of pharmaceutical research requiring precise molecular tracking. The burgeoning need for accurate pharmacokinetic and pharmacodynamic studies, crucial for understanding drug efficacy and safety, forms a cornerstone of market expansion. Furthermore, the growing utilization of radiolabeling in medical imaging and diagnostics, coupled with its role in understanding disease mechanisms at a molecular level, are significant contributors to this positive outlook.
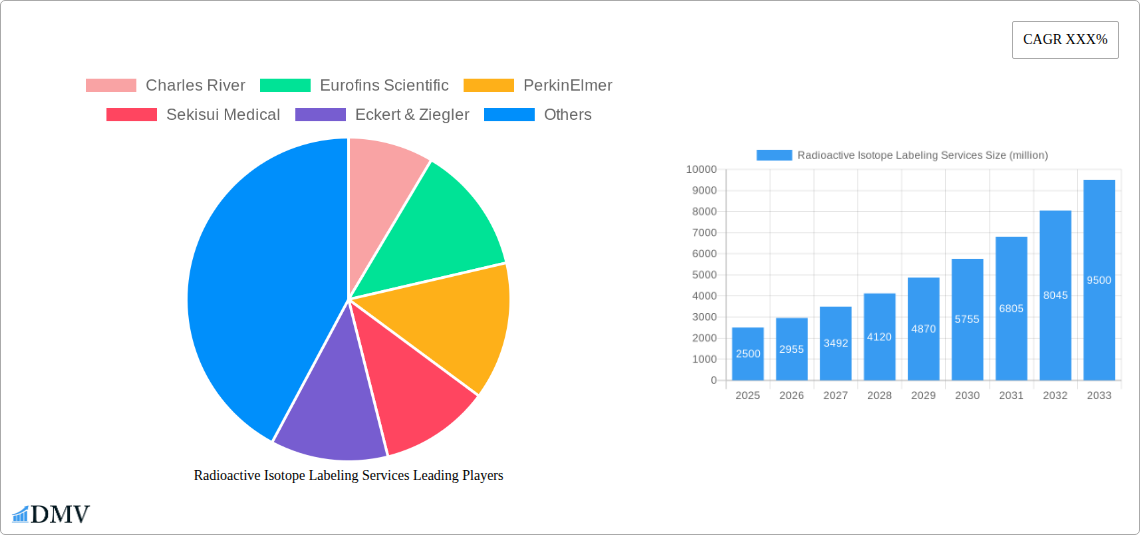
Radioactive Isotope Labeling Services Market Size (In Billion)

The market's segmentation highlights key areas of activity. In terms of application, Pharmacokinetics and Pharmacodynamics studies represent the most substantial segment, reflecting the critical role of these services in preclinical and clinical drug development. The "Medical" application segment, encompassing diagnostics and therapeutic applications, also demonstrates strong growth potential. By type, while C-14 and H-3 continue to be widely used isotopes, the increasing adoption of I-125 for specific diagnostic and research purposes is noteworthy. The competitive landscape is characterized by the presence of established global players and emerging specialized service providers, all vying for market share through innovation, strategic collaborations, and expansion of service portfolios. This intense competition, coupled with stringent regulatory requirements, is expected to foster continuous technological advancements and service quality improvements.
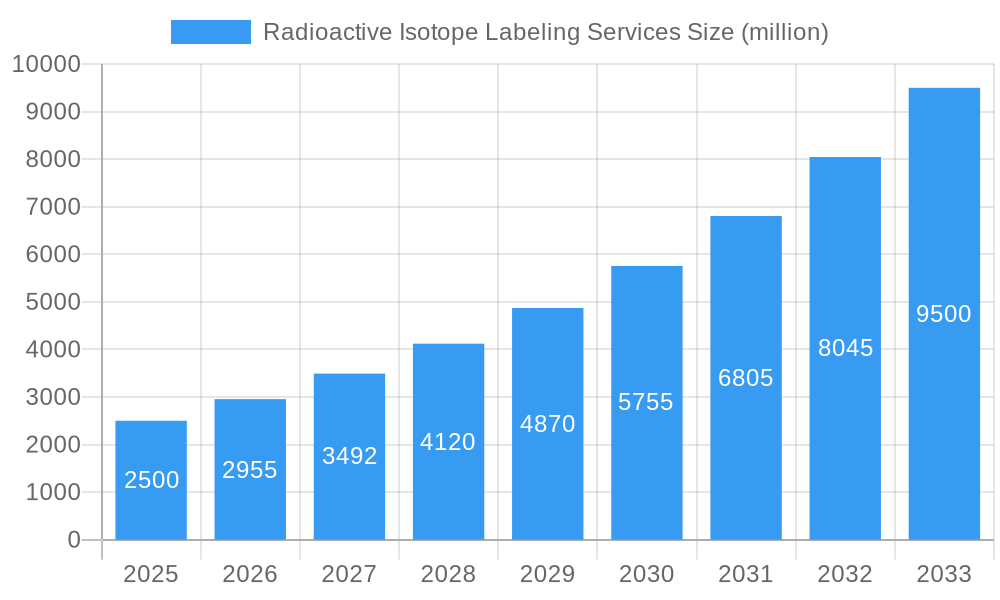
Radioactive Isotope Labeling Services Company Market Share
Radioactive Isotope Labeling Services Market Composition & Trends
The radioactive isotope labeling services market is characterized by a moderate to high level of concentration, with key players like Charles River, Eurofins Scientific, and PerkinElmer holding significant market share, estimated at over $1.5 billion in 2025. Innovation is primarily driven by the pharmaceutical and biotechnology sectors' increasing demand for precise drug discovery and development tools. The regulatory landscape, governed by agencies such as the FDA and EMA, is a critical factor, dictating stringent quality control and safety protocols for radiolabeled compounds, thereby influencing market entry and operational costs. Substitute products, while emerging in the form of stable isotope labeling for certain applications, are yet to fully replace the sensitivity and specificity offered by radioactive isotopes for critical studies. End-user profiles are diverse, encompassing pharmaceutical companies, biotechnology firms, academic research institutions, and Contract Research Organizations (CROs), each with specific requirements for labeling isotopes like C-14, H-3, and I-125. Mergers and acquisitions (M&A) are a notable trend, with significant deal values in the billions of dollars, consolidating market power and expanding service portfolios. For instance, the acquisition of XenoTech (BioIVT) by a private equity firm further reshaped the competitive dynamics. Understanding these interwoven elements is crucial for navigating this specialized and critical market segment.
- Market Share Distribution (2025): Leading companies collectively account for approximately 70% of the estimated $1.6 billion market.
- M&A Deal Values (Historical 2019-2024): Cumulative M&A activity in the radioactive isotope labeling services sector has exceeded $4 billion, signifying strategic consolidation.
- Key Innovation Catalysts: Demand for PET imaging tracers, advanced ADME studies, and personalized medicine research.
- Regulatory Landscape: Strict adherence to cGMP, GLP, and environmental safety regulations.
Radioactive Isotope Labeling Services Industry Evolution
The radioactive isotope labeling services industry has undergone a remarkable transformation, evolving from its nascent stages to a sophisticated and indispensable component of modern drug discovery and development. Historically, the industry's growth trajectory has been intrinsically linked to advancements in pharmaceutical research and the increasing complexity of therapeutic agents. From 2019 to 2024, the market witnessed a steady compound annual growth rate (CAGR) of approximately 7.5%, driven by the expanding pipeline of new chemical entities and biologics requiring rigorous preclinical and clinical evaluation. The base year, 2025, is projected to see the market value reaching an estimated $1.6 billion, a testament to its sustained demand.
Technological advancements have been a pivotal force in this evolution. The development of more efficient and safer synthesis methods for radiolabeled compounds, particularly for isotopes like C-14 and H-3, has broadened their applicability. Furthermore, the integration of automation and high-throughput screening technologies has significantly accelerated the labeling process, reducing turnaround times and costs for stakeholders. The adoption of C-14 labeling for ADME (Absorption, Distribution, Metabolism, and Excretion) studies remains a cornerstone of drug development, accounting for a substantial portion of the market's revenue. Similarly, H-3 labeling continues to be vital for in vivo pharmacokinetic studies, offering high sensitivity.
Shifting consumer demands, particularly from the pharmaceutical and biotechnology industries, have also shaped the industry's evolution. There is an increasing emphasis on the quality, purity, and regulatory compliance of labeled compounds. Clients now expect comprehensive analytical data, including impurity profiles and stability studies. This has led service providers to invest heavily in advanced analytical instrumentation and quality assurance systems. The rise of personalized medicine and the development of targeted therapies are further fueling demand for highly specific radiolabeled tracers for diagnostic imaging and theranostics, presenting a significant growth avenue.
The forecast period from 2025 to 2033 anticipates continued robust growth, with an estimated CAGR of 8.2%. This sustained expansion will be fueled by the persistent need for accurate and sensitive pharmacokinetic and pharmacodynamic studies, the growing prevalence of chronic diseases necessitating novel drug development, and the increasing adoption of radiolabeling techniques in emerging therapeutic modalities like gene therapy and cell therapy. Companies like Eurofins Scientific and Charles River are at the forefront of this evolution, continually expanding their capabilities and service offerings to meet these evolving demands. The industry's resilience and adaptability underscore its critical role in bringing life-saving therapies to market.
Leading Regions, Countries, or Segments in Radioactive Isotope Labeling Services
North America currently stands as the dominant region in the global radioactive isotope labeling services market, driven by a confluence of factors including a robust pharmaceutical and biotechnology industry, significant R&D investment, and a well-established regulatory framework. Within North America, the United States plays a pivotal role, housing a large number of leading pharmaceutical and biotechnology companies that are major consumers of these specialized services. This dominance is further amplified by the presence of leading contract research organizations (CROs) and academic institutions that actively engage in drug discovery and development requiring radiolabeled compounds.
The Application segment of Pharmacokinetics and Pharmacodynamics (PK/PD) is the leading segment within the radioactive isotope labeling services market. This prominence stems from the indispensable nature of PK/PD studies in evaluating drug safety and efficacy throughout the drug development lifecycle. C-14 and H-3 isotopes are the most widely utilized for these purposes due to their relatively long half-lives, ease of incorporation into organic molecules, and high detection sensitivity, making them ideal for tracing drug absorption, distribution, metabolism, and excretion in biological systems. The accurate quantification of drug concentrations over time, facilitated by these isotopes, is critical for dose optimization and regulatory submission.
Key drivers contributing to North America's and the PK/PD segment's leadership include:
- Investment Trends: Substantial venture capital and government funding allocated to pharmaceutical R&D in the US, fostering a consistent demand for radiolabeling services.
- Regulatory Support: A mature and supportive regulatory environment that encourages rigorous preclinical and clinical testing, where radiolabeling is often a mandatory component for drug approval.
- Technological Infrastructure: The presence of advanced research facilities, including PET imaging centers and high-throughput synthesis laboratories, capable of handling complex radiolabeling projects.
- Industry Concentration: A high concentration of major pharmaceutical and biotechnology companies with established internal drug development programs or strong reliance on outsourcing to CROs.
- Innovation in Isotope Utilization: Continuous development of novel radiolabeling techniques and the application of isotopes in cutting-edge research areas like oncology, neurology, and infectious diseases.
The market for radioactive isotope labeling services, particularly within the PK/PD application and the broader North American region, is therefore characterized by sustained demand, driven by critical scientific requirements and a conducive ecosystem for pharmaceutical innovation.
Radioactive Isotope Labeling Services Product Innovations
Innovations in radioactive isotope labeling services are continuously enhancing the precision and efficiency of drug development. Recent advancements include the development of novel, highly sensitive radioligands for Positron Emission Tomography (PET) imaging, enabling earlier and more accurate diagnosis of diseases like Alzheimer's and various cancers. These innovations often involve complex multi-step synthesis pathways and specialized handling of short-lived isotopes. Furthermore, the refinement of automated synthesis platforms allows for faster and more consistent production of radiolabeled compounds, reducing turnaround times for critical pharmacokinetic studies. Enhanced purification techniques ensure higher radiochemical purity, a crucial performance metric for in vivo studies, minimizing potential artifacts and improving data reliability.
Propelling Factors for Radioactive Isotope Labeling Services Growth
The growth of the radioactive isotope labeling services market is propelled by several key factors. The escalating complexity of drug molecules and the demand for highly specific therapeutic agents necessitate precise preclinical and clinical evaluations, where radiolabeling plays a crucial role in understanding ADME profiles and target engagement. The increasing global prevalence of chronic diseases, such as cancer and neurological disorders, is driving substantial R&D investment in novel drug discovery, directly fueling the demand for these specialized labeling services. Regulatory mandates from bodies like the FDA and EMA, requiring extensive safety and efficacy data, further solidify the importance of radiolabeled studies. Finally, advancements in synthesis technologies and analytical instrumentation are making radiolabeling more efficient and accessible, thereby expanding its application scope.
Obstacles in the Radioactive Isotope Labeling Services Market
Despite its growth, the radioactive isotope labeling services market faces significant obstacles. Stringent regulatory hurdles and the associated compliance costs can be a substantial barrier to entry and expansion for smaller players. The handling and disposal of radioactive materials necessitate specialized infrastructure and trained personnel, leading to high operational expenses and potential environmental concerns. Supply chain disruptions for key radioisotopes, often due to production limitations or geopolitical factors, can impact service delivery timelines and increase costs. Furthermore, the inherent toxicity and safety concerns associated with radioactive materials require rigorous protocols, adding complexity and potentially limiting widespread adoption in certain research areas.
Future Opportunities in Radioactive Isotope Labeling Services
Emerging opportunities in the radioactive isotope labeling services market are abundant, particularly in the realm of personalized medicine and theranostics. The development of targeted radiopharmaceuticals that combine diagnostic imaging with therapeutic delivery is a rapidly growing area, requiring specialized radiolabeling expertise. The increasing application of radiolabeled compounds in novel therapeutic modalities, such as cell and gene therapies, presents a significant untapped market. Furthermore, advancements in artificial intelligence and machine learning are being integrated to optimize radiolabeling synthesis routes and predict optimal labeling strategies, creating opportunities for innovation and efficiency gains. Expansion into emerging markets with growing pharmaceutical R&D sectors also represents a considerable growth avenue.
Major Players in the Radioactive Isotope Labeling Services Ecosystem
- Charles River
- Eurofins Scientific
- PerkinElmer
- Sekisui Medical
- Eckert & Ziegler
- Labcorp
- XenoTech (BioIVT)
- Quotient Sciences
- Gifford Bioscience
- ITM Radiopharma
- Almac Group
- Accelera
- Novandi Chemistry
- AptoChem
- HMR
- AM Chemicals
- PolyPeptide Group
- NovoPro Bioscience
- Institute of Isotopes
- Nuvisan
- Revvity
- Necsa
- Fluorizon
- Edinburgh Pharmaceutical Processes
- Chelatec
- Pharmaron
- Medicilon
- JOINN Laboratories
- Frontage
- Abace Biotechnology
- Beijing Atom High-Tech
- Wuxi Beita Pharmatech
- Beijing North Institute of Biotechnology
Key Developments in Radioactive Isotope Labeling Services Industry
- 2023: Launch of new C-14 labeled API synthesis capabilities by Almac Group to support early-stage drug development.
- 2023: Eurofins Scientific expands its radiolabeling services with a focus on PET tracer development for oncology.
- 2022: PerkinElmer introduces enhanced automated synthesis platforms for H-3 and C-14 labeling, improving efficiency and reducing cycle times.
- 2022: Acquisition of Quotient Sciences by the Pritzker Private Capital, aiming to bolster its integrated drug development services, including radiolabeling.
- 2021: Eckert & Ziegler invests in expanded production capacity for key radiopharmaceuticals, addressing growing market demand.
- 2021: ITM Radiopharma announces strategic partnership to advance the development of targeted radioligands for cancer therapy.
Strategic Radioactive Isotope Labeling Services Market Forecast
The radioactive isotope labeling services market is poised for substantial growth, projected to reach an estimated value of over $3 billion by 2033, with a CAGR of 8.2% from 2025. This upward trajectory is underpinned by the relentless demand from the pharmaceutical and biotechnology sectors for precise drug characterization, particularly in pharmacokinetic and pharmacodynamic studies. The ongoing advancements in therapeutic modalities, including targeted therapies and personalized medicine, are creating new avenues for radiolabeled compounds in diagnostics and treatment. Furthermore, the increasing stringency of regulatory requirements globally, mandating comprehensive data on drug behavior, ensures the continued importance of these services. Strategic investments in expanding service portfolios, enhancing technological capabilities, and focusing on niche applications like PET imaging will be crucial for market leaders to capitalize on these evolving opportunities.
Radioactive Isotope Labeling Services Segmentation
-
1. Application
- 1.1. Pharmacokinetics and Pharmacodynamics
- 1.2. Medical
- 1.3. Others
-
2. Type
- 2.1. C-14
- 2.2. H-3
- 2.3. I-125
- 2.4. Others
Radioactive Isotope Labeling Services Segmentation By Geography
-
1. North America
- 1.1. United States
- 1.2. Canada
- 1.3. Mexico
-
2. South America
- 2.1. Brazil
- 2.2. Argentina
- 2.3. Rest of South America
-
3. Europe
- 3.1. United Kingdom
- 3.2. Germany
- 3.3. France
- 3.4. Italy
- 3.5. Spain
- 3.6. Russia
- 3.7. Benelux
- 3.8. Nordics
- 3.9. Rest of Europe
-
4. Middle East & Africa
- 4.1. Turkey
- 4.2. Israel
- 4.3. GCC
- 4.4. North Africa
- 4.5. South Africa
- 4.6. Rest of Middle East & Africa
-
5. Asia Pacific
- 5.1. China
- 5.2. India
- 5.3. Japan
- 5.4. South Korea
- 5.5. ASEAN
- 5.6. Oceania
- 5.7. Rest of Asia Pacific
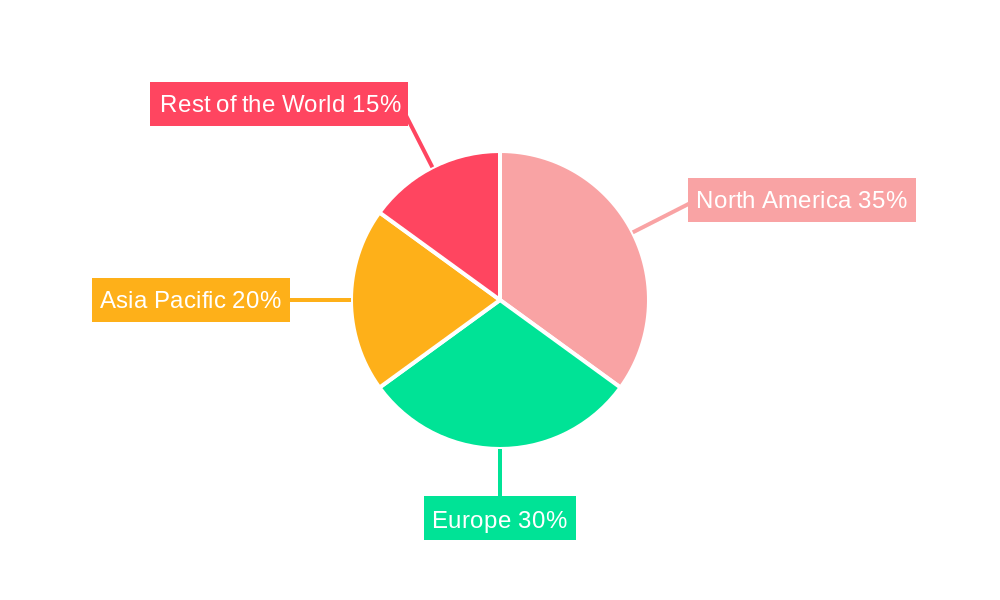
Radioactive Isotope Labeling Services Regional Market Share
Geographic Coverage of Radioactive Isotope Labeling Services
Radioactive Isotope Labeling Services REPORT HIGHLIGHTS
| Aspects | Details |
|---|---|
| Study Period | 2020-2034 |
| Base Year | 2025 |
| Estimated Year | 2026 |
| Forecast Period | 2026-2034 |
| Historical Period | 2020-2025 |
| Growth Rate | CAGR of 18.6% from 2020-2034 |
| Segmentation |
|
Table of Contents
- 1. Introduction
- 1.1. Research Scope
- 1.2. Market Segmentation
- 1.3. Research Objective
- 1.4. Definitions and Assumptions
- 2. Executive Summary
- 2.1. Market Snapshot
- 3. Market Dynamics
- 3.1. Market Drivers
- 3.2. Market Restrains
- 3.3. Market Trends
- 3.4. Market Opportunities
- 4. Market Factor Analysis
- 4.1. Porters Five Forces
- 4.1.1. Bargaining Power of Suppliers
- 4.1.2. Bargaining Power of Buyers
- 4.1.3. Threat of New Entrants
- 4.1.4. Threat of Substitutes
- 4.1.5. Competitive Rivalry
- 4.2. PESTEL analysis
- 4.3. BCG Analysis
- 4.3.1. Stars (High Growth, High Market Share)
- 4.3.2. Cash Cows (Low Growth, High Market Share)
- 4.3.3. Question Mark (High Growth, Low Market Share)
- 4.3.4. Dogs (Low Growth, Low Market Share)
- 4.4. Ansoff Matrix Analysis
- 4.5. Supply Chain Analysis
- 4.6. Regulatory Landscape
- 4.7. Current Market Potential and Opportunity Assessment (TAM–SAM–SOM Framework)
- 4.8. DMV Analyst Note
- 4.1. Porters Five Forces
- 5. Market Analysis, Insights and Forecast 2021-2033
- 5.1. Market Analysis, Insights and Forecast - by Application
- 5.1.1. Pharmacokinetics and Pharmacodynamics
- 5.1.2. Medical
- 5.1.3. Others
- 5.2. Market Analysis, Insights and Forecast - by Type
- 5.2.1. C-14
- 5.2.2. H-3
- 5.2.3. I-125
- 5.2.4. Others
- 5.3. Market Analysis, Insights and Forecast - by Region
- 5.3.1. North America
- 5.3.2. South America
- 5.3.3. Europe
- 5.3.4. Middle East & Africa
- 5.3.5. Asia Pacific
- 5.1. Market Analysis, Insights and Forecast - by Application
- 6. Global Radioactive Isotope Labeling Services Analysis, Insights and Forecast, 2021-2033
- 6.1. Market Analysis, Insights and Forecast - by Application
- 6.1.1. Pharmacokinetics and Pharmacodynamics
- 6.1.2. Medical
- 6.1.3. Others
- 6.2. Market Analysis, Insights and Forecast - by Type
- 6.2.1. C-14
- 6.2.2. H-3
- 6.2.3. I-125
- 6.2.4. Others
- 6.1. Market Analysis, Insights and Forecast - by Application
- 7. North America Radioactive Isotope Labeling Services Analysis, Insights and Forecast, 2020-2032
- 7.1. Market Analysis, Insights and Forecast - by Application
- 7.1.1. Pharmacokinetics and Pharmacodynamics
- 7.1.2. Medical
- 7.1.3. Others
- 7.2. Market Analysis, Insights and Forecast - by Type
- 7.2.1. C-14
- 7.2.2. H-3
- 7.2.3. I-125
- 7.2.4. Others
- 7.1. Market Analysis, Insights and Forecast - by Application
- 8. South America Radioactive Isotope Labeling Services Analysis, Insights and Forecast, 2020-2032
- 8.1. Market Analysis, Insights and Forecast - by Application
- 8.1.1. Pharmacokinetics and Pharmacodynamics
- 8.1.2. Medical
- 8.1.3. Others
- 8.2. Market Analysis, Insights and Forecast - by Type
- 8.2.1. C-14
- 8.2.2. H-3
- 8.2.3. I-125
- 8.2.4. Others
- 8.1. Market Analysis, Insights and Forecast - by Application
- 9. Europe Radioactive Isotope Labeling Services Analysis, Insights and Forecast, 2020-2032
- 9.1. Market Analysis, Insights and Forecast - by Application
- 9.1.1. Pharmacokinetics and Pharmacodynamics
- 9.1.2. Medical
- 9.1.3. Others
- 9.2. Market Analysis, Insights and Forecast - by Type
- 9.2.1. C-14
- 9.2.2. H-3
- 9.2.3. I-125
- 9.2.4. Others
- 9.1. Market Analysis, Insights and Forecast - by Application
- 10. Middle East & Africa Radioactive Isotope Labeling Services Analysis, Insights and Forecast, 2020-2032
- 10.1. Market Analysis, Insights and Forecast - by Application
- 10.1.1. Pharmacokinetics and Pharmacodynamics
- 10.1.2. Medical
- 10.1.3. Others
- 10.2. Market Analysis, Insights and Forecast - by Type
- 10.2.1. C-14
- 10.2.2. H-3
- 10.2.3. I-125
- 10.2.4. Others
- 10.1. Market Analysis, Insights and Forecast - by Application
- 11. Asia Pacific Radioactive Isotope Labeling Services Analysis, Insights and Forecast, 2020-2032
- 11.1. Market Analysis, Insights and Forecast - by Application
- 11.1.1. Pharmacokinetics and Pharmacodynamics
- 11.1.2. Medical
- 11.1.3. Others
- 11.2. Market Analysis, Insights and Forecast - by Type
- 11.2.1. C-14
- 11.2.2. H-3
- 11.2.3. I-125
- 11.2.4. Others
- 11.1. Market Analysis, Insights and Forecast - by Application
- 12. Competitive Analysis
- 12.1. Company Profiles
- 12.1.1 Charles River
- 12.1.1.1. Company Overview
- 12.1.1.2. Products
- 12.1.1.3. Company Financials
- 12.1.1.4. SWOT Analysis
- 12.1.2 Eurofins Scientific
- 12.1.2.1. Company Overview
- 12.1.2.2. Products
- 12.1.2.3. Company Financials
- 12.1.2.4. SWOT Analysis
- 12.1.3 PerkinElmer
- 12.1.3.1. Company Overview
- 12.1.3.2. Products
- 12.1.3.3. Company Financials
- 12.1.3.4. SWOT Analysis
- 12.1.4 Sekisui Medical
- 12.1.4.1. Company Overview
- 12.1.4.2. Products
- 12.1.4.3. Company Financials
- 12.1.4.4. SWOT Analysis
- 12.1.5 Eckert & Ziegler
- 12.1.5.1. Company Overview
- 12.1.5.2. Products
- 12.1.5.3. Company Financials
- 12.1.5.4. SWOT Analysis
- 12.1.6 Labcorp
- 12.1.6.1. Company Overview
- 12.1.6.2. Products
- 12.1.6.3. Company Financials
- 12.1.6.4. SWOT Analysis
- 12.1.7 XenoTech (BioIVT)
- 12.1.7.1. Company Overview
- 12.1.7.2. Products
- 12.1.7.3. Company Financials
- 12.1.7.4. SWOT Analysis
- 12.1.8 Quotient Sciences
- 12.1.8.1. Company Overview
- 12.1.8.2. Products
- 12.1.8.3. Company Financials
- 12.1.8.4. SWOT Analysis
- 12.1.9 Gifford Bioscience
- 12.1.9.1. Company Overview
- 12.1.9.2. Products
- 12.1.9.3. Company Financials
- 12.1.9.4. SWOT Analysis
- 12.1.10 ITM Radiopharma
- 12.1.10.1. Company Overview
- 12.1.10.2. Products
- 12.1.10.3. Company Financials
- 12.1.10.4. SWOT Analysis
- 12.1.11 Almac Group
- 12.1.11.1. Company Overview
- 12.1.11.2. Products
- 12.1.11.3. Company Financials
- 12.1.11.4. SWOT Analysis
- 12.1.12 Accelera
- 12.1.12.1. Company Overview
- 12.1.12.2. Products
- 12.1.12.3. Company Financials
- 12.1.12.4. SWOT Analysis
- 12.1.13 Novandi Chemistry
- 12.1.13.1. Company Overview
- 12.1.13.2. Products
- 12.1.13.3. Company Financials
- 12.1.13.4. SWOT Analysis
- 12.1.14 AptoChem
- 12.1.14.1. Company Overview
- 12.1.14.2. Products
- 12.1.14.3. Company Financials
- 12.1.14.4. SWOT Analysis
- 12.1.15 HMR
- 12.1.15.1. Company Overview
- 12.1.15.2. Products
- 12.1.15.3. Company Financials
- 12.1.15.4. SWOT Analysis
- 12.1.16 AM Chemicals
- 12.1.16.1. Company Overview
- 12.1.16.2. Products
- 12.1.16.3. Company Financials
- 12.1.16.4. SWOT Analysis
- 12.1.17 PolyPeptide Group
- 12.1.17.1. Company Overview
- 12.1.17.2. Products
- 12.1.17.3. Company Financials
- 12.1.17.4. SWOT Analysis
- 12.1.18 NovoPro Bioscience
- 12.1.18.1. Company Overview
- 12.1.18.2. Products
- 12.1.18.3. Company Financials
- 12.1.18.4. SWOT Analysis
- 12.1.19 Institute of Isotopes
- 12.1.19.1. Company Overview
- 12.1.19.2. Products
- 12.1.19.3. Company Financials
- 12.1.19.4. SWOT Analysis
- 12.1.20 Nuvisan
- 12.1.20.1. Company Overview
- 12.1.20.2. Products
- 12.1.20.3. Company Financials
- 12.1.20.4. SWOT Analysis
- 12.1.21 Revvity
- 12.1.21.1. Company Overview
- 12.1.21.2. Products
- 12.1.21.3. Company Financials
- 12.1.21.4. SWOT Analysis
- 12.1.22 Necsa
- 12.1.22.1. Company Overview
- 12.1.22.2. Products
- 12.1.22.3. Company Financials
- 12.1.22.4. SWOT Analysis
- 12.1.23 Fluorizon
- 12.1.23.1. Company Overview
- 12.1.23.2. Products
- 12.1.23.3. Company Financials
- 12.1.23.4. SWOT Analysis
- 12.1.24 Edinburgh Pharmaceutical Processes
- 12.1.24.1. Company Overview
- 12.1.24.2. Products
- 12.1.24.3. Company Financials
- 12.1.24.4. SWOT Analysis
- 12.1.25 Chelatec
- 12.1.25.1. Company Overview
- 12.1.25.2. Products
- 12.1.25.3. Company Financials
- 12.1.25.4. SWOT Analysis
- 12.1.26 Pharmaron
- 12.1.26.1. Company Overview
- 12.1.26.2. Products
- 12.1.26.3. Company Financials
- 12.1.26.4. SWOT Analysis
- 12.1.27 Medicilon
- 12.1.27.1. Company Overview
- 12.1.27.2. Products
- 12.1.27.3. Company Financials
- 12.1.27.4. SWOT Analysis
- 12.1.28 JOINN Laboratories
- 12.1.28.1. Company Overview
- 12.1.28.2. Products
- 12.1.28.3. Company Financials
- 12.1.28.4. SWOT Analysis
- 12.1.29 Frontage
- 12.1.29.1. Company Overview
- 12.1.29.2. Products
- 12.1.29.3. Company Financials
- 12.1.29.4. SWOT Analysis
- 12.1.30 Abace Biotechnology
- 12.1.30.1. Company Overview
- 12.1.30.2. Products
- 12.1.30.3. Company Financials
- 12.1.30.4. SWOT Analysis
- 12.1.31 Beijing Atom High-Tech
- 12.1.31.1. Company Overview
- 12.1.31.2. Products
- 12.1.31.3. Company Financials
- 12.1.31.4. SWOT Analysis
- 12.1.32 Wuxi Beita Pharmatech
- 12.1.32.1. Company Overview
- 12.1.32.2. Products
- 12.1.32.3. Company Financials
- 12.1.32.4. SWOT Analysis
- 12.1.33 Beijing North Institute of Biotechnology
- 12.1.33.1. Company Overview
- 12.1.33.2. Products
- 12.1.33.3. Company Financials
- 12.1.33.4. SWOT Analysis
- 12.1.1 Charles River
- 12.2. Market Entropy
- 12.2.1 Company's Key Areas Served
- 12.2.2 Recent Developments
- 12.3. Company Market Share Analysis 2025
- 12.3.1 Top 5 Companies Market Share Analysis
- 12.3.2 Top 3 Companies Market Share Analysis
- 12.4. List of Potential Customers
- 13. Research Methodology
List of Figures
- Figure 1: Global Radioactive Isotope Labeling Services Revenue Breakdown (undefined, %) by Region 2025 & 2033
- Figure 2: North America Radioactive Isotope Labeling Services Revenue (undefined), by Application 2025 & 2033
- Figure 3: North America Radioactive Isotope Labeling Services Revenue Share (%), by Application 2025 & 2033
- Figure 4: North America Radioactive Isotope Labeling Services Revenue (undefined), by Type 2025 & 2033
- Figure 5: North America Radioactive Isotope Labeling Services Revenue Share (%), by Type 2025 & 2033
- Figure 6: North America Radioactive Isotope Labeling Services Revenue (undefined), by Country 2025 & 2033
- Figure 7: North America Radioactive Isotope Labeling Services Revenue Share (%), by Country 2025 & 2033
- Figure 8: South America Radioactive Isotope Labeling Services Revenue (undefined), by Application 2025 & 2033
- Figure 9: South America Radioactive Isotope Labeling Services Revenue Share (%), by Application 2025 & 2033
- Figure 10: South America Radioactive Isotope Labeling Services Revenue (undefined), by Type 2025 & 2033
- Figure 11: South America Radioactive Isotope Labeling Services Revenue Share (%), by Type 2025 & 2033
- Figure 12: South America Radioactive Isotope Labeling Services Revenue (undefined), by Country 2025 & 2033
- Figure 13: South America Radioactive Isotope Labeling Services Revenue Share (%), by Country 2025 & 2033
- Figure 14: Europe Radioactive Isotope Labeling Services Revenue (undefined), by Application 2025 & 2033
- Figure 15: Europe Radioactive Isotope Labeling Services Revenue Share (%), by Application 2025 & 2033
- Figure 16: Europe Radioactive Isotope Labeling Services Revenue (undefined), by Type 2025 & 2033
- Figure 17: Europe Radioactive Isotope Labeling Services Revenue Share (%), by Type 2025 & 2033
- Figure 18: Europe Radioactive Isotope Labeling Services Revenue (undefined), by Country 2025 & 2033
- Figure 19: Europe Radioactive Isotope Labeling Services Revenue Share (%), by Country 2025 & 2033
- Figure 20: Middle East & Africa Radioactive Isotope Labeling Services Revenue (undefined), by Application 2025 & 2033
- Figure 21: Middle East & Africa Radioactive Isotope Labeling Services Revenue Share (%), by Application 2025 & 2033
- Figure 22: Middle East & Africa Radioactive Isotope Labeling Services Revenue (undefined), by Type 2025 & 2033
- Figure 23: Middle East & Africa Radioactive Isotope Labeling Services Revenue Share (%), by Type 2025 & 2033
- Figure 24: Middle East & Africa Radioactive Isotope Labeling Services Revenue (undefined), by Country 2025 & 2033
- Figure 25: Middle East & Africa Radioactive Isotope Labeling Services Revenue Share (%), by Country 2025 & 2033
- Figure 26: Asia Pacific Radioactive Isotope Labeling Services Revenue (undefined), by Application 2025 & 2033
- Figure 27: Asia Pacific Radioactive Isotope Labeling Services Revenue Share (%), by Application 2025 & 2033
- Figure 28: Asia Pacific Radioactive Isotope Labeling Services Revenue (undefined), by Type 2025 & 2033
- Figure 29: Asia Pacific Radioactive Isotope Labeling Services Revenue Share (%), by Type 2025 & 2033
- Figure 30: Asia Pacific Radioactive Isotope Labeling Services Revenue (undefined), by Country 2025 & 2033
- Figure 31: Asia Pacific Radioactive Isotope Labeling Services Revenue Share (%), by Country 2025 & 2033
List of Tables
- Table 1: Global Radioactive Isotope Labeling Services Revenue undefined Forecast, by Application 2020 & 2033
- Table 2: Global Radioactive Isotope Labeling Services Revenue undefined Forecast, by Type 2020 & 2033
- Table 3: Global Radioactive Isotope Labeling Services Revenue undefined Forecast, by Region 2020 & 2033
- Table 4: Global Radioactive Isotope Labeling Services Revenue undefined Forecast, by Application 2020 & 2033
- Table 5: Global Radioactive Isotope Labeling Services Revenue undefined Forecast, by Type 2020 & 2033
- Table 6: Global Radioactive Isotope Labeling Services Revenue undefined Forecast, by Country 2020 & 2033
- Table 7: United States Radioactive Isotope Labeling Services Revenue (undefined) Forecast, by Application 2020 & 2033
- Table 8: Canada Radioactive Isotope Labeling Services Revenue (undefined) Forecast, by Application 2020 & 2033
- Table 9: Mexico Radioactive Isotope Labeling Services Revenue (undefined) Forecast, by Application 2020 & 2033
- Table 10: Global Radioactive Isotope Labeling Services Revenue undefined Forecast, by Application 2020 & 2033
- Table 11: Global Radioactive Isotope Labeling Services Revenue undefined Forecast, by Type 2020 & 2033
- Table 12: Global Radioactive Isotope Labeling Services Revenue undefined Forecast, by Country 2020 & 2033
- Table 13: Brazil Radioactive Isotope Labeling Services Revenue (undefined) Forecast, by Application 2020 & 2033
- Table 14: Argentina Radioactive Isotope Labeling Services Revenue (undefined) Forecast, by Application 2020 & 2033
- Table 15: Rest of South America Radioactive Isotope Labeling Services Revenue (undefined) Forecast, by Application 2020 & 2033
- Table 16: Global Radioactive Isotope Labeling Services Revenue undefined Forecast, by Application 2020 & 2033
- Table 17: Global Radioactive Isotope Labeling Services Revenue undefined Forecast, by Type 2020 & 2033
- Table 18: Global Radioactive Isotope Labeling Services Revenue undefined Forecast, by Country 2020 & 2033
- Table 19: United Kingdom Radioactive Isotope Labeling Services Revenue (undefined) Forecast, by Application 2020 & 2033
- Table 20: Germany Radioactive Isotope Labeling Services Revenue (undefined) Forecast, by Application 2020 & 2033
- Table 21: France Radioactive Isotope Labeling Services Revenue (undefined) Forecast, by Application 2020 & 2033
- Table 22: Italy Radioactive Isotope Labeling Services Revenue (undefined) Forecast, by Application 2020 & 2033
- Table 23: Spain Radioactive Isotope Labeling Services Revenue (undefined) Forecast, by Application 2020 & 2033
- Table 24: Russia Radioactive Isotope Labeling Services Revenue (undefined) Forecast, by Application 2020 & 2033
- Table 25: Benelux Radioactive Isotope Labeling Services Revenue (undefined) Forecast, by Application 2020 & 2033
- Table 26: Nordics Radioactive Isotope Labeling Services Revenue (undefined) Forecast, by Application 2020 & 2033
- Table 27: Rest of Europe Radioactive Isotope Labeling Services Revenue (undefined) Forecast, by Application 2020 & 2033
- Table 28: Global Radioactive Isotope Labeling Services Revenue undefined Forecast, by Application 2020 & 2033
- Table 29: Global Radioactive Isotope Labeling Services Revenue undefined Forecast, by Type 2020 & 2033
- Table 30: Global Radioactive Isotope Labeling Services Revenue undefined Forecast, by Country 2020 & 2033
- Table 31: Turkey Radioactive Isotope Labeling Services Revenue (undefined) Forecast, by Application 2020 & 2033
- Table 32: Israel Radioactive Isotope Labeling Services Revenue (undefined) Forecast, by Application 2020 & 2033
- Table 33: GCC Radioactive Isotope Labeling Services Revenue (undefined) Forecast, by Application 2020 & 2033
- Table 34: North Africa Radioactive Isotope Labeling Services Revenue (undefined) Forecast, by Application 2020 & 2033
- Table 35: South Africa Radioactive Isotope Labeling Services Revenue (undefined) Forecast, by Application 2020 & 2033
- Table 36: Rest of Middle East & Africa Radioactive Isotope Labeling Services Revenue (undefined) Forecast, by Application 2020 & 2033
- Table 37: Global Radioactive Isotope Labeling Services Revenue undefined Forecast, by Application 2020 & 2033
- Table 38: Global Radioactive Isotope Labeling Services Revenue undefined Forecast, by Type 2020 & 2033
- Table 39: Global Radioactive Isotope Labeling Services Revenue undefined Forecast, by Country 2020 & 2033
- Table 40: China Radioactive Isotope Labeling Services Revenue (undefined) Forecast, by Application 2020 & 2033
- Table 41: India Radioactive Isotope Labeling Services Revenue (undefined) Forecast, by Application 2020 & 2033
- Table 42: Japan Radioactive Isotope Labeling Services Revenue (undefined) Forecast, by Application 2020 & 2033
- Table 43: South Korea Radioactive Isotope Labeling Services Revenue (undefined) Forecast, by Application 2020 & 2033
- Table 44: ASEAN Radioactive Isotope Labeling Services Revenue (undefined) Forecast, by Application 2020 & 2033
- Table 45: Oceania Radioactive Isotope Labeling Services Revenue (undefined) Forecast, by Application 2020 & 2033
- Table 46: Rest of Asia Pacific Radioactive Isotope Labeling Services Revenue (undefined) Forecast, by Application 2020 & 2033
Frequently Asked Questions
1. What is the projected Compound Annual Growth Rate (CAGR) of the Radioactive Isotope Labeling Services?
The projected CAGR is approximately 18.6%.
2. Which companies are prominent players in the Radioactive Isotope Labeling Services?
Key companies in the market include Charles River, Eurofins Scientific, PerkinElmer, Sekisui Medical, Eckert & Ziegler, Labcorp, XenoTech (BioIVT), Quotient Sciences, Gifford Bioscience, ITM Radiopharma, Almac Group, Accelera, Novandi Chemistry, AptoChem, HMR, AM Chemicals, PolyPeptide Group, NovoPro Bioscience, Institute of Isotopes, Nuvisan, Revvity, Necsa, Fluorizon, Edinburgh Pharmaceutical Processes, Chelatec, Pharmaron, Medicilon, JOINN Laboratories, Frontage, Abace Biotechnology, Beijing Atom High-Tech, Wuxi Beita Pharmatech, Beijing North Institute of Biotechnology.
3. What are the main segments of the Radioactive Isotope Labeling Services?
The market segments include Application, Type.
4. Can you provide details about the market size?
The market size is estimated to be USD XXX N/A as of 2022.
5. What are some drivers contributing to market growth?
N/A
6. What are the notable trends driving market growth?
N/A
7. Are there any restraints impacting market growth?
N/A
8. Can you provide examples of recent developments in the market?
N/A
9. What pricing options are available for accessing the report?
Pricing options include single-user, multi-user, and enterprise licenses priced at USD 2900.00, USD 4350.00, and USD 5800.00 respectively.
10. Is the market size provided in terms of value or volume?
The market size is provided in terms of value, measured in N/A.
11. Are there any specific market keywords associated with the report?
Yes, the market keyword associated with the report is "Radioactive Isotope Labeling Services," which aids in identifying and referencing the specific market segment covered.
12. How do I determine which pricing option suits my needs best?
The pricing options vary based on user requirements and access needs. Individual users may opt for single-user licenses, while businesses requiring broader access may choose multi-user or enterprise licenses for cost-effective access to the report.
13. Are there any additional resources or data provided in the Radioactive Isotope Labeling Services report?
While the report offers comprehensive insights, it's advisable to review the specific contents or supplementary materials provided to ascertain if additional resources or data are available.
14. How can I stay updated on further developments or reports in the Radioactive Isotope Labeling Services?
To stay informed about further developments, trends, and reports in the Radioactive Isotope Labeling Services, consider subscribing to industry newsletters, following relevant companies and organizations, or regularly checking reputable industry news sources and publications.
Methodology
Step 1 - Identification of Relevant Samples Size from Population Database



Step 2 - Approaches for Defining Global Market Size (Value, Volume* & Price*)

Note*: In applicable scenarios
Step 3 - Data Sources
Primary Research
- Web Analytics
- Survey Reports
- Research Institute
- Latest Research Reports
- Opinion Leaders
Secondary Research
- Annual Reports
- White Paper
- Latest Press Release
- Industry Association
- Paid Database
- Investor Presentations

Step 4 - Data Triangulation
Involves using different sources of information in order to increase the validity of a study
These sources are likely to be stakeholders in a program - participants, other researchers, program staff, other community members, and so on.
Then we put all data in single framework & apply various statistical tools to find out the dynamic on the market.
During the analysis stage, feedback from the stakeholder groups would be compared to determine areas of agreement as well as areas of divergence