

Key Insights
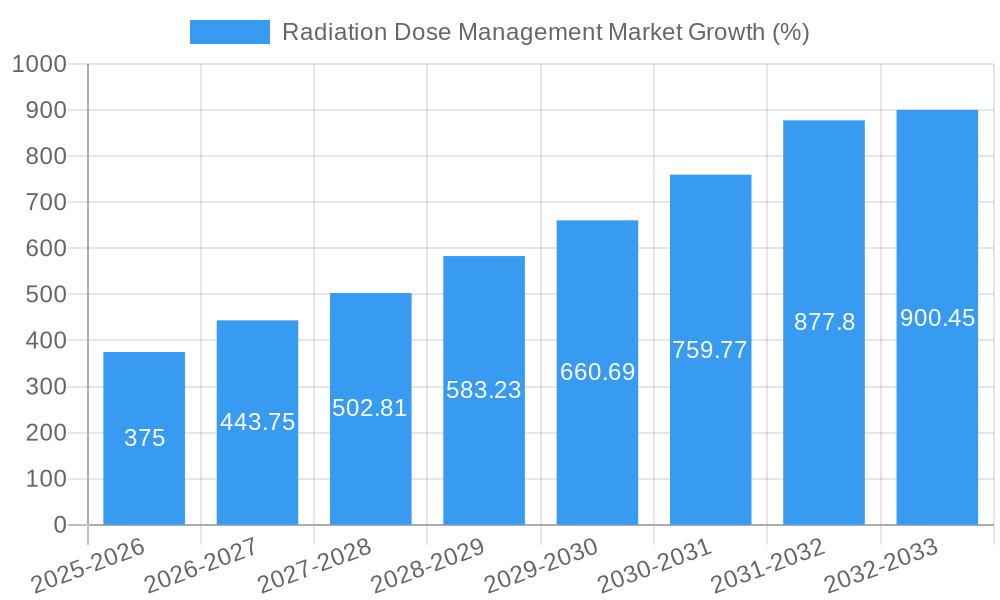
The Radiation Dose Management market is experiencing robust growth, projected to reach a significant size by 2033, driven by a 15% CAGR. This expansion is fueled by several key factors. Firstly, the increasing awareness of the risks associated with ionizing radiation in medical imaging, coupled with stricter regulatory guidelines aimed at minimizing patient exposure, is creating a strong demand for effective dose management solutions. Advancements in technology, such as AI-powered dose optimization tools and sophisticated image reconstruction techniques, are contributing significantly to market growth. The rising prevalence of chronic diseases requiring frequent imaging procedures further fuels this demand. The market is segmented by end-user (ambulatory care, hospitals, others), products & services (standalone solutions, integrated solutions, services), and modality (CT, fluoroscopy, nuclear medicine, radiography/mammography). Hospitals currently represent a larger segment, but ambulatory care settings are experiencing rapid growth due to increasing outpatient procedures. Integrated solutions are gaining traction over standalone offerings due to improved workflow efficiency and data management capabilities. Geographically, North America and Europe hold significant market shares, driven by advanced healthcare infrastructure and stringent regulations. However, the Asia-Pacific region is expected to witness the fastest growth, fueled by increasing healthcare expenditure and rising adoption of advanced imaging technologies.
Competition in the market is intense, with major players like GE Healthcare, Philips, and Fujifilm vying for market share alongside specialized companies such as MedSquare and Qaelum. The market's future growth will depend on continued technological innovation, regulatory support for dose reduction initiatives, and expanding awareness among healthcare professionals about the benefits of efficient dose management practices. The increasing integration of AI and machine learning into dose management systems is expected to further drive market expansion, particularly in areas like automated dose optimization and predictive modeling to personalize radiation doses based on individual patient characteristics. Cost-effectiveness and ease of integration into existing hospital workflows will be crucial factors influencing the adoption of these solutions. The sustained focus on patient safety and the increasing pressure to reduce healthcare costs will shape the strategic direction of market participants in the coming years.
Radiation Dose Management Market: A Comprehensive Report (2019-2033)
This insightful report provides a detailed analysis of the global Radiation Dose Management Market, offering a comprehensive overview of market trends, key players, and future growth prospects. The study period spans from 2019 to 2033, with 2025 serving as the base and estimated year. The market is projected to reach xx Million by 2033, exhibiting a Compound Annual Growth Rate (CAGR) of xx% during the forecast period (2025-2033). This report is indispensable for stakeholders seeking to understand the current market landscape and make informed strategic decisions.
Radiation Dose Management Market Composition & Trends
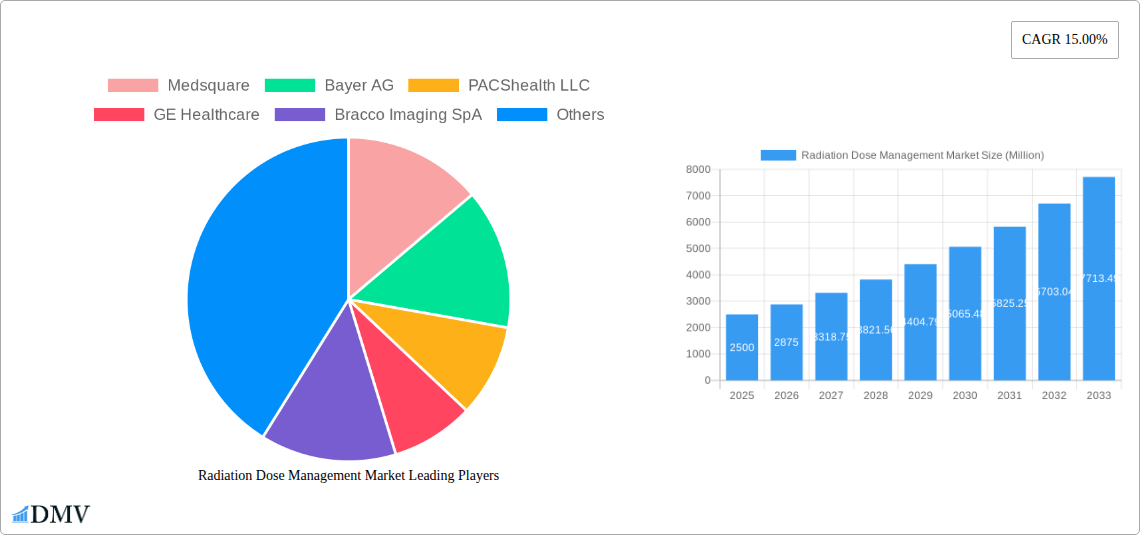
This section delves into the competitive dynamics of the Radiation Dose Management market, analyzing market concentration, innovation drivers, regulatory landscapes, substitute products, end-user profiles, and mergers and acquisitions (M&A) activities. The market exhibits a moderately concentrated structure, with key players such as Medsquare, Bayer AG, and GE Healthcare holding significant market share. However, the emergence of smaller, innovative companies is increasing competition. The market share distribution is estimated as follows in 2025: Top 5 players hold approximately 60% of the market, with the remaining 40% distributed among numerous smaller players. Innovation is driven by the need for improved dose reduction techniques and advanced imaging technologies, shaped by stringent regulatory landscapes mandating lower radiation exposure. Substitute products, like ultrasound and MRI, present competitive challenges, while the market is segmented across diverse end users: hospitals, ambulatory care settings, and other end-users. M&A activity is moderate, with deal values averaging approximately xx Million in the last five years. Key observations include:
- Market Concentration: Moderately concentrated, with a significant presence of established players.
- Innovation Catalysts: Demand for improved dose reduction techniques and advanced imaging technologies.
- Regulatory Landscape: Stringent regulations driving innovation and adoption of dose-reducing technologies.
- Substitute Products: Ultrasound and MRI pose competitive challenges.
- End-User Profiles: Hospitals, ambulatory care settings, and other end-users represent diverse market segments.
- M&A Activity: Moderate activity, with average deal values around xx Million in the past 5 years.
Radiation Dose Management Market Industry Evolution
The Radiation Dose Management market has witnessed significant growth over the historical period (2019-2024), driven by factors such as increasing awareness of radiation risks, technological advancements, and rising demand for advanced imaging modalities. The market's growth trajectory is expected to continue during the forecast period, fueled by the growing adoption of advanced dose reduction technologies and increasing focus on patient safety. Technological advancements, such as AI-powered dose optimization software and improved detector technology, are pivotal in shaping market dynamics. Furthermore, a shift towards value-based healthcare, emphasizing cost-effectiveness and efficiency, further influences the adoption of these technologies. This focus on patient safety and cost-efficiency is driving the demand for sophisticated dose management solutions across various healthcare settings. The market experienced a CAGR of approximately xx% between 2019 and 2024. Projections indicate a CAGR of approximately xx% between 2025 and 2033, with the market size anticipated to reach xx Million by 2033. Specific data on technology adoption rates is currently unavailable and will be updated in the full report.
Leading Regions, Countries, or Segments in Radiation Dose Management Market
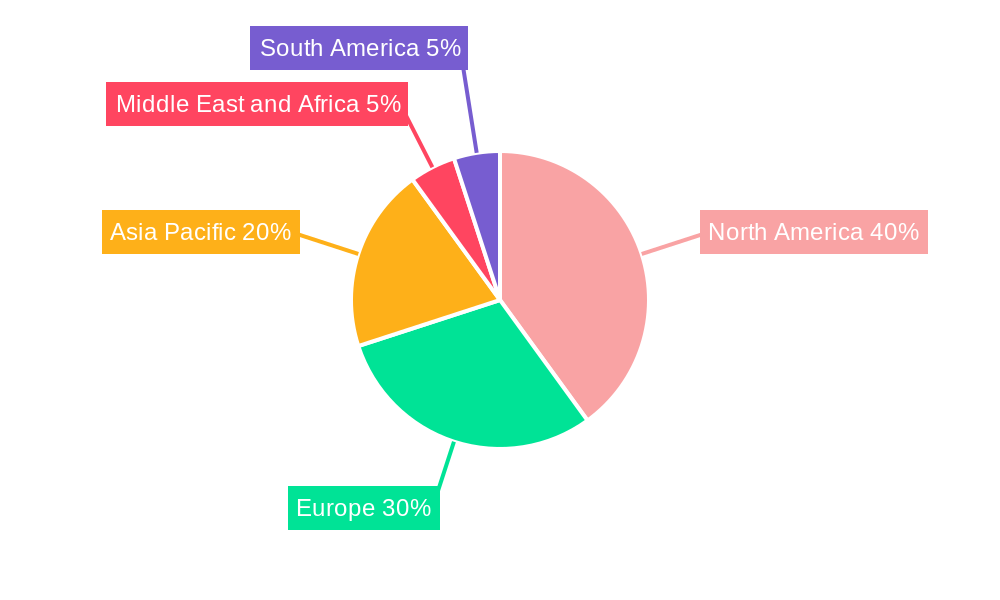
The North American region currently dominates the Radiation Dose Management market, driven by factors such as high healthcare expenditure, advanced healthcare infrastructure, and early adoption of innovative technologies. However, the Asia-Pacific region is projected to experience significant growth during the forecast period, fueled by rising healthcare investments, increasing prevalence of chronic diseases, and expanding healthcare infrastructure.
Key Drivers by Segment:
- By End User:
- Hospitals: High adoption rates driven by large patient volumes and advanced imaging capabilities.
- Ambulatory Care Settings: Growing adoption due to increasing demand for outpatient procedures and cost-effectiveness.
- Other End Users: Steady growth driven by the expanding use of radiation in research and industrial applications.
- By Products & Services:
- Integrated Solutions: High demand driven by improved workflow efficiency and streamlined data management.
- Standalone Solutions: Significant adoption, particularly in smaller facilities with limited resources.
- Services: Growing demand for expert consultation and support services to optimize radiation dose management.
- By Modality:
- Computed Tomography (CT): High market share due to widespread use and potential for dose reduction.
- Fluoroscopy and Interventional Imaging: Significant adoption driven by the need for precise dose control in minimally invasive procedures.
- Nuclear Medicine: Steady growth due to the specific requirements for precise radiation dose management in nuclear medicine applications.
- Radiography and Mammography: Market growth driven by the necessity of optimizing radiation exposure while maintaining image quality.
The dominance of North America is attributed to factors such as robust regulatory frameworks supporting the adoption of dose-reduction technologies, extensive investments in R&D, and the presence of major industry players. The growth potential in the Asia-Pacific region is linked to rising disposable incomes, increasing healthcare awareness, and supportive government initiatives.
Radiation Dose Management Market Product Innovations
Recent innovations in the Radiation Dose Management market focus on AI-powered dose optimization software, advanced detector technology, and improved image reconstruction algorithms. These innovations aim to minimize radiation exposure while maintaining or improving image quality. Unique selling propositions include enhanced dose reduction capabilities, improved workflow efficiency, and streamlined integration with existing imaging systems. The adoption of these innovations is driven by the increasing demand for cost-effective, high-quality imaging solutions with minimized radiation exposure.
Propelling Factors for Radiation Dose Management Market Growth
Several factors contribute to the growth of the Radiation Dose Management market. These include the increasing awareness of the long-term health risks associated with ionizing radiation, stringent regulatory guidelines emphasizing dose reduction, technological advancements in image processing and radiation delivery, and rising healthcare spending globally. These factors are creating a strong market demand for advanced dose management solutions across healthcare settings.
Obstacles in the Radiation Dose Management Market
Challenges hindering market growth include the high initial cost of implementing advanced dose management technologies, potential resistance to adopting new technologies within existing healthcare workflows, and the complexity of integrating these technologies into diverse imaging systems. Regulatory hurdles, such as variations in regulatory standards across different regions, also add to the complexities.
Future Opportunities in Radiation Dose Management Market
Future opportunities lie in expanding into emerging markets, developing personalized dose management solutions, and integrating advanced technologies like AI and machine learning for enhanced dose reduction and image quality. The market is poised for growth driven by the development of new imaging modalities, the increasing prevalence of chronic diseases, and the continuing focus on patient safety.
Major Players in the Radiation Dose Management Market Ecosystem
- Medsquare
- Bayer AG
- PACShealth LLC
- GE Healthcare
- Bracco Imaging SpA
- Koninklijke Philips N V
- Qaelum NV
- Sectra AB
- Novarad Corporation
- Fujifilm Holdings Corporation
Key Developments in Radiation Dose Management Market Industry
- 2023 (Q4): Medsquare launched a new AI-powered dose optimization software.
- 2022 (Q3): Bayer AG acquired a smaller radiation dose management company, expanding its portfolio.
- 2021 (Q2): GE Healthcare introduced a new generation of low-dose CT scanners.
- Further details on key developments will be provided in the full report.
Strategic Radiation Dose Management Market Forecast
The Radiation Dose Management market is poised for continued growth, driven by technological advancements, increasing regulatory pressure for dose reduction, and rising healthcare spending. The market's future is bright, with opportunities for innovative companies to capture market share by offering advanced solutions that enhance both image quality and patient safety. The focus on value-based care and cost-effectiveness will further drive the adoption of these solutions, leading to a robust and sustainable market in the coming years.
Radiation Dose Management Market Segmentation
-
1. Products & Services
- 1.1. Standalone Solutions
- 1.2. Integrated Solutions
-
2. Modality
- 2.1. Computed Tomography
- 2.2. Fluoroscopy and Interventional Imaging
- 2.3. Nuclear Medicine
- 2.4. Radiography and Mammography
-
3. End User
- 3.1. Ambulatory Care Settings
- 3.2. Hospital
- 3.3. Other End Users
Radiation Dose Management Market Segmentation By Geography
-
1. North America
- 1.1. United States
- 1.2. Canada
- 1.3. Mexico
-
2. Europe
- 2.1. Germany
- 2.2. United Kingdom
- 2.3. France
- 2.4. Italy
- 2.5. Spain
- 2.6. Rest of Europe
-
3. Asia Pacific
- 3.1. China
- 3.2. Japan
- 3.3. India
- 3.4. Australia
- 3.5. South Korea
- 3.6. Rest of Asia Pacific
-
4. Middle East and Africa
- 4.1. GCC
- 4.2. South Africa
- 4.3. Rest of Middle East and Africa
-
5. South America
- 5.1. Brazil
- 5.2. Argentina
- 5.3. Rest of South America
Radiation Dose Management Market REPORT HIGHLIGHTS
| Aspects | Details |
|---|---|
| Study Period | 2019-2033 |
| Base Year | 2024 |
| Estimated Year | 2025 |
| Forecast Period | 2025-2033 |
| Historical Period | 2019-2024 |
| Growth Rate | CAGR of 15.00% from 2019-2033 |
| Segmentation |
|
Table of Contents
- 1. Introduction
- 1.1. Research Scope
- 1.2. Market Segmentation
- 1.3. Research Methodology
- 1.4. Definitions and Assumptions
- 2. Executive Summary
- 2.1. Introduction
- 3. Market Dynamics
- 3.1. Introduction
- 3.2. Market Drivers
- 3.2.1. ; Rising Cases of Chronic Diseases Demanding Radiation Therapy; Increasing Concerns over Radiation Overexposure; Rising Awareness and Industry Initiatives for Radiation Dose Management
- 3.3. Market Restrains
- 3.3.1. ; Low Adoption of radiation Dose Management Solutions in Emerging Countries
- 3.4. Market Trends
- 3.4.1. Computed Tomography is Expected to Register Highest CAGR in the Modality Segment
- 4. Market Factor Analysis
- 4.1. Porters Five Forces
- 4.2. Supply/Value Chain
- 4.3. PESTEL analysis
- 4.4. Market Entropy
- 4.5. Patent/Trademark Analysis
- 5. Global Radiation Dose Management Market Analysis, Insights and Forecast, 2019-2031
- 5.1. Market Analysis, Insights and Forecast - by Products & Services
- 5.1.1. Standalone Solutions
- 5.1.2. Integrated Solutions
- 5.2. Market Analysis, Insights and Forecast - by Modality
- 5.2.1. Computed Tomography
- 5.2.2. Fluoroscopy and Interventional Imaging
- 5.2.3. Nuclear Medicine
- 5.2.4. Radiography and Mammography
- 5.3. Market Analysis, Insights and Forecast - by End User
- 5.3.1. Ambulatory Care Settings
- 5.3.2. Hospital
- 5.3.3. Other End Users
- 5.4. Market Analysis, Insights and Forecast - by Region
- 5.4.1. North America
- 5.4.2. Europe
- 5.4.3. Asia Pacific
- 5.4.4. Middle East and Africa
- 5.4.5. South America
- 5.1. Market Analysis, Insights and Forecast - by Products & Services
- 6. North America Radiation Dose Management Market Analysis, Insights and Forecast, 2019-2031
- 6.1. Market Analysis, Insights and Forecast - by Products & Services
- 6.1.1. Standalone Solutions
- 6.1.2. Integrated Solutions
- 6.2. Market Analysis, Insights and Forecast - by Modality
- 6.2.1. Computed Tomography
- 6.2.2. Fluoroscopy and Interventional Imaging
- 6.2.3. Nuclear Medicine
- 6.2.4. Radiography and Mammography
- 6.3. Market Analysis, Insights and Forecast - by End User
- 6.3.1. Ambulatory Care Settings
- 6.3.2. Hospital
- 6.3.3. Other End Users
- 6.1. Market Analysis, Insights and Forecast - by Products & Services
- 7. Europe Radiation Dose Management Market Analysis, Insights and Forecast, 2019-2031
- 7.1. Market Analysis, Insights and Forecast - by Products & Services
- 7.1.1. Standalone Solutions
- 7.1.2. Integrated Solutions
- 7.2. Market Analysis, Insights and Forecast - by Modality
- 7.2.1. Computed Tomography
- 7.2.2. Fluoroscopy and Interventional Imaging
- 7.2.3. Nuclear Medicine
- 7.2.4. Radiography and Mammography
- 7.3. Market Analysis, Insights and Forecast - by End User
- 7.3.1. Ambulatory Care Settings
- 7.3.2. Hospital
- 7.3.3. Other End Users
- 7.1. Market Analysis, Insights and Forecast - by Products & Services
- 8. Asia Pacific Radiation Dose Management Market Analysis, Insights and Forecast, 2019-2031
- 8.1. Market Analysis, Insights and Forecast - by Products & Services
- 8.1.1. Standalone Solutions
- 8.1.2. Integrated Solutions
- 8.2. Market Analysis, Insights and Forecast - by Modality
- 8.2.1. Computed Tomography
- 8.2.2. Fluoroscopy and Interventional Imaging
- 8.2.3. Nuclear Medicine
- 8.2.4. Radiography and Mammography
- 8.3. Market Analysis, Insights and Forecast - by End User
- 8.3.1. Ambulatory Care Settings
- 8.3.2. Hospital
- 8.3.3. Other End Users
- 8.1. Market Analysis, Insights and Forecast - by Products & Services
- 9. Middle East and Africa Radiation Dose Management Market Analysis, Insights and Forecast, 2019-2031
- 9.1. Market Analysis, Insights and Forecast - by Products & Services
- 9.1.1. Standalone Solutions
- 9.1.2. Integrated Solutions
- 9.2. Market Analysis, Insights and Forecast - by Modality
- 9.2.1. Computed Tomography
- 9.2.2. Fluoroscopy and Interventional Imaging
- 9.2.3. Nuclear Medicine
- 9.2.4. Radiography and Mammography
- 9.3. Market Analysis, Insights and Forecast - by End User
- 9.3.1. Ambulatory Care Settings
- 9.3.2. Hospital
- 9.3.3. Other End Users
- 9.1. Market Analysis, Insights and Forecast - by Products & Services
- 10. South America Radiation Dose Management Market Analysis, Insights and Forecast, 2019-2031
- 10.1. Market Analysis, Insights and Forecast - by Products & Services
- 10.1.1. Standalone Solutions
- 10.1.2. Integrated Solutions
- 10.2. Market Analysis, Insights and Forecast - by Modality
- 10.2.1. Computed Tomography
- 10.2.2. Fluoroscopy and Interventional Imaging
- 10.2.3. Nuclear Medicine
- 10.2.4. Radiography and Mammography
- 10.3. Market Analysis, Insights and Forecast - by End User
- 10.3.1. Ambulatory Care Settings
- 10.3.2. Hospital
- 10.3.3. Other End Users
- 10.1. Market Analysis, Insights and Forecast - by Products & Services
- 11. North America Radiation Dose Management Market Analysis, Insights and Forecast, 2019-2031
- 11.1. Market Analysis, Insights and Forecast - By Country/Sub-region
- 11.1.1 United States
- 11.1.2 Canada
- 11.1.3 Mexico
- 12. Europe Radiation Dose Management Market Analysis, Insights and Forecast, 2019-2031
- 12.1. Market Analysis, Insights and Forecast - By Country/Sub-region
- 12.1.1 Germany
- 12.1.2 United Kingdom
- 12.1.3 France
- 12.1.4 Italy
- 12.1.5 Spain
- 12.1.6 Rest of Europe
- 13. Asia Pacific Radiation Dose Management Market Analysis, Insights and Forecast, 2019-2031
- 13.1. Market Analysis, Insights and Forecast - By Country/Sub-region
- 13.1.1 China
- 13.1.2 Japan
- 13.1.3 India
- 13.1.4 Australia
- 13.1.5 South Korea
- 13.1.6 Rest of Asia Pacific
- 14. Middle East and Africa Radiation Dose Management Market Analysis, Insights and Forecast, 2019-2031
- 14.1. Market Analysis, Insights and Forecast - By Country/Sub-region
- 14.1.1 GCC
- 14.1.2 South Africa
- 14.1.3 Rest of Middle East and Africa
- 15. South America Radiation Dose Management Market Analysis, Insights and Forecast, 2019-2031
- 15.1. Market Analysis, Insights and Forecast - By Country/Sub-region
- 15.1.1 Brazil
- 15.1.2 Argentina
- 15.1.3 Rest of South America
- 16. Competitive Analysis
- 16.1. Global Market Share Analysis 2024
- 16.2. Company Profiles
- 16.2.1 Medsquare
- 16.2.1.1. Overview
- 16.2.1.2. Products
- 16.2.1.3. SWOT Analysis
- 16.2.1.4. Recent Developments
- 16.2.1.5. Financials (Based on Availability)
- 16.2.2 Bayer AG
- 16.2.2.1. Overview
- 16.2.2.2. Products
- 16.2.2.3. SWOT Analysis
- 16.2.2.4. Recent Developments
- 16.2.2.5. Financials (Based on Availability)
- 16.2.3 PACShealth LLC
- 16.2.3.1. Overview
- 16.2.3.2. Products
- 16.2.3.3. SWOT Analysis
- 16.2.3.4. Recent Developments
- 16.2.3.5. Financials (Based on Availability)
- 16.2.4 GE Healthcare
- 16.2.4.1. Overview
- 16.2.4.2. Products
- 16.2.4.3. SWOT Analysis
- 16.2.4.4. Recent Developments
- 16.2.4.5. Financials (Based on Availability)
- 16.2.5 Bracco Imaging SpA
- 16.2.5.1. Overview
- 16.2.5.2. Products
- 16.2.5.3. SWOT Analysis
- 16.2.5.4. Recent Developments
- 16.2.5.5. Financials (Based on Availability)
- 16.2.6 Koninklijke Philips N V
- 16.2.6.1. Overview
- 16.2.6.2. Products
- 16.2.6.3. SWOT Analysis
- 16.2.6.4. Recent Developments
- 16.2.6.5. Financials (Based on Availability)
- 16.2.7 Qaelum NV
- 16.2.7.1. Overview
- 16.2.7.2. Products
- 16.2.7.3. SWOT Analysis
- 16.2.7.4. Recent Developments
- 16.2.7.5. Financials (Based on Availability)
- 16.2.8 Sectra AB*List Not Exhaustive
- 16.2.8.1. Overview
- 16.2.8.2. Products
- 16.2.8.3. SWOT Analysis
- 16.2.8.4. Recent Developments
- 16.2.8.5. Financials (Based on Availability)
- 16.2.9 Novarad Corporation
- 16.2.9.1. Overview
- 16.2.9.2. Products
- 16.2.9.3. SWOT Analysis
- 16.2.9.4. Recent Developments
- 16.2.9.5. Financials (Based on Availability)
- 16.2.10 Fujifilm Holdings Corporation
- 16.2.10.1. Overview
- 16.2.10.2. Products
- 16.2.10.3. SWOT Analysis
- 16.2.10.4. Recent Developments
- 16.2.10.5. Financials (Based on Availability)
- 16.2.1 Medsquare
List of Figures
- Figure 1: Global Radiation Dose Management Market Revenue Breakdown (Million, %) by Region 2024 & 2032
- Figure 2: North America Radiation Dose Management Market Revenue (Million), by Country 2024 & 2032
- Figure 3: North America Radiation Dose Management Market Revenue Share (%), by Country 2024 & 2032
- Figure 4: Europe Radiation Dose Management Market Revenue (Million), by Country 2024 & 2032
- Figure 5: Europe Radiation Dose Management Market Revenue Share (%), by Country 2024 & 2032
- Figure 6: Asia Pacific Radiation Dose Management Market Revenue (Million), by Country 2024 & 2032
- Figure 7: Asia Pacific Radiation Dose Management Market Revenue Share (%), by Country 2024 & 2032
- Figure 8: Middle East and Africa Radiation Dose Management Market Revenue (Million), by Country 2024 & 2032
- Figure 9: Middle East and Africa Radiation Dose Management Market Revenue Share (%), by Country 2024 & 2032
- Figure 10: South America Radiation Dose Management Market Revenue (Million), by Country 2024 & 2032
- Figure 11: South America Radiation Dose Management Market Revenue Share (%), by Country 2024 & 2032
- Figure 12: North America Radiation Dose Management Market Revenue (Million), by Products & Services 2024 & 2032
- Figure 13: North America Radiation Dose Management Market Revenue Share (%), by Products & Services 2024 & 2032
- Figure 14: North America Radiation Dose Management Market Revenue (Million), by Modality 2024 & 2032
- Figure 15: North America Radiation Dose Management Market Revenue Share (%), by Modality 2024 & 2032
- Figure 16: North America Radiation Dose Management Market Revenue (Million), by End User 2024 & 2032
- Figure 17: North America Radiation Dose Management Market Revenue Share (%), by End User 2024 & 2032
- Figure 18: North America Radiation Dose Management Market Revenue (Million), by Country 2024 & 2032
- Figure 19: North America Radiation Dose Management Market Revenue Share (%), by Country 2024 & 2032
- Figure 20: Europe Radiation Dose Management Market Revenue (Million), by Products & Services 2024 & 2032
- Figure 21: Europe Radiation Dose Management Market Revenue Share (%), by Products & Services 2024 & 2032
- Figure 22: Europe Radiation Dose Management Market Revenue (Million), by Modality 2024 & 2032
- Figure 23: Europe Radiation Dose Management Market Revenue Share (%), by Modality 2024 & 2032
- Figure 24: Europe Radiation Dose Management Market Revenue (Million), by End User 2024 & 2032
- Figure 25: Europe Radiation Dose Management Market Revenue Share (%), by End User 2024 & 2032
- Figure 26: Europe Radiation Dose Management Market Revenue (Million), by Country 2024 & 2032
- Figure 27: Europe Radiation Dose Management Market Revenue Share (%), by Country 2024 & 2032
- Figure 28: Asia Pacific Radiation Dose Management Market Revenue (Million), by Products & Services 2024 & 2032
- Figure 29: Asia Pacific Radiation Dose Management Market Revenue Share (%), by Products & Services 2024 & 2032
- Figure 30: Asia Pacific Radiation Dose Management Market Revenue (Million), by Modality 2024 & 2032
- Figure 31: Asia Pacific Radiation Dose Management Market Revenue Share (%), by Modality 2024 & 2032
- Figure 32: Asia Pacific Radiation Dose Management Market Revenue (Million), by End User 2024 & 2032
- Figure 33: Asia Pacific Radiation Dose Management Market Revenue Share (%), by End User 2024 & 2032
- Figure 34: Asia Pacific Radiation Dose Management Market Revenue (Million), by Country 2024 & 2032
- Figure 35: Asia Pacific Radiation Dose Management Market Revenue Share (%), by Country 2024 & 2032
- Figure 36: Middle East and Africa Radiation Dose Management Market Revenue (Million), by Products & Services 2024 & 2032
- Figure 37: Middle East and Africa Radiation Dose Management Market Revenue Share (%), by Products & Services 2024 & 2032
- Figure 38: Middle East and Africa Radiation Dose Management Market Revenue (Million), by Modality 2024 & 2032
- Figure 39: Middle East and Africa Radiation Dose Management Market Revenue Share (%), by Modality 2024 & 2032
- Figure 40: Middle East and Africa Radiation Dose Management Market Revenue (Million), by End User 2024 & 2032
- Figure 41: Middle East and Africa Radiation Dose Management Market Revenue Share (%), by End User 2024 & 2032
- Figure 42: Middle East and Africa Radiation Dose Management Market Revenue (Million), by Country 2024 & 2032
- Figure 43: Middle East and Africa Radiation Dose Management Market Revenue Share (%), by Country 2024 & 2032
- Figure 44: South America Radiation Dose Management Market Revenue (Million), by Products & Services 2024 & 2032
- Figure 45: South America Radiation Dose Management Market Revenue Share (%), by Products & Services 2024 & 2032
- Figure 46: South America Radiation Dose Management Market Revenue (Million), by Modality 2024 & 2032
- Figure 47: South America Radiation Dose Management Market Revenue Share (%), by Modality 2024 & 2032
- Figure 48: South America Radiation Dose Management Market Revenue (Million), by End User 2024 & 2032
- Figure 49: South America Radiation Dose Management Market Revenue Share (%), by End User 2024 & 2032
- Figure 50: South America Radiation Dose Management Market Revenue (Million), by Country 2024 & 2032
- Figure 51: South America Radiation Dose Management Market Revenue Share (%), by Country 2024 & 2032
List of Tables
- Table 1: Global Radiation Dose Management Market Revenue Million Forecast, by Region 2019 & 2032
- Table 2: Global Radiation Dose Management Market Revenue Million Forecast, by Products & Services 2019 & 2032
- Table 3: Global Radiation Dose Management Market Revenue Million Forecast, by Modality 2019 & 2032
- Table 4: Global Radiation Dose Management Market Revenue Million Forecast, by End User 2019 & 2032
- Table 5: Global Radiation Dose Management Market Revenue Million Forecast, by Region 2019 & 2032
- Table 6: Global Radiation Dose Management Market Revenue Million Forecast, by Country 2019 & 2032
- Table 7: United States Radiation Dose Management Market Revenue (Million) Forecast, by Application 2019 & 2032
- Table 8: Canada Radiation Dose Management Market Revenue (Million) Forecast, by Application 2019 & 2032
- Table 9: Mexico Radiation Dose Management Market Revenue (Million) Forecast, by Application 2019 & 2032
- Table 10: Global Radiation Dose Management Market Revenue Million Forecast, by Country 2019 & 2032
- Table 11: Germany Radiation Dose Management Market Revenue (Million) Forecast, by Application 2019 & 2032
- Table 12: United Kingdom Radiation Dose Management Market Revenue (Million) Forecast, by Application 2019 & 2032
- Table 13: France Radiation Dose Management Market Revenue (Million) Forecast, by Application 2019 & 2032
- Table 14: Italy Radiation Dose Management Market Revenue (Million) Forecast, by Application 2019 & 2032
- Table 15: Spain Radiation Dose Management Market Revenue (Million) Forecast, by Application 2019 & 2032
- Table 16: Rest of Europe Radiation Dose Management Market Revenue (Million) Forecast, by Application 2019 & 2032
- Table 17: Global Radiation Dose Management Market Revenue Million Forecast, by Country 2019 & 2032
- Table 18: China Radiation Dose Management Market Revenue (Million) Forecast, by Application 2019 & 2032
- Table 19: Japan Radiation Dose Management Market Revenue (Million) Forecast, by Application 2019 & 2032
- Table 20: India Radiation Dose Management Market Revenue (Million) Forecast, by Application 2019 & 2032
- Table 21: Australia Radiation Dose Management Market Revenue (Million) Forecast, by Application 2019 & 2032
- Table 22: South Korea Radiation Dose Management Market Revenue (Million) Forecast, by Application 2019 & 2032
- Table 23: Rest of Asia Pacific Radiation Dose Management Market Revenue (Million) Forecast, by Application 2019 & 2032
- Table 24: Global Radiation Dose Management Market Revenue Million Forecast, by Country 2019 & 2032
- Table 25: GCC Radiation Dose Management Market Revenue (Million) Forecast, by Application 2019 & 2032
- Table 26: South Africa Radiation Dose Management Market Revenue (Million) Forecast, by Application 2019 & 2032
- Table 27: Rest of Middle East and Africa Radiation Dose Management Market Revenue (Million) Forecast, by Application 2019 & 2032
- Table 28: Global Radiation Dose Management Market Revenue Million Forecast, by Country 2019 & 2032
- Table 29: Brazil Radiation Dose Management Market Revenue (Million) Forecast, by Application 2019 & 2032
- Table 30: Argentina Radiation Dose Management Market Revenue (Million) Forecast, by Application 2019 & 2032
- Table 31: Rest of South America Radiation Dose Management Market Revenue (Million) Forecast, by Application 2019 & 2032
- Table 32: Global Radiation Dose Management Market Revenue Million Forecast, by Products & Services 2019 & 2032
- Table 33: Global Radiation Dose Management Market Revenue Million Forecast, by Modality 2019 & 2032
- Table 34: Global Radiation Dose Management Market Revenue Million Forecast, by End User 2019 & 2032
- Table 35: Global Radiation Dose Management Market Revenue Million Forecast, by Country 2019 & 2032
- Table 36: United States Radiation Dose Management Market Revenue (Million) Forecast, by Application 2019 & 2032
- Table 37: Canada Radiation Dose Management Market Revenue (Million) Forecast, by Application 2019 & 2032
- Table 38: Mexico Radiation Dose Management Market Revenue (Million) Forecast, by Application 2019 & 2032
- Table 39: Global Radiation Dose Management Market Revenue Million Forecast, by Products & Services 2019 & 2032
- Table 40: Global Radiation Dose Management Market Revenue Million Forecast, by Modality 2019 & 2032
- Table 41: Global Radiation Dose Management Market Revenue Million Forecast, by End User 2019 & 2032
- Table 42: Global Radiation Dose Management Market Revenue Million Forecast, by Country 2019 & 2032
- Table 43: Germany Radiation Dose Management Market Revenue (Million) Forecast, by Application 2019 & 2032
- Table 44: United Kingdom Radiation Dose Management Market Revenue (Million) Forecast, by Application 2019 & 2032
- Table 45: France Radiation Dose Management Market Revenue (Million) Forecast, by Application 2019 & 2032
- Table 46: Italy Radiation Dose Management Market Revenue (Million) Forecast, by Application 2019 & 2032
- Table 47: Spain Radiation Dose Management Market Revenue (Million) Forecast, by Application 2019 & 2032
- Table 48: Rest of Europe Radiation Dose Management Market Revenue (Million) Forecast, by Application 2019 & 2032
- Table 49: Global Radiation Dose Management Market Revenue Million Forecast, by Products & Services 2019 & 2032
- Table 50: Global Radiation Dose Management Market Revenue Million Forecast, by Modality 2019 & 2032
- Table 51: Global Radiation Dose Management Market Revenue Million Forecast, by End User 2019 & 2032
- Table 52: Global Radiation Dose Management Market Revenue Million Forecast, by Country 2019 & 2032
- Table 53: China Radiation Dose Management Market Revenue (Million) Forecast, by Application 2019 & 2032
- Table 54: Japan Radiation Dose Management Market Revenue (Million) Forecast, by Application 2019 & 2032
- Table 55: India Radiation Dose Management Market Revenue (Million) Forecast, by Application 2019 & 2032
- Table 56: Australia Radiation Dose Management Market Revenue (Million) Forecast, by Application 2019 & 2032
- Table 57: South Korea Radiation Dose Management Market Revenue (Million) Forecast, by Application 2019 & 2032
- Table 58: Rest of Asia Pacific Radiation Dose Management Market Revenue (Million) Forecast, by Application 2019 & 2032
- Table 59: Global Radiation Dose Management Market Revenue Million Forecast, by Products & Services 2019 & 2032
- Table 60: Global Radiation Dose Management Market Revenue Million Forecast, by Modality 2019 & 2032
- Table 61: Global Radiation Dose Management Market Revenue Million Forecast, by End User 2019 & 2032
- Table 62: Global Radiation Dose Management Market Revenue Million Forecast, by Country 2019 & 2032
- Table 63: GCC Radiation Dose Management Market Revenue (Million) Forecast, by Application 2019 & 2032
- Table 64: South Africa Radiation Dose Management Market Revenue (Million) Forecast, by Application 2019 & 2032
- Table 65: Rest of Middle East and Africa Radiation Dose Management Market Revenue (Million) Forecast, by Application 2019 & 2032
- Table 66: Global Radiation Dose Management Market Revenue Million Forecast, by Products & Services 2019 & 2032
- Table 67: Global Radiation Dose Management Market Revenue Million Forecast, by Modality 2019 & 2032
- Table 68: Global Radiation Dose Management Market Revenue Million Forecast, by End User 2019 & 2032
- Table 69: Global Radiation Dose Management Market Revenue Million Forecast, by Country 2019 & 2032
- Table 70: Brazil Radiation Dose Management Market Revenue (Million) Forecast, by Application 2019 & 2032
- Table 71: Argentina Radiation Dose Management Market Revenue (Million) Forecast, by Application 2019 & 2032
- Table 72: Rest of South America Radiation Dose Management Market Revenue (Million) Forecast, by Application 2019 & 2032
Frequently Asked Questions
1. What is the projected Compound Annual Growth Rate (CAGR) of the Radiation Dose Management Market?
The projected CAGR is approximately 15.00%.
2. Which companies are prominent players in the Radiation Dose Management Market?
Key companies in the market include Medsquare, Bayer AG, PACShealth LLC, GE Healthcare, Bracco Imaging SpA, Koninklijke Philips N V, Qaelum NV, Sectra AB*List Not Exhaustive, Novarad Corporation, Fujifilm Holdings Corporation.
3. What are the main segments of the Radiation Dose Management Market?
The market segments include Products & Services, Modality, End User.
4. Can you provide details about the market size?
The market size is estimated to be USD XX Million as of 2022.
5. What are some drivers contributing to market growth?
; Rising Cases of Chronic Diseases Demanding Radiation Therapy; Increasing Concerns over Radiation Overexposure; Rising Awareness and Industry Initiatives for Radiation Dose Management.
6. What are the notable trends driving market growth?
Computed Tomography is Expected to Register Highest CAGR in the Modality Segment.
7. Are there any restraints impacting market growth?
; Low Adoption of radiation Dose Management Solutions in Emerging Countries.
8. Can you provide examples of recent developments in the market?
N/A
9. What pricing options are available for accessing the report?
Pricing options include single-user, multi-user, and enterprise licenses priced at USD 4750, USD 5250, and USD 8750 respectively.
10. Is the market size provided in terms of value or volume?
The market size is provided in terms of value, measured in Million.
11. Are there any specific market keywords associated with the report?
Yes, the market keyword associated with the report is "Radiation Dose Management Market," which aids in identifying and referencing the specific market segment covered.
12. How do I determine which pricing option suits my needs best?
The pricing options vary based on user requirements and access needs. Individual users may opt for single-user licenses, while businesses requiring broader access may choose multi-user or enterprise licenses for cost-effective access to the report.
13. Are there any additional resources or data provided in the Radiation Dose Management Market report?
While the report offers comprehensive insights, it's advisable to review the specific contents or supplementary materials provided to ascertain if additional resources or data are available.
14. How can I stay updated on further developments or reports in the Radiation Dose Management Market?
To stay informed about further developments, trends, and reports in the Radiation Dose Management Market, consider subscribing to industry newsletters, following relevant companies and organizations, or regularly checking reputable industry news sources and publications.
Methodology
Step 1 - Identification of Relevant Samples Size from Population Database


Step 2 - Approaches for Defining Global Market Size (Value, Volume* & Price*)

Note*: In applicable scenarios
Step 3 - Data Sources
Primary Research
- Web Analytics
- Survey Reports
- Research Institute
- Latest Research Reports
- Opinion Leaders
Secondary Research
- Annual Reports
- White Paper
- Latest Press Release
- Industry Association
- Paid Database
- Investor Presentations

Step 4 - Data Triangulation
Involves using different sources of information in order to increase the validity of a study
These sources are likely to be stakeholders in a program - participants, other researchers, program staff, other community members, and so on.
Then we put all data in single framework & apply various statistical tools to find out the dynamic on the market.
During the analysis stage, feedback from the stakeholder groups would be compared to determine areas of agreement as well as areas of divergence
