

Key Insights
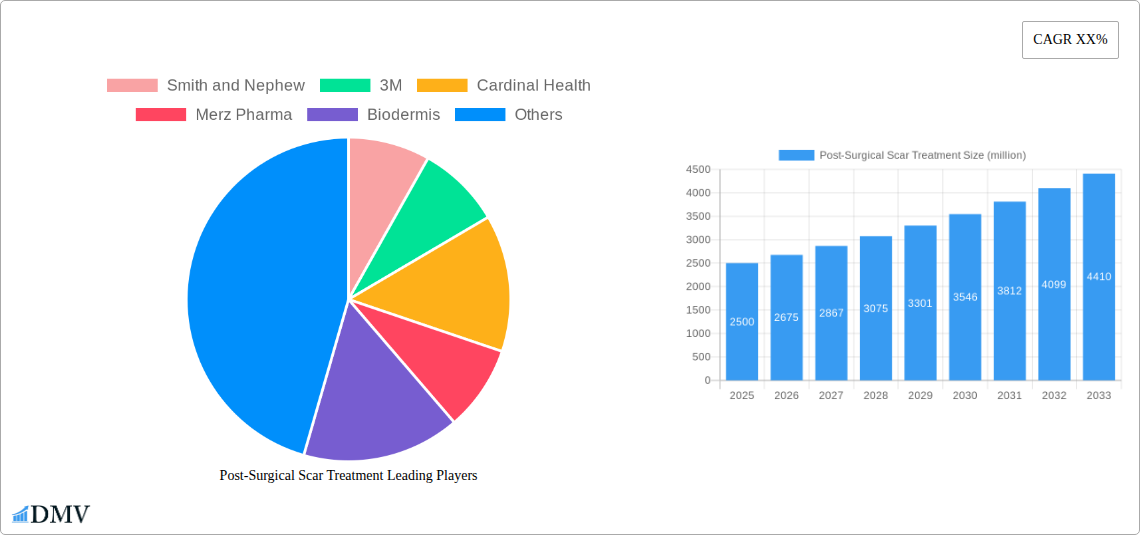
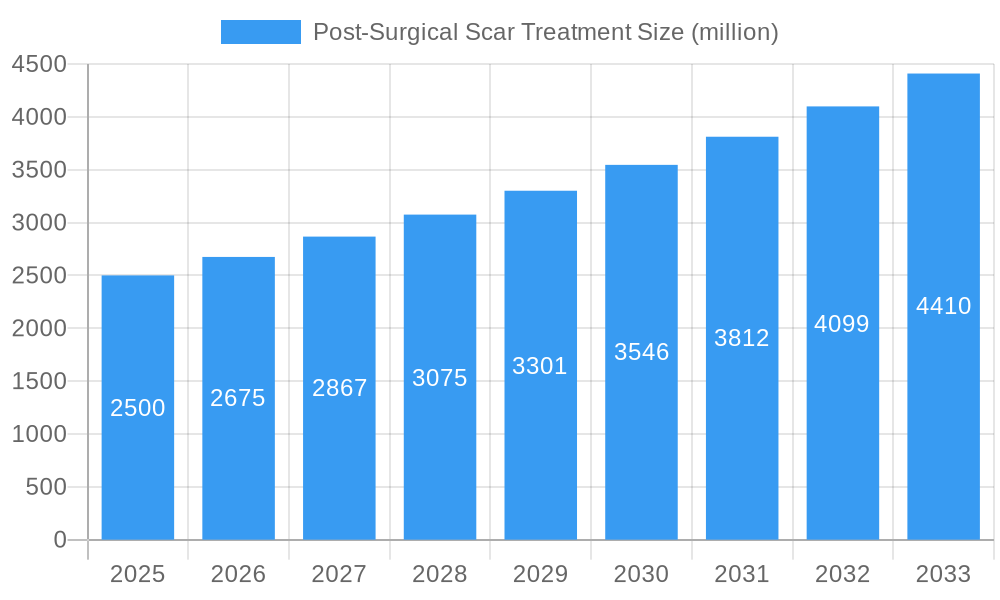
The post-surgical scar treatment market is experiencing robust growth, driven by increasing surgical procedures globally and a rising demand for aesthetically pleasing outcomes. The market, currently valued at approximately $2.5 billion in 2025, is projected to exhibit a compound annual growth rate (CAGR) of 7% from 2025 to 2033, reaching an estimated $4.2 billion by 2033. This expansion is fueled by several key factors. Advancements in scar treatment technologies, including silicone-based products, laser therapies, and innovative topical treatments, offer improved efficacy and patient satisfaction. Furthermore, the growing awareness among patients regarding scar management and the availability of minimally invasive procedures are contributing to market growth. However, factors like high treatment costs and the potential for adverse reactions to certain treatments could pose challenges to market expansion. The market is segmented by treatment type (silicone sheets, gels, pressure garments, laser therapy, injectables), application (burns, surgical wounds, acne scars), and end-user (hospitals, clinics, homecare). Key players such as Smith & Nephew, 3M, and Mölnlycke Health Care are driving innovation and market competition through product diversification and strategic partnerships.
Post-Surgical Scar Treatment Market Size (In Billion)
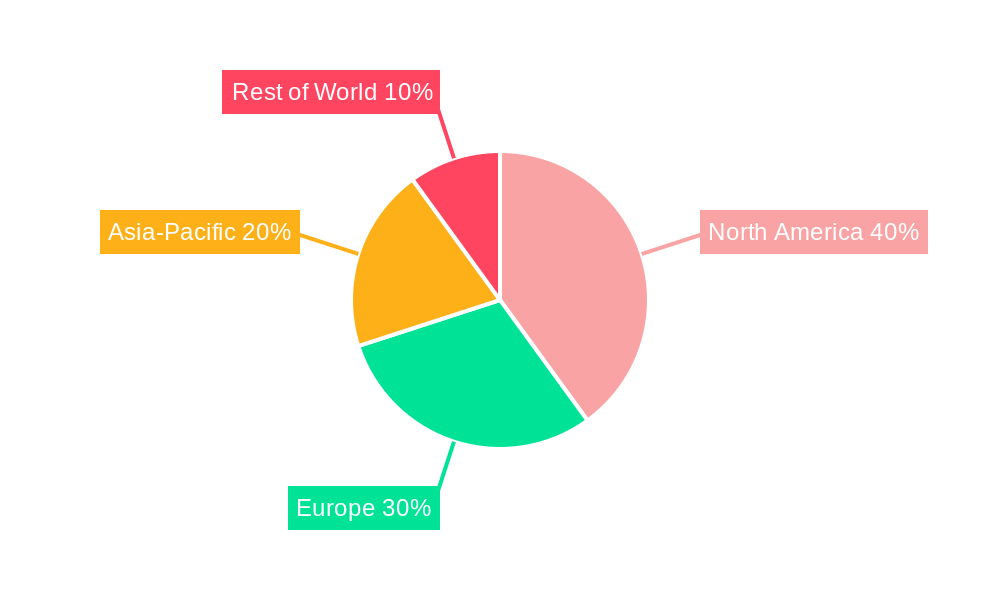
Regional variations exist, with North America and Europe currently holding the largest market shares due to established healthcare infrastructure and high disposable incomes. However, the Asia-Pacific region is anticipated to witness significant growth in the coming years owing to rising healthcare expenditure and increased surgical procedures in developing economies. The increasing prevalence of chronic diseases necessitating surgical intervention, coupled with a growing demand for improved cosmetic outcomes, further contributes to the market’s positive outlook. Competition within the market is intense, with companies focusing on research and development to create more effective and user-friendly products. A focus on personalized treatment approaches and integration of digital health technologies in scar management are expected to shape future market trends.
Post-Surgical Scar Treatment Company Market Share
Post-Surgical Scar Treatment Market Report: A Comprehensive Analysis (2019-2033)
This insightful report provides a detailed analysis of the global Post-Surgical Scar Treatment market, projecting a market valuation exceeding $XX million by 2033. The study covers the period 2019-2033, with a base year of 2025 and a forecast period of 2025-2033. Key market players, including Smith & Nephew, 3M, Cardinal Health, Merz Pharma, and others, are profiled, offering a complete picture of the competitive landscape. This report is crucial for stakeholders seeking to understand market dynamics, technological advancements, and future growth potential within this rapidly evolving sector.
Post-Surgical Scar Treatment Market Composition & Trends
This section analyzes the market's competitive landscape, regulatory environment, and key trends influencing its growth. The market exhibits moderate concentration, with the top five players holding an estimated XX% market share in 2025. Innovation in silicone-based gels, pressure garments, and laser therapies is driving market growth. Stringent regulatory approvals, particularly in developed markets, impact product launches and market entry. Substitute products, including home remedies and traditional treatments, present competitive challenges. The end-user profile encompasses hospitals, clinics, and dermatology practices. M&A activity has been moderate, with a total deal value exceeding $XX million in the historical period (2019-2024), primarily driven by strategic acquisitions of smaller, specialized companies by larger players.
- Market Share Distribution (2025): Smith & Nephew (XX%), 3M (XX%), Cardinal Health (XX%), Merz Pharma (XX%), Others (XX%)
- M&A Deal Value (2019-2024): $XX million
- Key Regulatory Bodies: [List relevant regulatory bodies and their impact]
- Substitute Products: [List and briefly describe substitute products and their market impact]
Post-Surgical Scar Treatment Industry Evolution
The post-surgical scar treatment market has witnessed significant evolution over the past five years. The market experienced a CAGR of XX% during the historical period (2019-2024), driven by rising surgical procedures, increasing awareness of scar management, and technological advancements. The adoption of minimally invasive surgical techniques has inadvertently fueled demand for effective scar treatment solutions. Technological advancements, such as laser therapies, micro-needling, and innovative topical treatments, are reshaping the market. Consumer demands are shifting towards more convenient, effective, and aesthetically pleasing scar treatment options, driving the development of advanced products. The forecast period (2025-2033) anticipates a CAGR of XX%, propelled by increasing disposable incomes and rising healthcare expenditure, particularly in developing economies.
Leading Regions, Countries, or Segments in Post-Surgical Scar Treatment
North America currently dominates the post-surgical scar treatment market, accounting for an estimated XX% of the global market share in 2025. This dominance is attributed to factors such as:
- High Healthcare Expenditure: Significant investment in healthcare infrastructure and advanced medical technologies.
- High Prevalence of Surgical Procedures: A high volume of elective and emergency surgeries contributes significantly to the market demand.
- Strong Regulatory Framework: Supports the adoption and commercialization of innovative scar treatment products.
- Increased Awareness and Consumer Demand: Consumers are increasingly aware of advanced scar treatment options and their aesthetic benefits.
Europe follows closely behind, with strong market growth projected in Asia-Pacific due to rising disposable incomes and expanding healthcare infrastructure. Specific countries like the United States, Germany, and Japan contribute significantly to regional market growth, while high-growth segments like laser therapies and injectable treatments contribute to the overall market expansion.
Post-Surgical Scar Treatment Product Innovations
Recent innovations have focused on improving efficacy, reducing treatment time, and enhancing patient experience. Silicone-based gel sheets are gaining popularity due to their ease of use and proven effectiveness. Laser therapies offer advanced scar revision options, minimizing scarring and improving cosmetic outcomes. New injectables containing growth factors or hyaluronic acid aim to improve skin texture and reduce scar visibility. These innovations reflect a shift towards minimally invasive, patient-friendly solutions delivering superior aesthetic and functional results, setting a new standard for post-surgical scar management.
Propelling Factors for Post-Surgical Scar Treatment Growth
Several key factors are driving the growth of the post-surgical scar treatment market. Technological advancements, like the introduction of laser therapies and advanced topical treatments, offer superior results compared to traditional methods, thereby stimulating market expansion. Increased healthcare expenditure globally, especially in emerging economies, allows for greater access to advanced scar treatment options. Favorable regulatory environments in many countries support the development and commercialization of new products, contributing further to market growth.
Obstacles in the Post-Surgical Scar Treatment Market
Despite the significant growth potential, several challenges hinder market expansion. Stringent regulatory approvals and lengthy clinical trials can delay product launches and increase development costs. Supply chain disruptions, particularly for specialized raw materials and components, affect manufacturing and product availability. Intense competition among established players and the entry of new companies intensify market pressures and restrict profitability. These factors create uncertainties and limitations in the market's overall development.
Future Opportunities in Post-Surgical Scar Treatment
The future of the post-surgical scar treatment market holds promising opportunities. The expansion into untapped markets in developing economies, coupled with the potential for personalized scar treatment approaches based on individual patient needs, create significant potential. Further technological advancements, including the development of bio-engineered materials and novel drug delivery systems, are expected to offer more effective and targeted scar treatments. Focus on minimally invasive, at-home treatment solutions caters to evolving patient preferences and promises market expansion.
Major Players in the Post-Surgical Scar Treatment Ecosystem
- Smith & Nephew
- 3M
- Cardinal Health
- Merz Pharma
- Biodermis
- AXA Health
- Mölnlycke Health Care
- Implantech
- Covalon Technologies
- Bio Med Sciences
- Polymer Science
- Neodyne Biosciences
Key Developments in Post-Surgical Scar Treatment Industry
- 2022-Q4: Smith & Nephew launches a new silicone gel sheet with enhanced efficacy.
- 2023-Q1: Merz Pharma receives FDA approval for a novel injectable scar treatment.
- 2023-Q3: A strategic partnership is formed between 3M and a biotech company for developing a bio-engineered scar treatment.
- [Add more key developments with dates]
Strategic Post-Surgical Scar Treatment Market Forecast
The post-surgical scar treatment market is poised for robust growth over the forecast period. Technological advancements, increasing surgical procedures, and rising healthcare expenditure will continue to drive market expansion. Focus on minimally invasive techniques and personalized treatment approaches will further stimulate demand. Emerging markets in developing countries and novel product innovations offer significant growth potential, solidifying the market's position as a key sector within the broader healthcare industry. The market is projected to exceed $XX million by 2033.
Post-Surgical Scar Treatment Segmentation
-
1. Application
- 1.1. Ambulatory Surgical Centers
- 1.2. Clinics
- 1.3. Home Care Settings
- 1.4. Hospitals
- 1.5. Others
-
2. Types
- 2.1. Silicone Sheets and Patches
- 2.2. Surgical tapes
- 2.3. Gels and Creams
- 2.4. Others
Post-Surgical Scar Treatment Segmentation By Geography
-
1. North America
- 1.1. United States
- 1.2. Canada
- 1.3. Mexico
-
2. South America
- 2.1. Brazil
- 2.2. Argentina
- 2.3. Rest of South America
-
3. Europe
- 3.1. United Kingdom
- 3.2. Germany
- 3.3. France
- 3.4. Italy
- 3.5. Spain
- 3.6. Russia
- 3.7. Benelux
- 3.8. Nordics
- 3.9. Rest of Europe
-
4. Middle East & Africa
- 4.1. Turkey
- 4.2. Israel
- 4.3. GCC
- 4.4. North Africa
- 4.5. South Africa
- 4.6. Rest of Middle East & Africa
-
5. Asia Pacific
- 5.1. China
- 5.2. India
- 5.3. Japan
- 5.4. South Korea
- 5.5. ASEAN
- 5.6. Oceania
- 5.7. Rest of Asia Pacific
Post-Surgical Scar Treatment Regional Market Share
Geographic Coverage of Post-Surgical Scar Treatment
Post-Surgical Scar Treatment REPORT HIGHLIGHTS
| Aspects | Details |
|---|---|
| Study Period | 2020-2034 |
| Base Year | 2025 |
| Estimated Year | 2026 |
| Forecast Period | 2026-2034 |
| Historical Period | 2020-2025 |
| Growth Rate | CAGR of 10% from 2020-2034 |
| Segmentation |
|
Table of Contents
- 1. Introduction
- 1.1. Research Scope
- 1.2. Market Segmentation
- 1.3. Research Objective
- 1.4. Definitions and Assumptions
- 2. Executive Summary
- 2.1. Market Snapshot
- 3. Market Dynamics
- 3.1. Market Drivers
- 3.2. Market Restrains
- 3.3. Market Trends
- 3.4. Market Opportunities
- 4. Market Factor Analysis
- 4.1. Porters Five Forces
- 4.1.1. Bargaining Power of Suppliers
- 4.1.2. Bargaining Power of Buyers
- 4.1.3. Threat of New Entrants
- 4.1.4. Threat of Substitutes
- 4.1.5. Competitive Rivalry
- 4.2. PESTEL analysis
- 4.3. BCG Analysis
- 4.3.1. Stars (High Growth, High Market Share)
- 4.3.2. Cash Cows (Low Growth, High Market Share)
- 4.3.3. Question Mark (High Growth, Low Market Share)
- 4.3.4. Dogs (Low Growth, Low Market Share)
- 4.4. Ansoff Matrix Analysis
- 4.5. Supply Chain Analysis
- 4.6. Regulatory Landscape
- 4.7. Current Market Potential and Opportunity Assessment (TAM–SAM–SOM Framework)
- 4.8. DMV Analyst Note
- 4.1. Porters Five Forces
- 5. Market Analysis, Insights and Forecast 2021-2033
- 5.1. Market Analysis, Insights and Forecast - by Application
- 5.1.1. Ambulatory Surgical Centers
- 5.1.2. Clinics
- 5.1.3. Home Care Settings
- 5.1.4. Hospitals
- 5.1.5. Others
- 5.2. Market Analysis, Insights and Forecast - by Types
- 5.2.1. Silicone Sheets and Patches
- 5.2.2. Surgical tapes
- 5.2.3. Gels and Creams
- 5.2.4. Others
- 5.3. Market Analysis, Insights and Forecast - by Region
- 5.3.1. North America
- 5.3.2. South America
- 5.3.3. Europe
- 5.3.4. Middle East & Africa
- 5.3.5. Asia Pacific
- 5.1. Market Analysis, Insights and Forecast - by Application
- 6. Global Post-Surgical Scar Treatment Analysis, Insights and Forecast, 2021-2033
- 6.1. Market Analysis, Insights and Forecast - by Application
- 6.1.1. Ambulatory Surgical Centers
- 6.1.2. Clinics
- 6.1.3. Home Care Settings
- 6.1.4. Hospitals
- 6.1.5. Others
- 6.2. Market Analysis, Insights and Forecast - by Types
- 6.2.1. Silicone Sheets and Patches
- 6.2.2. Surgical tapes
- 6.2.3. Gels and Creams
- 6.2.4. Others
- 6.1. Market Analysis, Insights and Forecast - by Application
- 7. North America Post-Surgical Scar Treatment Analysis, Insights and Forecast, 2020-2032
- 7.1. Market Analysis, Insights and Forecast - by Application
- 7.1.1. Ambulatory Surgical Centers
- 7.1.2. Clinics
- 7.1.3. Home Care Settings
- 7.1.4. Hospitals
- 7.1.5. Others
- 7.2. Market Analysis, Insights and Forecast - by Types
- 7.2.1. Silicone Sheets and Patches
- 7.2.2. Surgical tapes
- 7.2.3. Gels and Creams
- 7.2.4. Others
- 7.1. Market Analysis, Insights and Forecast - by Application
- 8. South America Post-Surgical Scar Treatment Analysis, Insights and Forecast, 2020-2032
- 8.1. Market Analysis, Insights and Forecast - by Application
- 8.1.1. Ambulatory Surgical Centers
- 8.1.2. Clinics
- 8.1.3. Home Care Settings
- 8.1.4. Hospitals
- 8.1.5. Others
- 8.2. Market Analysis, Insights and Forecast - by Types
- 8.2.1. Silicone Sheets and Patches
- 8.2.2. Surgical tapes
- 8.2.3. Gels and Creams
- 8.2.4. Others
- 8.1. Market Analysis, Insights and Forecast - by Application
- 9. Europe Post-Surgical Scar Treatment Analysis, Insights and Forecast, 2020-2032
- 9.1. Market Analysis, Insights and Forecast - by Application
- 9.1.1. Ambulatory Surgical Centers
- 9.1.2. Clinics
- 9.1.3. Home Care Settings
- 9.1.4. Hospitals
- 9.1.5. Others
- 9.2. Market Analysis, Insights and Forecast - by Types
- 9.2.1. Silicone Sheets and Patches
- 9.2.2. Surgical tapes
- 9.2.3. Gels and Creams
- 9.2.4. Others
- 9.1. Market Analysis, Insights and Forecast - by Application
- 10. Middle East & Africa Post-Surgical Scar Treatment Analysis, Insights and Forecast, 2020-2032
- 10.1. Market Analysis, Insights and Forecast - by Application
- 10.1.1. Ambulatory Surgical Centers
- 10.1.2. Clinics
- 10.1.3. Home Care Settings
- 10.1.4. Hospitals
- 10.1.5. Others
- 10.2. Market Analysis, Insights and Forecast - by Types
- 10.2.1. Silicone Sheets and Patches
- 10.2.2. Surgical tapes
- 10.2.3. Gels and Creams
- 10.2.4. Others
- 10.1. Market Analysis, Insights and Forecast - by Application
- 11. Asia Pacific Post-Surgical Scar Treatment Analysis, Insights and Forecast, 2020-2032
- 11.1. Market Analysis, Insights and Forecast - by Application
- 11.1.1. Ambulatory Surgical Centers
- 11.1.2. Clinics
- 11.1.3. Home Care Settings
- 11.1.4. Hospitals
- 11.1.5. Others
- 11.2. Market Analysis, Insights and Forecast - by Types
- 11.2.1. Silicone Sheets and Patches
- 11.2.2. Surgical tapes
- 11.2.3. Gels and Creams
- 11.2.4. Others
- 11.1. Market Analysis, Insights and Forecast - by Application
- 12. Competitive Analysis
- 12.1. Company Profiles
- 12.1.1 Smith and Nephew
- 12.1.1.1. Company Overview
- 12.1.1.2. Products
- 12.1.1.3. Company Financials
- 12.1.1.4. SWOT Analysis
- 12.1.2 3M
- 12.1.2.1. Company Overview
- 12.1.2.2. Products
- 12.1.2.3. Company Financials
- 12.1.2.4. SWOT Analysis
- 12.1.3 Cardinal Health
- 12.1.3.1. Company Overview
- 12.1.3.2. Products
- 12.1.3.3. Company Financials
- 12.1.3.4. SWOT Analysis
- 12.1.4 Merz Pharma
- 12.1.4.1. Company Overview
- 12.1.4.2. Products
- 12.1.4.3. Company Financials
- 12.1.4.4. SWOT Analysis
- 12.1.5 Biodermis
- 12.1.5.1. Company Overview
- 12.1.5.2. Products
- 12.1.5.3. Company Financials
- 12.1.5.4. SWOT Analysis
- 12.1.6 AXA Health
- 12.1.6.1. Company Overview
- 12.1.6.2. Products
- 12.1.6.3. Company Financials
- 12.1.6.4. SWOT Analysis
- 12.1.7 Mölnlycke Health Care
- 12.1.7.1. Company Overview
- 12.1.7.2. Products
- 12.1.7.3. Company Financials
- 12.1.7.4. SWOT Analysis
- 12.1.8 Implantech
- 12.1.8.1. Company Overview
- 12.1.8.2. Products
- 12.1.8.3. Company Financials
- 12.1.8.4. SWOT Analysis
- 12.1.9 Covalon Technologies
- 12.1.9.1. Company Overview
- 12.1.9.2. Products
- 12.1.9.3. Company Financials
- 12.1.9.4. SWOT Analysis
- 12.1.10 Bio Med Sciences
- 12.1.10.1. Company Overview
- 12.1.10.2. Products
- 12.1.10.3. Company Financials
- 12.1.10.4. SWOT Analysis
- 12.1.11 Polymer Science
- 12.1.11.1. Company Overview
- 12.1.11.2. Products
- 12.1.11.3. Company Financials
- 12.1.11.4. SWOT Analysis
- 12.1.12 Neodyne Biosciences
- 12.1.12.1. Company Overview
- 12.1.12.2. Products
- 12.1.12.3. Company Financials
- 12.1.12.4. SWOT Analysis
- 12.1.1 Smith and Nephew
- 12.2. Market Entropy
- 12.2.1 Company's Key Areas Served
- 12.2.2 Recent Developments
- 12.3. Company Market Share Analysis 2025
- 12.3.1 Top 5 Companies Market Share Analysis
- 12.3.2 Top 3 Companies Market Share Analysis
- 12.4. List of Potential Customers
- 13. Research Methodology
List of Figures
- Figure 1: Global Post-Surgical Scar Treatment Revenue Breakdown (billion, %) by Region 2025 & 2033
- Figure 2: North America Post-Surgical Scar Treatment Revenue (billion), by Application 2025 & 2033
- Figure 3: North America Post-Surgical Scar Treatment Revenue Share (%), by Application 2025 & 2033
- Figure 4: North America Post-Surgical Scar Treatment Revenue (billion), by Types 2025 & 2033
- Figure 5: North America Post-Surgical Scar Treatment Revenue Share (%), by Types 2025 & 2033
- Figure 6: North America Post-Surgical Scar Treatment Revenue (billion), by Country 2025 & 2033
- Figure 7: North America Post-Surgical Scar Treatment Revenue Share (%), by Country 2025 & 2033
- Figure 8: South America Post-Surgical Scar Treatment Revenue (billion), by Application 2025 & 2033
- Figure 9: South America Post-Surgical Scar Treatment Revenue Share (%), by Application 2025 & 2033
- Figure 10: South America Post-Surgical Scar Treatment Revenue (billion), by Types 2025 & 2033
- Figure 11: South America Post-Surgical Scar Treatment Revenue Share (%), by Types 2025 & 2033
- Figure 12: South America Post-Surgical Scar Treatment Revenue (billion), by Country 2025 & 2033
- Figure 13: South America Post-Surgical Scar Treatment Revenue Share (%), by Country 2025 & 2033
- Figure 14: Europe Post-Surgical Scar Treatment Revenue (billion), by Application 2025 & 2033
- Figure 15: Europe Post-Surgical Scar Treatment Revenue Share (%), by Application 2025 & 2033
- Figure 16: Europe Post-Surgical Scar Treatment Revenue (billion), by Types 2025 & 2033
- Figure 17: Europe Post-Surgical Scar Treatment Revenue Share (%), by Types 2025 & 2033
- Figure 18: Europe Post-Surgical Scar Treatment Revenue (billion), by Country 2025 & 2033
- Figure 19: Europe Post-Surgical Scar Treatment Revenue Share (%), by Country 2025 & 2033
- Figure 20: Middle East & Africa Post-Surgical Scar Treatment Revenue (billion), by Application 2025 & 2033
- Figure 21: Middle East & Africa Post-Surgical Scar Treatment Revenue Share (%), by Application 2025 & 2033
- Figure 22: Middle East & Africa Post-Surgical Scar Treatment Revenue (billion), by Types 2025 & 2033
- Figure 23: Middle East & Africa Post-Surgical Scar Treatment Revenue Share (%), by Types 2025 & 2033
- Figure 24: Middle East & Africa Post-Surgical Scar Treatment Revenue (billion), by Country 2025 & 2033
- Figure 25: Middle East & Africa Post-Surgical Scar Treatment Revenue Share (%), by Country 2025 & 2033
- Figure 26: Asia Pacific Post-Surgical Scar Treatment Revenue (billion), by Application 2025 & 2033
- Figure 27: Asia Pacific Post-Surgical Scar Treatment Revenue Share (%), by Application 2025 & 2033
- Figure 28: Asia Pacific Post-Surgical Scar Treatment Revenue (billion), by Types 2025 & 2033
- Figure 29: Asia Pacific Post-Surgical Scar Treatment Revenue Share (%), by Types 2025 & 2033
- Figure 30: Asia Pacific Post-Surgical Scar Treatment Revenue (billion), by Country 2025 & 2033
- Figure 31: Asia Pacific Post-Surgical Scar Treatment Revenue Share (%), by Country 2025 & 2033
List of Tables
- Table 1: Global Post-Surgical Scar Treatment Revenue billion Forecast, by Application 2020 & 2033
- Table 2: Global Post-Surgical Scar Treatment Revenue billion Forecast, by Types 2020 & 2033
- Table 3: Global Post-Surgical Scar Treatment Revenue billion Forecast, by Region 2020 & 2033
- Table 4: Global Post-Surgical Scar Treatment Revenue billion Forecast, by Application 2020 & 2033
- Table 5: Global Post-Surgical Scar Treatment Revenue billion Forecast, by Types 2020 & 2033
- Table 6: Global Post-Surgical Scar Treatment Revenue billion Forecast, by Country 2020 & 2033
- Table 7: United States Post-Surgical Scar Treatment Revenue (billion) Forecast, by Application 2020 & 2033
- Table 8: Canada Post-Surgical Scar Treatment Revenue (billion) Forecast, by Application 2020 & 2033
- Table 9: Mexico Post-Surgical Scar Treatment Revenue (billion) Forecast, by Application 2020 & 2033
- Table 10: Global Post-Surgical Scar Treatment Revenue billion Forecast, by Application 2020 & 2033
- Table 11: Global Post-Surgical Scar Treatment Revenue billion Forecast, by Types 2020 & 2033
- Table 12: Global Post-Surgical Scar Treatment Revenue billion Forecast, by Country 2020 & 2033
- Table 13: Brazil Post-Surgical Scar Treatment Revenue (billion) Forecast, by Application 2020 & 2033
- Table 14: Argentina Post-Surgical Scar Treatment Revenue (billion) Forecast, by Application 2020 & 2033
- Table 15: Rest of South America Post-Surgical Scar Treatment Revenue (billion) Forecast, by Application 2020 & 2033
- Table 16: Global Post-Surgical Scar Treatment Revenue billion Forecast, by Application 2020 & 2033
- Table 17: Global Post-Surgical Scar Treatment Revenue billion Forecast, by Types 2020 & 2033
- Table 18: Global Post-Surgical Scar Treatment Revenue billion Forecast, by Country 2020 & 2033
- Table 19: United Kingdom Post-Surgical Scar Treatment Revenue (billion) Forecast, by Application 2020 & 2033
- Table 20: Germany Post-Surgical Scar Treatment Revenue (billion) Forecast, by Application 2020 & 2033
- Table 21: France Post-Surgical Scar Treatment Revenue (billion) Forecast, by Application 2020 & 2033
- Table 22: Italy Post-Surgical Scar Treatment Revenue (billion) Forecast, by Application 2020 & 2033
- Table 23: Spain Post-Surgical Scar Treatment Revenue (billion) Forecast, by Application 2020 & 2033
- Table 24: Russia Post-Surgical Scar Treatment Revenue (billion) Forecast, by Application 2020 & 2033
- Table 25: Benelux Post-Surgical Scar Treatment Revenue (billion) Forecast, by Application 2020 & 2033
- Table 26: Nordics Post-Surgical Scar Treatment Revenue (billion) Forecast, by Application 2020 & 2033
- Table 27: Rest of Europe Post-Surgical Scar Treatment Revenue (billion) Forecast, by Application 2020 & 2033
- Table 28: Global Post-Surgical Scar Treatment Revenue billion Forecast, by Application 2020 & 2033
- Table 29: Global Post-Surgical Scar Treatment Revenue billion Forecast, by Types 2020 & 2033
- Table 30: Global Post-Surgical Scar Treatment Revenue billion Forecast, by Country 2020 & 2033
- Table 31: Turkey Post-Surgical Scar Treatment Revenue (billion) Forecast, by Application 2020 & 2033
- Table 32: Israel Post-Surgical Scar Treatment Revenue (billion) Forecast, by Application 2020 & 2033
- Table 33: GCC Post-Surgical Scar Treatment Revenue (billion) Forecast, by Application 2020 & 2033
- Table 34: North Africa Post-Surgical Scar Treatment Revenue (billion) Forecast, by Application 2020 & 2033
- Table 35: South Africa Post-Surgical Scar Treatment Revenue (billion) Forecast, by Application 2020 & 2033
- Table 36: Rest of Middle East & Africa Post-Surgical Scar Treatment Revenue (billion) Forecast, by Application 2020 & 2033
- Table 37: Global Post-Surgical Scar Treatment Revenue billion Forecast, by Application 2020 & 2033
- Table 38: Global Post-Surgical Scar Treatment Revenue billion Forecast, by Types 2020 & 2033
- Table 39: Global Post-Surgical Scar Treatment Revenue billion Forecast, by Country 2020 & 2033
- Table 40: China Post-Surgical Scar Treatment Revenue (billion) Forecast, by Application 2020 & 2033
- Table 41: India Post-Surgical Scar Treatment Revenue (billion) Forecast, by Application 2020 & 2033
- Table 42: Japan Post-Surgical Scar Treatment Revenue (billion) Forecast, by Application 2020 & 2033
- Table 43: South Korea Post-Surgical Scar Treatment Revenue (billion) Forecast, by Application 2020 & 2033
- Table 44: ASEAN Post-Surgical Scar Treatment Revenue (billion) Forecast, by Application 2020 & 2033
- Table 45: Oceania Post-Surgical Scar Treatment Revenue (billion) Forecast, by Application 2020 & 2033
- Table 46: Rest of Asia Pacific Post-Surgical Scar Treatment Revenue (billion) Forecast, by Application 2020 & 2033
Frequently Asked Questions
1. What is the projected Compound Annual Growth Rate (CAGR) of the Post-Surgical Scar Treatment?
The projected CAGR is approximately 10%.
2. Which companies are prominent players in the Post-Surgical Scar Treatment?
Key companies in the market include Smith and Nephew, 3M, Cardinal Health, Merz Pharma, Biodermis, AXA Health, Mölnlycke Health Care, Implantech, Covalon Technologies, Bio Med Sciences, Polymer Science, Neodyne Biosciences.
3. What are the main segments of the Post-Surgical Scar Treatment?
The market segments include Application, Types.
4. Can you provide details about the market size?
The market size is estimated to be USD 34.7 billion as of 2022.
5. What are some drivers contributing to market growth?
N/A
6. What are the notable trends driving market growth?
N/A
7. Are there any restraints impacting market growth?
N/A
8. Can you provide examples of recent developments in the market?
N/A
9. What pricing options are available for accessing the report?
Pricing options include single-user, multi-user, and enterprise licenses priced at USD 4900.00, USD 7350.00, and USD 9800.00 respectively.
10. Is the market size provided in terms of value or volume?
The market size is provided in terms of value, measured in billion.
11. Are there any specific market keywords associated with the report?
Yes, the market keyword associated with the report is "Post-Surgical Scar Treatment," which aids in identifying and referencing the specific market segment covered.
12. How do I determine which pricing option suits my needs best?
The pricing options vary based on user requirements and access needs. Individual users may opt for single-user licenses, while businesses requiring broader access may choose multi-user or enterprise licenses for cost-effective access to the report.
13. Are there any additional resources or data provided in the Post-Surgical Scar Treatment report?
While the report offers comprehensive insights, it's advisable to review the specific contents or supplementary materials provided to ascertain if additional resources or data are available.
14. How can I stay updated on further developments or reports in the Post-Surgical Scar Treatment?
To stay informed about further developments, trends, and reports in the Post-Surgical Scar Treatment, consider subscribing to industry newsletters, following relevant companies and organizations, or regularly checking reputable industry news sources and publications.
Methodology
Step 1 - Identification of Relevant Samples Size from Population Database


Step 2 - Approaches for Defining Global Market Size (Value, Volume* & Price*)

Note*: In applicable scenarios
Step 3 - Data Sources
Primary Research
- Web Analytics
- Survey Reports
- Research Institute
- Latest Research Reports
- Opinion Leaders
Secondary Research
- Annual Reports
- White Paper
- Latest Press Release
- Industry Association
- Paid Database
- Investor Presentations

Step 4 - Data Triangulation
Involves using different sources of information in order to increase the validity of a study
These sources are likely to be stakeholders in a program - participants, other researchers, program staff, other community members, and so on.
Then we put all data in single framework & apply various statistical tools to find out the dynamic on the market.
During the analysis stage, feedback from the stakeholder groups would be compared to determine areas of agreement as well as areas of divergence