


Key Insights
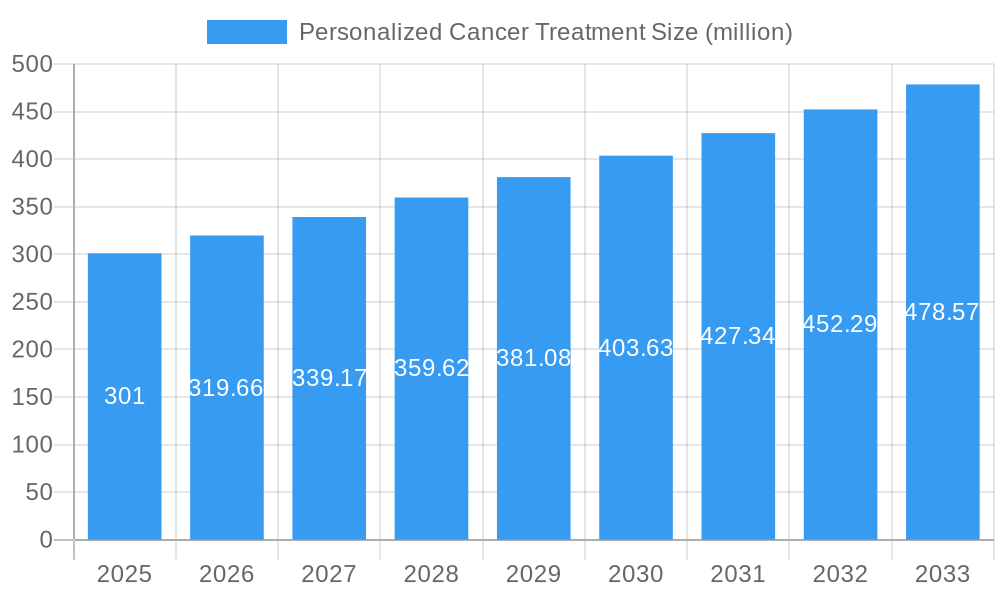
The global Personalized Cancer Treatment market is poised for substantial growth, projected to reach a market size of $301 million with a robust Compound Annual Growth Rate (CAGR) of 6.2%. This expansion is fueled by a confluence of factors, including the increasing demand for tailored therapeutic approaches that minimize side effects and maximize efficacy. The burgeoning understanding of cancer's genetic and molecular underpinnings is a primary driver, enabling the development of highly specific treatments. Furthermore, advancements in diagnostic technologies, such as next-generation sequencing and liquid biopsies, are making it more feasible to identify individual patient profiles and select the most effective therapies. The market's segmentation into Personalized Medical Diagnosis and Personalized Medical Treatment underscores the comprehensive nature of this evolution, with both areas witnessing significant investment and innovation. Leading companies like Cellworks, Novartis, and Personalis are at the forefront, spearheading research and development in this dynamic field.
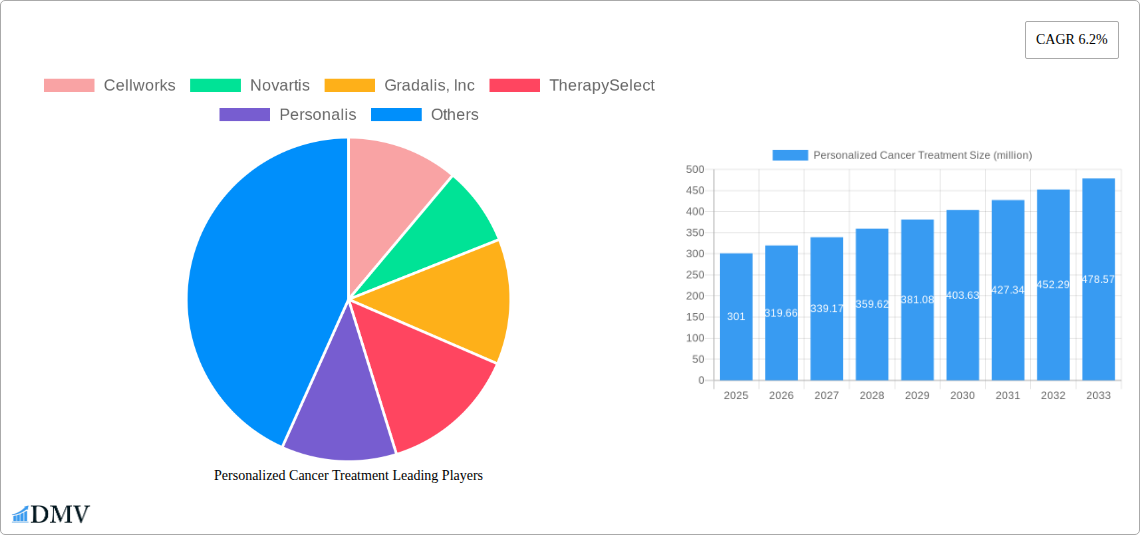
Personalized Cancer Treatment Market Size (In Million)

The forecast period from 2025 to 2033 indicates a sustained upward trajectory for personalized cancer therapies. While the market benefits from strong drivers, it also faces certain restraints. The high cost of personalized treatments and diagnostics, coupled with reimbursement challenges in some regions, can impede wider adoption. Additionally, the complexity of genetic profiling and the need for specialized infrastructure and trained personnel present hurdles. However, the clear trend towards precision medicine and the growing body of evidence demonstrating superior outcomes for patients receiving personalized care are expected to overcome these limitations. The market's reach extends across key regions, with North America and Europe currently leading in adoption, while Asia Pacific is emerging as a significant growth area due to increasing healthcare investments and a growing patient population. Innovations in treatment modalities, including targeted therapies and immunotherapies tailored to individual tumor profiles, are expected to further propel market expansion and redefine cancer care.
Personalized Cancer Treatment Company Market Share
Personalized Cancer Treatment Market Composition & Trends
This comprehensive report delves into the intricate market composition and evolving trends within the Personalized Cancer Treatment landscape. We analyze the dynamic interplay of market concentration, identifying key players such as Cellworks, Novartis, Gradalis, Inc, TherapySelect, Personalis, RGCC International, Genentech, BMS, OHC - Oncology Hematology Care, CTOAM, Aadi Bioscience, and Novartis. The study meticulously evaluates innovation catalysts, highlighting breakthroughs in Personalized Medical Diagnosis and Personalized Medical Treatment. We scrutinize the regulatory landscapes, understanding their impact on market entry and product development, and assess the threat of substitute products, ensuring a holistic market view. End-user profiles are meticulously detailed, focusing on preferences and adoption rates within Hospital and Clinic settings. M&A activities are a crucial focus, with an estimated XXX million in deal values shaping market consolidation. The report provides a detailed market share distribution analysis, revealing the competitive stronghold of leading entities. Our analysis spans the Study Period: 2019–2033, with a deep dive into the Base Year: 2025 and a robust Forecast Period: 2025–2033, building upon Historical Period: 2019–2024 data.
- Market Share Distribution: Detailed breakdown of leading company market shares.
- M&A Deal Values: Estimated XXX million in M&A transactions driving industry consolidation.
- Innovation Catalysts: Identification of key research and development drivers.
- Regulatory Landscapes: Impact of global healthcare regulations on market access.
- End-User Segments: Detailed profiles of Hospital and Clinic adoption patterns.
Personalized Cancer Treatment Industry Evolution
The Personalized Cancer Treatment industry is undergoing a significant evolutionary phase, characterized by rapid market growth trajectories and profound technological advancements. Our in-depth analysis, spanning 2019–2033, reveals a consistent upward trend in market expansion, driven by an increasing understanding of cancer's molecular heterogeneity. Personalized Medical Diagnosis is at the forefront, enabling more accurate and targeted treatment strategies. The adoption of Personalized Medical Treatment modalities, including targeted therapies and immunotherapies, has surged, particularly within Hospital and Clinic settings. Shifting consumer demands, fueled by greater awareness and a desire for improved patient outcomes, are further propelling this evolution. We project a compound annual growth rate (CAGR) of XX% for the Forecast Period: 2025–2033. Key metrics indicate a XX% increase in genomic sequencing for diagnostic purposes and a XX% rise in the prescription of targeted therapies over the Historical Period: 2019–2024. The Base Year: 2025 serves as a critical benchmark for understanding the current market momentum. The integration of artificial intelligence (AI) and machine learning (ML) in analyzing vast genomic datasets is a transformative technological advancement, paving the way for even more precise and effective Personalized Cancer Treatment plans. Companies like Cellworks and Personalis are at the vanguard of these AI-driven insights. Furthermore, the growing emphasis on predictive diagnostics and early detection through advanced molecular profiling is reshaping the preventative healthcare landscape, contributing to the overall growth and sophistication of the Personalized Cancer Treatment sector. The increased collaboration between research institutions, pharmaceutical giants like Novartis and Genentech, and specialized diagnostic companies is fostering a synergistic environment for innovation and faster translation of research into clinical practice.
Leading Regions, Countries, or Segments in Personalized Cancer Treatment
The Personalized Cancer Treatment market exhibits distinct regional dominance, with North America currently leading due to robust investment in Personalized Medical Diagnosis and Personalized Medical Treatment. This leadership is underpinned by a highly developed healthcare infrastructure, significant government funding for cancer research, and a proactive regulatory environment that encourages innovation. The United States, in particular, stands out as a primary market.
- Application: Hospital: Hospitals are the dominant application segment due to their comprehensive infrastructure for advanced diagnostics, complex treatment delivery, and specialized care teams required for personalized cancer therapies. The presence of cutting-edge technology and the concentration of oncologists and geneticists in hospital settings further solidify this dominance.
- Type: Personalized Medical Treatment: This segment is experiencing the most significant growth as breakthroughs in targeted therapies and immunotherapies translate into clinical practice. The ability to tailor treatments based on individual tumor genetics and biomarkers is transforming patient care, leading to improved efficacy and reduced side effects.
- Key Drivers in North America:
- Investment Trends: Substantial venture capital and government funding for precision medicine research.
- Regulatory Support: Favorable regulatory pathways for novel diagnostics and therapeutics from bodies like the FDA.
- Technological Adoption: High adoption rates of genomic sequencing, liquid biopsies, and AI-driven diagnostic platforms.
- Prevalence of Cancer: High incidence rates of various cancers necessitate advanced treatment options.
Europe follows closely, driven by increasing healthcare expenditure, government initiatives promoting precision medicine, and a growing network of specialized cancer centers. Asia-Pacific is emerging as a high-growth region, fueled by rising healthcare awareness, expanding middle-class incomes, and government investments in healthcare infrastructure. Countries like China and India are witnessing rapid advancements in Personalized Medical Diagnosis capabilities and an increasing demand for advanced Personalized Medical Treatment. The increasing number of clinical trials and collaborations within these regions further underscores their growing importance. The seamless integration of diagnostic testing with treatment protocols, facilitated by companies like TherapySelect and RGCC International, is a common thread across leading regions.
Personalized Cancer Treatment Product Innovations
The Personalized Cancer Treatment market is continuously enriched by groundbreaking product innovations. These advancements are primarily focused on enhancing diagnostic accuracy and treatment efficacy. Innovations include novel liquid biopsy technologies capable of detecting cancer biomarkers at earlier stages, sophisticated genomic sequencing platforms that provide comprehensive tumor profiling, and AI-driven algorithms for predicting treatment response. For instance, Aadi Bioscience is developing novel therapeutic approaches targeting specific genetic mutations. These products offer unique selling propositions such as non-invasiveness, speed, and unparalleled precision, leading to improved patient outcomes and a more refined approach to managing cancer.
Propelling Factors for Personalized Cancer Treatment Growth
Several interconnected factors are propelling the growth of the Personalized Cancer Treatment market. Technologically, advancements in genomic sequencing, bioinformatics, and AI are enabling more accurate diagnosis and targeted therapy selection. Economically, increasing healthcare expenditure, coupled with growing patient and physician awareness of the benefits of personalized medicine, fuels demand. Regulatory bodies worldwide are also increasingly streamlining approval pathways for precision oncology drugs and diagnostics. The growing prevalence of chronic diseases, including cancer, further amplifies the need for effective and individualized treatment strategies.
Obstacles in the Personalized Cancer Treatment Market
Despite robust growth, the Personalized Cancer Treatment market faces significant obstacles. Regulatory challenges, particularly in the initial stages of novel diagnostic and therapeutic development, can lead to prolonged approval times and increased costs. Supply chain disruptions, exacerbated by global events, can impact the availability of specialized reagents and equipment necessary for personalized diagnostics. Competitive pressures from established pharmaceutical companies and emerging biotechs also necessitate continuous innovation and market differentiation. Furthermore, the high cost associated with some personalized treatments can be a barrier to widespread adoption, particularly in resource-limited settings.
Future Opportunities in Personalized Cancer Treatment
The future of Personalized Cancer Treatment is replete with promising opportunities. Emerging markets in developing countries present significant untapped potential as healthcare infrastructure and awareness grow. Advances in areas like cell and gene therapy, mRNA-based vaccines, and advanced immunotherapy combinations are poised to revolutionize treatment paradigms. The increasing integration of real-world evidence and digital health solutions will further refine treatment strategies and improve patient monitoring. Early detection and preventative personalized medicine strategies also represent a burgeoning area of opportunity.
Major Players in the Personalized Cancer Treatment Ecosystem
- Cellworks
- Novartis
- Gradalis, Inc
- TherapySelect
- Personalis
- RGCC International
- Genentech
- BMS
- OHC - Oncology Hematology Care
- CTOAM
- Aadi Bioscience
Key Developments in Personalized Cancer Treatment Industry
- 2023/08: Genentech announces promising trial results for a new targeted therapy in lung cancer.
- 2023/07: Cellworks launches an AI-powered platform for predicting immunotherapy response.
- 2023/06: Novartis receives FDA approval for a novel CAR T-cell therapy for a specific hematological malignancy.
- 2022/12: Personalis expands its genomic profiling services to include novel biomarker discovery.
- 2022/10: BMS announces a strategic partnership with a biotech firm to develop next-generation immuno-oncology treatments.
Strategic Personalized Cancer Treatment Market Forecast
The strategic forecast for the Personalized Cancer Treatment market indicates continued robust growth, driven by relentless innovation in Personalized Medical Diagnosis and Personalized Medical Treatment. Key growth catalysts include the expansion of liquid biopsy technologies, the increasing application of AI in oncology, and the development of novel combination therapies. The growing demand for precision medicine solutions in both Hospital and Clinic settings, coupled with supportive regulatory environments and increasing healthcare investments, will further solidify the market's upward trajectory. The market is projected to reach an estimated value of XXX billion by 2033.
Personalized Cancer Treatment Segmentation
-
1. Application
- 1.1. Hospital
- 1.2. Clinic
-
2. Type
- 2.1. Personalized Medical Diagnosis
- 2.2. Personalized Medical Treatment
Personalized Cancer Treatment Segmentation By Geography
-
1. North America
- 1.1. United States
- 1.2. Canada
- 1.3. Mexico
-
2. South America
- 2.1. Brazil
- 2.2. Argentina
- 2.3. Rest of South America
-
3. Europe
- 3.1. United Kingdom
- 3.2. Germany
- 3.3. France
- 3.4. Italy
- 3.5. Spain
- 3.6. Russia
- 3.7. Benelux
- 3.8. Nordics
- 3.9. Rest of Europe
-
4. Middle East & Africa
- 4.1. Turkey
- 4.2. Israel
- 4.3. GCC
- 4.4. North Africa
- 4.5. South Africa
- 4.6. Rest of Middle East & Africa
-
5. Asia Pacific
- 5.1. China
- 5.2. India
- 5.3. Japan
- 5.4. South Korea
- 5.5. ASEAN
- 5.6. Oceania
- 5.7. Rest of Asia Pacific
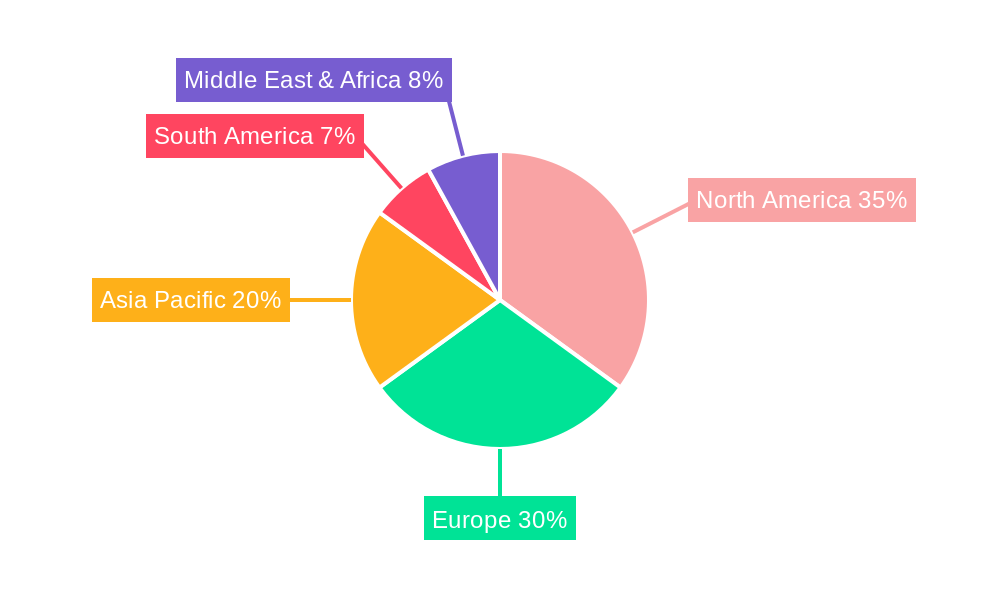
Personalized Cancer Treatment Regional Market Share
Geographic Coverage of Personalized Cancer Treatment
Personalized Cancer Treatment REPORT HIGHLIGHTS
| Aspects | Details |
|---|---|
| Study Period | 2020-2034 |
| Base Year | 2025 |
| Estimated Year | 2026 |
| Forecast Period | 2026-2034 |
| Historical Period | 2020-2025 |
| Growth Rate | CAGR of 6.2% from 2020-2034 |
| Segmentation |
|
Table of Contents
- 1. Introduction
- 1.1. Research Scope
- 1.2. Market Segmentation
- 1.3. Research Objective
- 1.4. Definitions and Assumptions
- 2. Executive Summary
- 2.1. Market Snapshot
- 3. Market Dynamics
- 3.1. Market Drivers
- 3.2. Market Restrains
- 3.3. Market Trends
- 3.4. Market Opportunities
- 4. Market Factor Analysis
- 4.1. Porters Five Forces
- 4.1.1. Bargaining Power of Suppliers
- 4.1.2. Bargaining Power of Buyers
- 4.1.3. Threat of New Entrants
- 4.1.4. Threat of Substitutes
- 4.1.5. Competitive Rivalry
- 4.2. PESTEL analysis
- 4.3. BCG Analysis
- 4.3.1. Stars (High Growth, High Market Share)
- 4.3.2. Cash Cows (Low Growth, High Market Share)
- 4.3.3. Question Mark (High Growth, Low Market Share)
- 4.3.4. Dogs (Low Growth, Low Market Share)
- 4.4. Ansoff Matrix Analysis
- 4.5. Supply Chain Analysis
- 4.6. Regulatory Landscape
- 4.7. Current Market Potential and Opportunity Assessment (TAM–SAM–SOM Framework)
- 4.8. DMV Analyst Note
- 4.1. Porters Five Forces
- 5. Market Analysis, Insights and Forecast 2021-2033
- 5.1. Market Analysis, Insights and Forecast - by Application
- 5.1.1. Hospital
- 5.1.2. Clinic
- 5.2. Market Analysis, Insights and Forecast - by Type
- 5.2.1. Personalized Medical Diagnosis
- 5.2.2. Personalized Medical Treatment
- 5.3. Market Analysis, Insights and Forecast - by Region
- 5.3.1. North America
- 5.3.2. South America
- 5.3.3. Europe
- 5.3.4. Middle East & Africa
- 5.3.5. Asia Pacific
- 5.1. Market Analysis, Insights and Forecast - by Application
- 6. Global Personalized Cancer Treatment Analysis, Insights and Forecast, 2021-2033
- 6.1. Market Analysis, Insights and Forecast - by Application
- 6.1.1. Hospital
- 6.1.2. Clinic
- 6.2. Market Analysis, Insights and Forecast - by Type
- 6.2.1. Personalized Medical Diagnosis
- 6.2.2. Personalized Medical Treatment
- 6.1. Market Analysis, Insights and Forecast - by Application
- 7. North America Personalized Cancer Treatment Analysis, Insights and Forecast, 2020-2032
- 7.1. Market Analysis, Insights and Forecast - by Application
- 7.1.1. Hospital
- 7.1.2. Clinic
- 7.2. Market Analysis, Insights and Forecast - by Type
- 7.2.1. Personalized Medical Diagnosis
- 7.2.2. Personalized Medical Treatment
- 7.1. Market Analysis, Insights and Forecast - by Application
- 8. South America Personalized Cancer Treatment Analysis, Insights and Forecast, 2020-2032
- 8.1. Market Analysis, Insights and Forecast - by Application
- 8.1.1. Hospital
- 8.1.2. Clinic
- 8.2. Market Analysis, Insights and Forecast - by Type
- 8.2.1. Personalized Medical Diagnosis
- 8.2.2. Personalized Medical Treatment
- 8.1. Market Analysis, Insights and Forecast - by Application
- 9. Europe Personalized Cancer Treatment Analysis, Insights and Forecast, 2020-2032
- 9.1. Market Analysis, Insights and Forecast - by Application
- 9.1.1. Hospital
- 9.1.2. Clinic
- 9.2. Market Analysis, Insights and Forecast - by Type
- 9.2.1. Personalized Medical Diagnosis
- 9.2.2. Personalized Medical Treatment
- 9.1. Market Analysis, Insights and Forecast - by Application
- 10. Middle East & Africa Personalized Cancer Treatment Analysis, Insights and Forecast, 2020-2032
- 10.1. Market Analysis, Insights and Forecast - by Application
- 10.1.1. Hospital
- 10.1.2. Clinic
- 10.2. Market Analysis, Insights and Forecast - by Type
- 10.2.1. Personalized Medical Diagnosis
- 10.2.2. Personalized Medical Treatment
- 10.1. Market Analysis, Insights and Forecast - by Application
- 11. Asia Pacific Personalized Cancer Treatment Analysis, Insights and Forecast, 2020-2032
- 11.1. Market Analysis, Insights and Forecast - by Application
- 11.1.1. Hospital
- 11.1.2. Clinic
- 11.2. Market Analysis, Insights and Forecast - by Type
- 11.2.1. Personalized Medical Diagnosis
- 11.2.2. Personalized Medical Treatment
- 11.1. Market Analysis, Insights and Forecast - by Application
- 12. Competitive Analysis
- 12.1. Company Profiles
- 12.1.1 Cellworks
- 12.1.1.1. Company Overview
- 12.1.1.2. Products
- 12.1.1.3. Company Financials
- 12.1.1.4. SWOT Analysis
- 12.1.2 Novartis
- 12.1.2.1. Company Overview
- 12.1.2.2. Products
- 12.1.2.3. Company Financials
- 12.1.2.4. SWOT Analysis
- 12.1.3 Gradalis Inc
- 12.1.3.1. Company Overview
- 12.1.3.2. Products
- 12.1.3.3. Company Financials
- 12.1.3.4. SWOT Analysis
- 12.1.4 TherapySelect
- 12.1.4.1. Company Overview
- 12.1.4.2. Products
- 12.1.4.3. Company Financials
- 12.1.4.4. SWOT Analysis
- 12.1.5 Personalis
- 12.1.5.1. Company Overview
- 12.1.5.2. Products
- 12.1.5.3. Company Financials
- 12.1.5.4. SWOT Analysis
- 12.1.6 RGCC International
- 12.1.6.1. Company Overview
- 12.1.6.2. Products
- 12.1.6.3. Company Financials
- 12.1.6.4. SWOT Analysis
- 12.1.7 Genentech
- 12.1.7.1. Company Overview
- 12.1.7.2. Products
- 12.1.7.3. Company Financials
- 12.1.7.4. SWOT Analysis
- 12.1.8 BMS
- 12.1.8.1. Company Overview
- 12.1.8.2. Products
- 12.1.8.3. Company Financials
- 12.1.8.4. SWOT Analysis
- 12.1.9 OHC - Oncology Hematology Care
- 12.1.9.1. Company Overview
- 12.1.9.2. Products
- 12.1.9.3. Company Financials
- 12.1.9.4. SWOT Analysis
- 12.1.10 CTOAM
- 12.1.10.1. Company Overview
- 12.1.10.2. Products
- 12.1.10.3. Company Financials
- 12.1.10.4. SWOT Analysis
- 12.1.11 Aadi Bioscience
- 12.1.11.1. Company Overview
- 12.1.11.2. Products
- 12.1.11.3. Company Financials
- 12.1.11.4. SWOT Analysis
- 12.1.1 Cellworks
- 12.2. Market Entropy
- 12.2.1 Company's Key Areas Served
- 12.2.2 Recent Developments
- 12.3. Company Market Share Analysis 2025
- 12.3.1 Top 5 Companies Market Share Analysis
- 12.3.2 Top 3 Companies Market Share Analysis
- 12.4. List of Potential Customers
- 13. Research Methodology
List of Figures
- Figure 1: Global Personalized Cancer Treatment Revenue Breakdown (million, %) by Region 2025 & 2033
- Figure 2: North America Personalized Cancer Treatment Revenue (million), by Application 2025 & 2033
- Figure 3: North America Personalized Cancer Treatment Revenue Share (%), by Application 2025 & 2033
- Figure 4: North America Personalized Cancer Treatment Revenue (million), by Type 2025 & 2033
- Figure 5: North America Personalized Cancer Treatment Revenue Share (%), by Type 2025 & 2033
- Figure 6: North America Personalized Cancer Treatment Revenue (million), by Country 2025 & 2033
- Figure 7: North America Personalized Cancer Treatment Revenue Share (%), by Country 2025 & 2033
- Figure 8: South America Personalized Cancer Treatment Revenue (million), by Application 2025 & 2033
- Figure 9: South America Personalized Cancer Treatment Revenue Share (%), by Application 2025 & 2033
- Figure 10: South America Personalized Cancer Treatment Revenue (million), by Type 2025 & 2033
- Figure 11: South America Personalized Cancer Treatment Revenue Share (%), by Type 2025 & 2033
- Figure 12: South America Personalized Cancer Treatment Revenue (million), by Country 2025 & 2033
- Figure 13: South America Personalized Cancer Treatment Revenue Share (%), by Country 2025 & 2033
- Figure 14: Europe Personalized Cancer Treatment Revenue (million), by Application 2025 & 2033
- Figure 15: Europe Personalized Cancer Treatment Revenue Share (%), by Application 2025 & 2033
- Figure 16: Europe Personalized Cancer Treatment Revenue (million), by Type 2025 & 2033
- Figure 17: Europe Personalized Cancer Treatment Revenue Share (%), by Type 2025 & 2033
- Figure 18: Europe Personalized Cancer Treatment Revenue (million), by Country 2025 & 2033
- Figure 19: Europe Personalized Cancer Treatment Revenue Share (%), by Country 2025 & 2033
- Figure 20: Middle East & Africa Personalized Cancer Treatment Revenue (million), by Application 2025 & 2033
- Figure 21: Middle East & Africa Personalized Cancer Treatment Revenue Share (%), by Application 2025 & 2033
- Figure 22: Middle East & Africa Personalized Cancer Treatment Revenue (million), by Type 2025 & 2033
- Figure 23: Middle East & Africa Personalized Cancer Treatment Revenue Share (%), by Type 2025 & 2033
- Figure 24: Middle East & Africa Personalized Cancer Treatment Revenue (million), by Country 2025 & 2033
- Figure 25: Middle East & Africa Personalized Cancer Treatment Revenue Share (%), by Country 2025 & 2033
- Figure 26: Asia Pacific Personalized Cancer Treatment Revenue (million), by Application 2025 & 2033
- Figure 27: Asia Pacific Personalized Cancer Treatment Revenue Share (%), by Application 2025 & 2033
- Figure 28: Asia Pacific Personalized Cancer Treatment Revenue (million), by Type 2025 & 2033
- Figure 29: Asia Pacific Personalized Cancer Treatment Revenue Share (%), by Type 2025 & 2033
- Figure 30: Asia Pacific Personalized Cancer Treatment Revenue (million), by Country 2025 & 2033
- Figure 31: Asia Pacific Personalized Cancer Treatment Revenue Share (%), by Country 2025 & 2033
List of Tables
- Table 1: Global Personalized Cancer Treatment Revenue million Forecast, by Application 2020 & 2033
- Table 2: Global Personalized Cancer Treatment Revenue million Forecast, by Type 2020 & 2033
- Table 3: Global Personalized Cancer Treatment Revenue million Forecast, by Region 2020 & 2033
- Table 4: Global Personalized Cancer Treatment Revenue million Forecast, by Application 2020 & 2033
- Table 5: Global Personalized Cancer Treatment Revenue million Forecast, by Type 2020 & 2033
- Table 6: Global Personalized Cancer Treatment Revenue million Forecast, by Country 2020 & 2033
- Table 7: United States Personalized Cancer Treatment Revenue (million) Forecast, by Application 2020 & 2033
- Table 8: Canada Personalized Cancer Treatment Revenue (million) Forecast, by Application 2020 & 2033
- Table 9: Mexico Personalized Cancer Treatment Revenue (million) Forecast, by Application 2020 & 2033
- Table 10: Global Personalized Cancer Treatment Revenue million Forecast, by Application 2020 & 2033
- Table 11: Global Personalized Cancer Treatment Revenue million Forecast, by Type 2020 & 2033
- Table 12: Global Personalized Cancer Treatment Revenue million Forecast, by Country 2020 & 2033
- Table 13: Brazil Personalized Cancer Treatment Revenue (million) Forecast, by Application 2020 & 2033
- Table 14: Argentina Personalized Cancer Treatment Revenue (million) Forecast, by Application 2020 & 2033
- Table 15: Rest of South America Personalized Cancer Treatment Revenue (million) Forecast, by Application 2020 & 2033
- Table 16: Global Personalized Cancer Treatment Revenue million Forecast, by Application 2020 & 2033
- Table 17: Global Personalized Cancer Treatment Revenue million Forecast, by Type 2020 & 2033
- Table 18: Global Personalized Cancer Treatment Revenue million Forecast, by Country 2020 & 2033
- Table 19: United Kingdom Personalized Cancer Treatment Revenue (million) Forecast, by Application 2020 & 2033
- Table 20: Germany Personalized Cancer Treatment Revenue (million) Forecast, by Application 2020 & 2033
- Table 21: France Personalized Cancer Treatment Revenue (million) Forecast, by Application 2020 & 2033
- Table 22: Italy Personalized Cancer Treatment Revenue (million) Forecast, by Application 2020 & 2033
- Table 23: Spain Personalized Cancer Treatment Revenue (million) Forecast, by Application 2020 & 2033
- Table 24: Russia Personalized Cancer Treatment Revenue (million) Forecast, by Application 2020 & 2033
- Table 25: Benelux Personalized Cancer Treatment Revenue (million) Forecast, by Application 2020 & 2033
- Table 26: Nordics Personalized Cancer Treatment Revenue (million) Forecast, by Application 2020 & 2033
- Table 27: Rest of Europe Personalized Cancer Treatment Revenue (million) Forecast, by Application 2020 & 2033
- Table 28: Global Personalized Cancer Treatment Revenue million Forecast, by Application 2020 & 2033
- Table 29: Global Personalized Cancer Treatment Revenue million Forecast, by Type 2020 & 2033
- Table 30: Global Personalized Cancer Treatment Revenue million Forecast, by Country 2020 & 2033
- Table 31: Turkey Personalized Cancer Treatment Revenue (million) Forecast, by Application 2020 & 2033
- Table 32: Israel Personalized Cancer Treatment Revenue (million) Forecast, by Application 2020 & 2033
- Table 33: GCC Personalized Cancer Treatment Revenue (million) Forecast, by Application 2020 & 2033
- Table 34: North Africa Personalized Cancer Treatment Revenue (million) Forecast, by Application 2020 & 2033
- Table 35: South Africa Personalized Cancer Treatment Revenue (million) Forecast, by Application 2020 & 2033
- Table 36: Rest of Middle East & Africa Personalized Cancer Treatment Revenue (million) Forecast, by Application 2020 & 2033
- Table 37: Global Personalized Cancer Treatment Revenue million Forecast, by Application 2020 & 2033
- Table 38: Global Personalized Cancer Treatment Revenue million Forecast, by Type 2020 & 2033
- Table 39: Global Personalized Cancer Treatment Revenue million Forecast, by Country 2020 & 2033
- Table 40: China Personalized Cancer Treatment Revenue (million) Forecast, by Application 2020 & 2033
- Table 41: India Personalized Cancer Treatment Revenue (million) Forecast, by Application 2020 & 2033
- Table 42: Japan Personalized Cancer Treatment Revenue (million) Forecast, by Application 2020 & 2033
- Table 43: South Korea Personalized Cancer Treatment Revenue (million) Forecast, by Application 2020 & 2033
- Table 44: ASEAN Personalized Cancer Treatment Revenue (million) Forecast, by Application 2020 & 2033
- Table 45: Oceania Personalized Cancer Treatment Revenue (million) Forecast, by Application 2020 & 2033
- Table 46: Rest of Asia Pacific Personalized Cancer Treatment Revenue (million) Forecast, by Application 2020 & 2033
Frequently Asked Questions
1. What is the projected Compound Annual Growth Rate (CAGR) of the Personalized Cancer Treatment?
The projected CAGR is approximately 6.2%.
2. Which companies are prominent players in the Personalized Cancer Treatment?
Key companies in the market include Cellworks, Novartis, Gradalis, Inc, TherapySelect, Personalis, RGCC International, Genentech, BMS, OHC - Oncology Hematology Care, CTOAM, Aadi Bioscience.
3. What are the main segments of the Personalized Cancer Treatment?
The market segments include Application, Type.
4. Can you provide details about the market size?
The market size is estimated to be USD 301 million as of 2022.
5. What are some drivers contributing to market growth?
N/A
6. What are the notable trends driving market growth?
N/A
7. Are there any restraints impacting market growth?
N/A
8. Can you provide examples of recent developments in the market?
N/A
9. What pricing options are available for accessing the report?
Pricing options include single-user, multi-user, and enterprise licenses priced at USD 4900.00, USD 7350.00, and USD 9800.00 respectively.
10. Is the market size provided in terms of value or volume?
The market size is provided in terms of value, measured in million.
11. Are there any specific market keywords associated with the report?
Yes, the market keyword associated with the report is "Personalized Cancer Treatment," which aids in identifying and referencing the specific market segment covered.
12. How do I determine which pricing option suits my needs best?
The pricing options vary based on user requirements and access needs. Individual users may opt for single-user licenses, while businesses requiring broader access may choose multi-user or enterprise licenses for cost-effective access to the report.
13. Are there any additional resources or data provided in the Personalized Cancer Treatment report?
While the report offers comprehensive insights, it's advisable to review the specific contents or supplementary materials provided to ascertain if additional resources or data are available.
14. How can I stay updated on further developments or reports in the Personalized Cancer Treatment?
To stay informed about further developments, trends, and reports in the Personalized Cancer Treatment, consider subscribing to industry newsletters, following relevant companies and organizations, or regularly checking reputable industry news sources and publications.
Methodology
Step 1 - Identification of Relevant Samples Size from Population Database



Step 2 - Approaches for Defining Global Market Size (Value, Volume* & Price*)

Note*: In applicable scenarios
Step 3 - Data Sources
Primary Research
- Web Analytics
- Survey Reports
- Research Institute
- Latest Research Reports
- Opinion Leaders
Secondary Research
- Annual Reports
- White Paper
- Latest Press Release
- Industry Association
- Paid Database
- Investor Presentations

Step 4 - Data Triangulation
Involves using different sources of information in order to increase the validity of a study
These sources are likely to be stakeholders in a program - participants, other researchers, program staff, other community members, and so on.
Then we put all data in single framework & apply various statistical tools to find out the dynamic on the market.
During the analysis stage, feedback from the stakeholder groups would be compared to determine areas of agreement as well as areas of divergence