

Key Insights
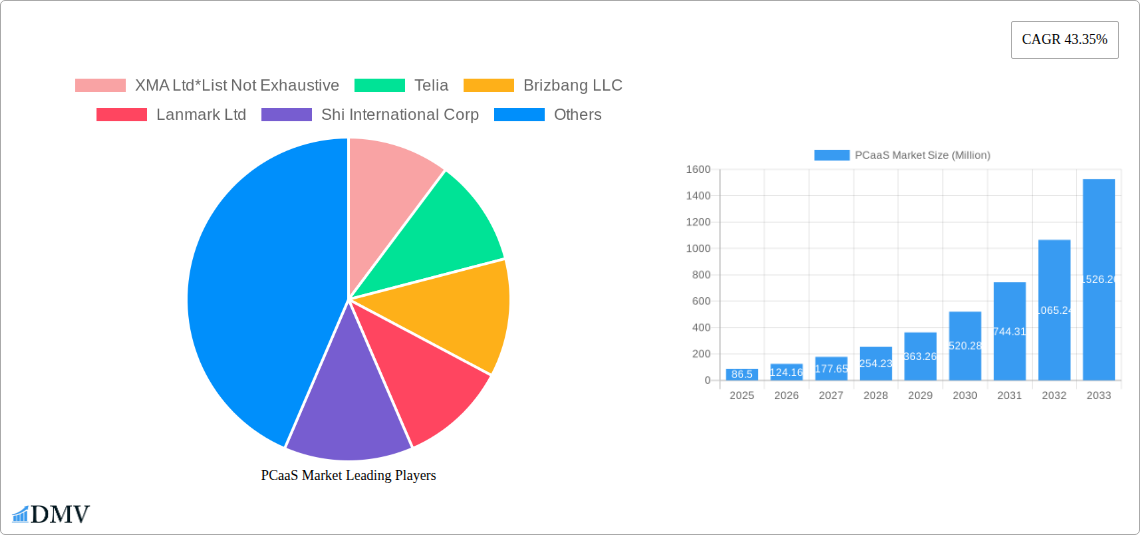
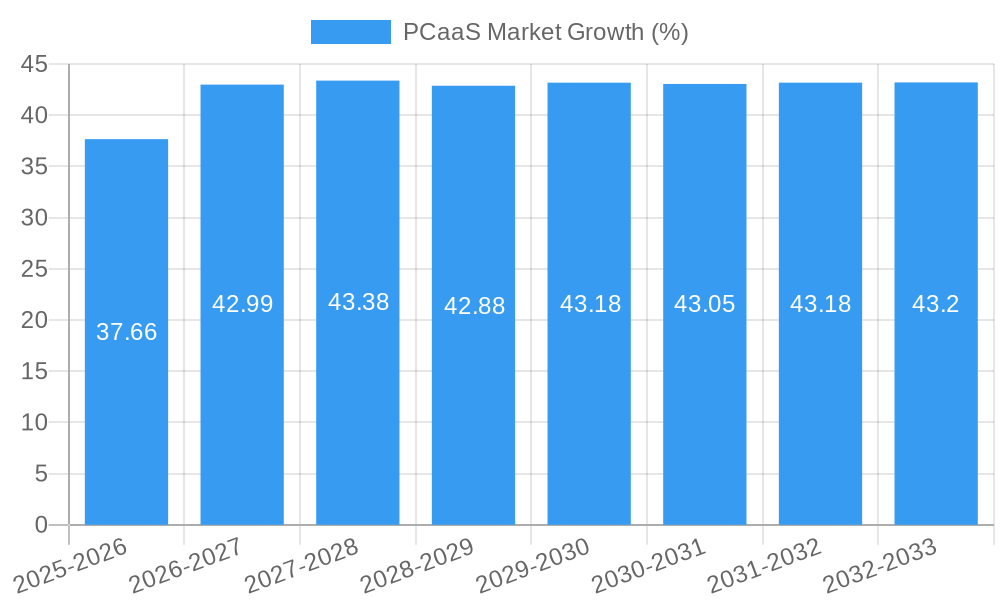
The PCaaS (PC as a Service) market is experiencing robust growth, projected to reach \$86.50 million in 2025 and exhibiting a remarkable Compound Annual Growth Rate (CAGR) of 43.35% from 2025 to 2033. This surge is driven by several key factors. The increasing adoption of cloud-based solutions by businesses of all sizes, seeking to reduce IT infrastructure costs and enhance operational efficiency, is a significant catalyst. Furthermore, the growing demand for flexible and scalable IT solutions, particularly amongst small and medium-sized enterprises (SMEs), is fueling market expansion. The BFSI (Banking, Financial Services, and Insurance), healthcare, and IT sectors are leading adopters, leveraging PCaaS to improve employee productivity, streamline operations, and enhance security. The market is segmented by type (hardware, software, services), deployment type (SMEs, large organizations), and end-user industry, reflecting diverse application needs and deployment models. Competition is intensifying, with established players like HP Inc. and Dell Technologies alongside specialized PCaaS providers vying for market share. The market's continued growth trajectory is anticipated to be influenced by advancements in cloud computing, cybersecurity improvements, and the ongoing digital transformation across various sectors.
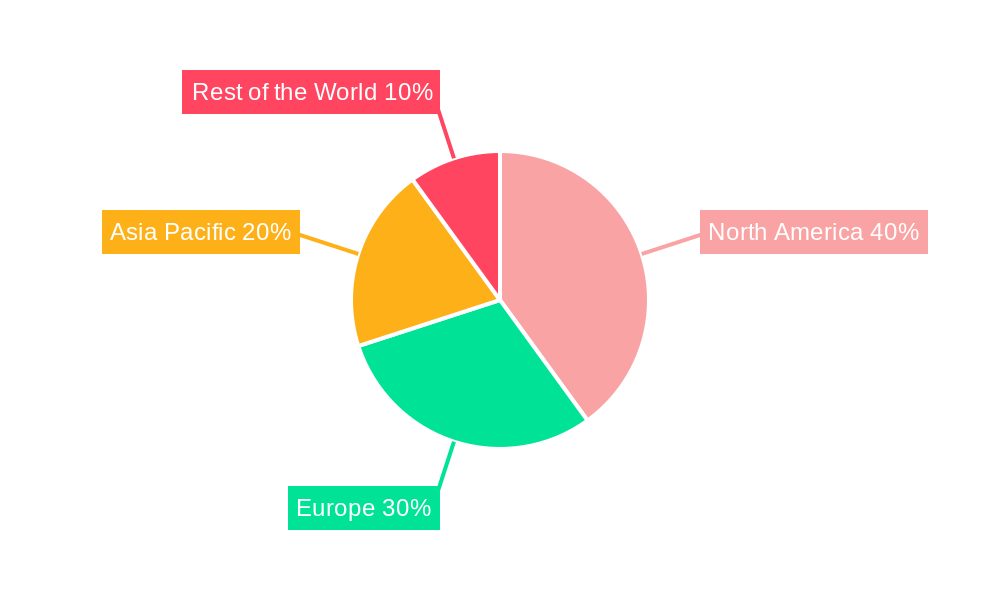
The forecast period (2025-2033) anticipates sustained high growth, primarily fueled by the expanding adoption of PCaaS across diverse industries. North America and Europe are expected to maintain significant market shares due to established technological infrastructure and high digital adoption rates. However, the Asia-Pacific region is projected to witness the fastest growth, driven by rapid economic development and increasing digitalization initiatives. Constraints, though limited, may include concerns around data security and potential reliance on third-party providers. Nonetheless, the overall trend points towards a significant expansion of the PCaaS market, making it an attractive sector for both investors and technology providers.
PCaaS Market: A Comprehensive Report (2019-2033)
This insightful report provides a detailed analysis of the PCaaS (PC as a Service) market, offering a comprehensive overview of its current state, future trajectory, and key players. Covering the period from 2019 to 2033, with a focus on 2025, this report is an essential resource for stakeholders seeking to understand and capitalize on the evolving PCaaS landscape. The market is projected to reach xx Million by 2033, showcasing significant growth potential.
PCaaS Market Composition & Trends
This section delves into the intricate dynamics of the PCaaS market, examining market concentration, innovation drivers, regulatory frameworks, substitute products, end-user profiles, and mergers and acquisitions (M&A) activities. We analyze market share distribution among key players, revealing the competitive landscape and identifying emerging trends. The total market value in 2025 is estimated at xx Million. Significant M&A activity has been observed, with deal values exceeding xx Million in the last five years.
- Market Concentration: The PCaaS market exhibits a moderately concentrated structure, with a few dominant players holding significant market share. However, the emergence of numerous niche players suggests a dynamic competitive environment.
- Innovation Catalysts: Technological advancements such as cloud computing, improved security measures, and enhanced user experience are key drivers of innovation in the PCaaS market.
- Regulatory Landscape: Government regulations concerning data privacy and cybersecurity significantly influence market operations. Compliance requirements are driving demand for secure and compliant PCaaS solutions.
- Substitute Products: Traditional on-premise PC infrastructure poses the main competition to PCaaS. However, PCaaS solutions are gaining traction because of their flexible and cost-effective nature.
- End-User Profiles: The report profiles end-users across various sectors, analyzing their specific needs and adoption rates of PCaaS solutions.
- M&A Activities: We examine completed and potential mergers and acquisitions in the PCaaS industry, assessing their impact on market dynamics and competitive positioning.
PCaaS Market Industry Evolution
This section traces the evolution of the PCaaS market, analyzing growth trajectories, technological advancements, and shifting consumer demands. We explore historical data (2019-2024) and project future growth (2025-2033), providing detailed data points, such as compound annual growth rates (CAGR) and adoption rates across different segments. The market has experienced significant growth, driven by increased adoption of cloud-based services and the growing demand for flexible IT solutions. Technological advancements, particularly in virtualization and remote access technologies, have been pivotal in enabling the growth of the PCaaS market. The shift toward subscription-based models and a focus on user experience have also significantly impacted market expansion.
Leading Regions, Countries, or Segments in PCaaS Market
This section identifies the leading regions, countries, and segments within the PCaaS market. We analyze dominance factors across various categories:
- By Type: The Services segment is projected to be the leading revenue generator.
- By Deployment Type: Large organizations currently dominate the PCaaS market, but the small and medium-scale organizations segment is expected to witness significant growth in the forecast period.
- By End-user Industry: The BFSI (Banking, Financial Services, and Insurance) and IT and Telecom sectors are currently the largest adopters of PCaaS solutions. However, growing adoption across Healthcare and Life Sciences and Government and Defense sectors is expected to drive market expansion.
Key Drivers:
- Investment Trends: Significant venture capital investments are fueling innovation and market expansion in specific regional markets.
- Regulatory Support: Government initiatives promoting digital transformation are driving adoption of PCaaS in certain sectors.
- Technological Advancements: Regional disparities in technological infrastructure influence the pace of PCaaS adoption.
PCaaS Market Product Innovations
Recent product innovations in the PCaaS market focus on enhancing security, improving user experience, and integrating advanced features. New solutions offer streamlined management tools, advanced security protocols, and flexible subscription options tailored to specific needs. Key innovations include improved remote access capabilities, enhanced data protection features, and seamless integration with existing IT infrastructure. These advancements are driving increased adoption across various segments.
Propelling Factors for PCaaS Market Growth
Several factors are driving the growth of the PCaaS market. Technological advancements in cloud computing and virtualization, coupled with the increasing demand for flexible and cost-effective IT solutions, are key drivers. Furthermore, regulatory pressures to enhance data security and streamline IT operations are pushing organizations towards adopting PCaaS solutions. The trend toward subscription-based services also plays a significant role in the market's expansion.
Obstacles in the PCaaS Market
Despite the growth potential, challenges exist. Regulatory hurdles around data privacy and compliance requirements can impede adoption. Supply chain disruptions can affect the availability of hardware components, impacting service delivery. Intense competition from established IT providers and the emergence of new players create pricing pressures and limit profitability for certain market participants. Security concerns and potential dependence on third-party service providers also represent significant barriers.
Future Opportunities in PCaaS Market
Future opportunities lie in expanding into emerging markets, particularly in developing economies. The integration of AI and machine learning technologies into PCaaS platforms offers scope for enhanced functionalities. The increasing focus on sustainability and energy efficiency presents an opportunity to develop eco-friendly PCaaS solutions. Finally, tailored solutions for specific industry verticals will drive further market expansion.
Major Players in the PCaaS Market Ecosystem
- XMA Ltd
- Telia
- Brizbang LLC
- Lanmark Ltd
- Shi International Corp
- HP Inc
- Compucom Systems Inc (Office Depot Inc)
- Utopia Software LLC
- Symetri
- Lenovo Group Ltd
- Intel Corporation
- Dell Technologies
Key Developments in PCaaS Market Industry
- March 2022: Apple launched Apple Business Essentials, providing US small businesses with a bundled service including iCloud storage, 24/7 support, and device management. This significantly broadened the accessibility of PCaaS solutions to the small business sector.
- January 2022: HP expanded its digital services portfolio with a new subscription management service targeted at small and medium-sized businesses. This offering focuses on simplifying software acquisition and aligning with evolving business needs, further strengthening the PCaaS market.
Strategic PCaaS Market Forecast
The PCaaS market is poised for continued growth, driven by ongoing technological advancements, increasing demand for flexible IT solutions, and supportive regulatory frameworks. The expanding adoption across various industry verticals and the emergence of innovative solutions will fuel market expansion in the coming years. Significant opportunities exist for companies to capitalize on this growth by developing customized solutions and enhancing security features to meet evolving customer demands. The market is projected to demonstrate sustained growth, presenting attractive opportunities for both established and emerging players.
PCaaS Market Segmentation
-
1. Type
- 1.1. Hardware
- 1.2. Software
- 1.3. Services
-
2. Deployment Type
- 2.1. Small and Medium-scale Organizations
- 2.2. Large Organizations
-
3. End-user Industry
- 3.1. BFSI
- 3.2. Healthcare and Life Sciences
- 3.3. IT and Telecom
- 3.4. Government and Defense
- 3.5. Education
- 3.6. Other End-user Industries
PCaaS Market Segmentation By Geography
- 1. North America
- 2. Europe
- 3. Asia Pacific
- 4. Rest of the World
PCaaS Market REPORT HIGHLIGHTS
| Aspects | Details |
|---|---|
| Study Period | 2019-2033 |
| Base Year | 2024 |
| Estimated Year | 2025 |
| Forecast Period | 2025-2033 |
| Historical Period | 2019-2024 |
| Growth Rate | CAGR of 43.35% from 2019-2033 |
| Segmentation |
|
Table of Contents
- 1. Introduction
- 1.1. Research Scope
- 1.2. Market Segmentation
- 1.3. Research Methodology
- 1.4. Definitions and Assumptions
- 2. Executive Summary
- 2.1. Introduction
- 3. Market Dynamics
- 3.1. Introduction
- 3.2. Market Drivers
- 3.2.1. Increasing Demand from Small and Medium-scale Organizations Due to Cost Benefits; Renewed Focus on Managed Service Providers
- 3.3. Market Restrains
- 3.3.1. Lack of Product Differentiation
- 3.4. Market Trends
- 3.4.1. Small and Medium-scale Organizations is Expected to Register a Significant Growth
- 4. Market Factor Analysis
- 4.1. Porters Five Forces
- 4.2. Supply/Value Chain
- 4.3. PESTEL analysis
- 4.4. Market Entropy
- 4.5. Patent/Trademark Analysis
- 5. Global PCaaS Market Analysis, Insights and Forecast, 2019-2031
- 5.1. Market Analysis, Insights and Forecast - by Type
- 5.1.1. Hardware
- 5.1.2. Software
- 5.1.3. Services
- 5.2. Market Analysis, Insights and Forecast - by Deployment Type
- 5.2.1. Small and Medium-scale Organizations
- 5.2.2. Large Organizations
- 5.3. Market Analysis, Insights and Forecast - by End-user Industry
- 5.3.1. BFSI
- 5.3.2. Healthcare and Life Sciences
- 5.3.3. IT and Telecom
- 5.3.4. Government and Defense
- 5.3.5. Education
- 5.3.6. Other End-user Industries
- 5.4. Market Analysis, Insights and Forecast - by Region
- 5.4.1. North America
- 5.4.2. Europe
- 5.4.3. Asia Pacific
- 5.4.4. Rest of the World
- 5.1. Market Analysis, Insights and Forecast - by Type
- 6. North America PCaaS Market Analysis, Insights and Forecast, 2019-2031
- 6.1. Market Analysis, Insights and Forecast - by Type
- 6.1.1. Hardware
- 6.1.2. Software
- 6.1.3. Services
- 6.2. Market Analysis, Insights and Forecast - by Deployment Type
- 6.2.1. Small and Medium-scale Organizations
- 6.2.2. Large Organizations
- 6.3. Market Analysis, Insights and Forecast - by End-user Industry
- 6.3.1. BFSI
- 6.3.2. Healthcare and Life Sciences
- 6.3.3. IT and Telecom
- 6.3.4. Government and Defense
- 6.3.5. Education
- 6.3.6. Other End-user Industries
- 6.1. Market Analysis, Insights and Forecast - by Type
- 7. Europe PCaaS Market Analysis, Insights and Forecast, 2019-2031
- 7.1. Market Analysis, Insights and Forecast - by Type
- 7.1.1. Hardware
- 7.1.2. Software
- 7.1.3. Services
- 7.2. Market Analysis, Insights and Forecast - by Deployment Type
- 7.2.1. Small and Medium-scale Organizations
- 7.2.2. Large Organizations
- 7.3. Market Analysis, Insights and Forecast - by End-user Industry
- 7.3.1. BFSI
- 7.3.2. Healthcare and Life Sciences
- 7.3.3. IT and Telecom
- 7.3.4. Government and Defense
- 7.3.5. Education
- 7.3.6. Other End-user Industries
- 7.1. Market Analysis, Insights and Forecast - by Type
- 8. Asia Pacific PCaaS Market Analysis, Insights and Forecast, 2019-2031
- 8.1. Market Analysis, Insights and Forecast - by Type
- 8.1.1. Hardware
- 8.1.2. Software
- 8.1.3. Services
- 8.2. Market Analysis, Insights and Forecast - by Deployment Type
- 8.2.1. Small and Medium-scale Organizations
- 8.2.2. Large Organizations
- 8.3. Market Analysis, Insights and Forecast - by End-user Industry
- 8.3.1. BFSI
- 8.3.2. Healthcare and Life Sciences
- 8.3.3. IT and Telecom
- 8.3.4. Government and Defense
- 8.3.5. Education
- 8.3.6. Other End-user Industries
- 8.1. Market Analysis, Insights and Forecast - by Type
- 9. Rest of the World PCaaS Market Analysis, Insights and Forecast, 2019-2031
- 9.1. Market Analysis, Insights and Forecast - by Type
- 9.1.1. Hardware
- 9.1.2. Software
- 9.1.3. Services
- 9.2. Market Analysis, Insights and Forecast - by Deployment Type
- 9.2.1. Small and Medium-scale Organizations
- 9.2.2. Large Organizations
- 9.3. Market Analysis, Insights and Forecast - by End-user Industry
- 9.3.1. BFSI
- 9.3.2. Healthcare and Life Sciences
- 9.3.3. IT and Telecom
- 9.3.4. Government and Defense
- 9.3.5. Education
- 9.3.6. Other End-user Industries
- 9.1. Market Analysis, Insights and Forecast - by Type
- 10. North America PCaaS Market Analysis, Insights and Forecast, 2019-2031
- 10.1. Market Analysis, Insights and Forecast - By Country/Sub-region
- 10.1.1.
- 11. Europe PCaaS Market Analysis, Insights and Forecast, 2019-2031
- 11.1. Market Analysis, Insights and Forecast - By Country/Sub-region
- 11.1.1.
- 12. Asia Pacific PCaaS Market Analysis, Insights and Forecast, 2019-2031
- 12.1. Market Analysis, Insights and Forecast - By Country/Sub-region
- 12.1.1.
- 13. Rest of the World PCaaS Market Analysis, Insights and Forecast, 2019-2031
- 13.1. Market Analysis, Insights and Forecast - By Country/Sub-region
- 13.1.1.
- 14. Competitive Analysis
- 14.1. Global Market Share Analysis 2024
- 14.2. Company Profiles
- 14.2.1 XMA Ltd*List Not Exhaustive
- 14.2.1.1. Overview
- 14.2.1.2. Products
- 14.2.1.3. SWOT Analysis
- 14.2.1.4. Recent Developments
- 14.2.1.5. Financials (Based on Availability)
- 14.2.2 Telia
- 14.2.2.1. Overview
- 14.2.2.2. Products
- 14.2.2.3. SWOT Analysis
- 14.2.2.4. Recent Developments
- 14.2.2.5. Financials (Based on Availability)
- 14.2.3 Brizbang LLC
- 14.2.3.1. Overview
- 14.2.3.2. Products
- 14.2.3.3. SWOT Analysis
- 14.2.3.4. Recent Developments
- 14.2.3.5. Financials (Based on Availability)
- 14.2.4 Lanmark Ltd
- 14.2.4.1. Overview
- 14.2.4.2. Products
- 14.2.4.3. SWOT Analysis
- 14.2.4.4. Recent Developments
- 14.2.4.5. Financials (Based on Availability)
- 14.2.5 Shi International Corp
- 14.2.5.1. Overview
- 14.2.5.2. Products
- 14.2.5.3. SWOT Analysis
- 14.2.5.4. Recent Developments
- 14.2.5.5. Financials (Based on Availability)
- 14.2.6 HP Inc
- 14.2.6.1. Overview
- 14.2.6.2. Products
- 14.2.6.3. SWOT Analysis
- 14.2.6.4. Recent Developments
- 14.2.6.5. Financials (Based on Availability)
- 14.2.7 Compucom Systems Inc (Office Depot Inc )
- 14.2.7.1. Overview
- 14.2.7.2. Products
- 14.2.7.3. SWOT Analysis
- 14.2.7.4. Recent Developments
- 14.2.7.5. Financials (Based on Availability)
- 14.2.8 Utopia Software LLC
- 14.2.8.1. Overview
- 14.2.8.2. Products
- 14.2.8.3. SWOT Analysis
- 14.2.8.4. Recent Developments
- 14.2.8.5. Financials (Based on Availability)
- 14.2.9 Symetri
- 14.2.9.1. Overview
- 14.2.9.2. Products
- 14.2.9.3. SWOT Analysis
- 14.2.9.4. Recent Developments
- 14.2.9.5. Financials (Based on Availability)
- 14.2.10 Lenovo Group Ltd
- 14.2.10.1. Overview
- 14.2.10.2. Products
- 14.2.10.3. SWOT Analysis
- 14.2.10.4. Recent Developments
- 14.2.10.5. Financials (Based on Availability)
- 14.2.11 Intel Corporation
- 14.2.11.1. Overview
- 14.2.11.2. Products
- 14.2.11.3. SWOT Analysis
- 14.2.11.4. Recent Developments
- 14.2.11.5. Financials (Based on Availability)
- 14.2.12 Dell Technologies
- 14.2.12.1. Overview
- 14.2.12.2. Products
- 14.2.12.3. SWOT Analysis
- 14.2.12.4. Recent Developments
- 14.2.12.5. Financials (Based on Availability)
- 14.2.1 XMA Ltd*List Not Exhaustive
List of Figures
- Figure 1: Global PCaaS Market Revenue Breakdown (Million, %) by Region 2024 & 2032
- Figure 2: North America PCaaS Market Revenue (Million), by Country 2024 & 2032
- Figure 3: North America PCaaS Market Revenue Share (%), by Country 2024 & 2032
- Figure 4: Europe PCaaS Market Revenue (Million), by Country 2024 & 2032
- Figure 5: Europe PCaaS Market Revenue Share (%), by Country 2024 & 2032
- Figure 6: Asia Pacific PCaaS Market Revenue (Million), by Country 2024 & 2032
- Figure 7: Asia Pacific PCaaS Market Revenue Share (%), by Country 2024 & 2032
- Figure 8: Rest of the World PCaaS Market Revenue (Million), by Country 2024 & 2032
- Figure 9: Rest of the World PCaaS Market Revenue Share (%), by Country 2024 & 2032
- Figure 10: North America PCaaS Market Revenue (Million), by Type 2024 & 2032
- Figure 11: North America PCaaS Market Revenue Share (%), by Type 2024 & 2032
- Figure 12: North America PCaaS Market Revenue (Million), by Deployment Type 2024 & 2032
- Figure 13: North America PCaaS Market Revenue Share (%), by Deployment Type 2024 & 2032
- Figure 14: North America PCaaS Market Revenue (Million), by End-user Industry 2024 & 2032
- Figure 15: North America PCaaS Market Revenue Share (%), by End-user Industry 2024 & 2032
- Figure 16: North America PCaaS Market Revenue (Million), by Country 2024 & 2032
- Figure 17: North America PCaaS Market Revenue Share (%), by Country 2024 & 2032
- Figure 18: Europe PCaaS Market Revenue (Million), by Type 2024 & 2032
- Figure 19: Europe PCaaS Market Revenue Share (%), by Type 2024 & 2032
- Figure 20: Europe PCaaS Market Revenue (Million), by Deployment Type 2024 & 2032
- Figure 21: Europe PCaaS Market Revenue Share (%), by Deployment Type 2024 & 2032
- Figure 22: Europe PCaaS Market Revenue (Million), by End-user Industry 2024 & 2032
- Figure 23: Europe PCaaS Market Revenue Share (%), by End-user Industry 2024 & 2032
- Figure 24: Europe PCaaS Market Revenue (Million), by Country 2024 & 2032
- Figure 25: Europe PCaaS Market Revenue Share (%), by Country 2024 & 2032
- Figure 26: Asia Pacific PCaaS Market Revenue (Million), by Type 2024 & 2032
- Figure 27: Asia Pacific PCaaS Market Revenue Share (%), by Type 2024 & 2032
- Figure 28: Asia Pacific PCaaS Market Revenue (Million), by Deployment Type 2024 & 2032
- Figure 29: Asia Pacific PCaaS Market Revenue Share (%), by Deployment Type 2024 & 2032
- Figure 30: Asia Pacific PCaaS Market Revenue (Million), by End-user Industry 2024 & 2032
- Figure 31: Asia Pacific PCaaS Market Revenue Share (%), by End-user Industry 2024 & 2032
- Figure 32: Asia Pacific PCaaS Market Revenue (Million), by Country 2024 & 2032
- Figure 33: Asia Pacific PCaaS Market Revenue Share (%), by Country 2024 & 2032
- Figure 34: Rest of the World PCaaS Market Revenue (Million), by Type 2024 & 2032
- Figure 35: Rest of the World PCaaS Market Revenue Share (%), by Type 2024 & 2032
- Figure 36: Rest of the World PCaaS Market Revenue (Million), by Deployment Type 2024 & 2032
- Figure 37: Rest of the World PCaaS Market Revenue Share (%), by Deployment Type 2024 & 2032
- Figure 38: Rest of the World PCaaS Market Revenue (Million), by End-user Industry 2024 & 2032
- Figure 39: Rest of the World PCaaS Market Revenue Share (%), by End-user Industry 2024 & 2032
- Figure 40: Rest of the World PCaaS Market Revenue (Million), by Country 2024 & 2032
- Figure 41: Rest of the World PCaaS Market Revenue Share (%), by Country 2024 & 2032
List of Tables
- Table 1: Global PCaaS Market Revenue Million Forecast, by Region 2019 & 2032
- Table 2: Global PCaaS Market Revenue Million Forecast, by Type 2019 & 2032
- Table 3: Global PCaaS Market Revenue Million Forecast, by Deployment Type 2019 & 2032
- Table 4: Global PCaaS Market Revenue Million Forecast, by End-user Industry 2019 & 2032
- Table 5: Global PCaaS Market Revenue Million Forecast, by Region 2019 & 2032
- Table 6: Global PCaaS Market Revenue Million Forecast, by Country 2019 & 2032
- Table 7: PCaaS Market Revenue (Million) Forecast, by Application 2019 & 2032
- Table 8: Global PCaaS Market Revenue Million Forecast, by Country 2019 & 2032
- Table 9: PCaaS Market Revenue (Million) Forecast, by Application 2019 & 2032
- Table 10: Global PCaaS Market Revenue Million Forecast, by Country 2019 & 2032
- Table 11: PCaaS Market Revenue (Million) Forecast, by Application 2019 & 2032
- Table 12: Global PCaaS Market Revenue Million Forecast, by Country 2019 & 2032
- Table 13: PCaaS Market Revenue (Million) Forecast, by Application 2019 & 2032
- Table 14: Global PCaaS Market Revenue Million Forecast, by Type 2019 & 2032
- Table 15: Global PCaaS Market Revenue Million Forecast, by Deployment Type 2019 & 2032
- Table 16: Global PCaaS Market Revenue Million Forecast, by End-user Industry 2019 & 2032
- Table 17: Global PCaaS Market Revenue Million Forecast, by Country 2019 & 2032
- Table 18: Global PCaaS Market Revenue Million Forecast, by Type 2019 & 2032
- Table 19: Global PCaaS Market Revenue Million Forecast, by Deployment Type 2019 & 2032
- Table 20: Global PCaaS Market Revenue Million Forecast, by End-user Industry 2019 & 2032
- Table 21: Global PCaaS Market Revenue Million Forecast, by Country 2019 & 2032
- Table 22: Global PCaaS Market Revenue Million Forecast, by Type 2019 & 2032
- Table 23: Global PCaaS Market Revenue Million Forecast, by Deployment Type 2019 & 2032
- Table 24: Global PCaaS Market Revenue Million Forecast, by End-user Industry 2019 & 2032
- Table 25: Global PCaaS Market Revenue Million Forecast, by Country 2019 & 2032
- Table 26: Global PCaaS Market Revenue Million Forecast, by Type 2019 & 2032
- Table 27: Global PCaaS Market Revenue Million Forecast, by Deployment Type 2019 & 2032
- Table 28: Global PCaaS Market Revenue Million Forecast, by End-user Industry 2019 & 2032
- Table 29: Global PCaaS Market Revenue Million Forecast, by Country 2019 & 2032
Frequently Asked Questions
1. What is the projected Compound Annual Growth Rate (CAGR) of the PCaaS Market?
The projected CAGR is approximately 43.35%.
2. Which companies are prominent players in the PCaaS Market?
Key companies in the market include XMA Ltd*List Not Exhaustive, Telia, Brizbang LLC, Lanmark Ltd, Shi International Corp, HP Inc, Compucom Systems Inc (Office Depot Inc ), Utopia Software LLC, Symetri, Lenovo Group Ltd, Intel Corporation, Dell Technologies.
3. What are the main segments of the PCaaS Market?
The market segments include Type, Deployment Type, End-user Industry.
4. Can you provide details about the market size?
The market size is estimated to be USD 86.50 Million as of 2022.
5. What are some drivers contributing to market growth?
Increasing Demand from Small and Medium-scale Organizations Due to Cost Benefits; Renewed Focus on Managed Service Providers.
6. What are the notable trends driving market growth?
Small and Medium-scale Organizations is Expected to Register a Significant Growth.
7. Are there any restraints impacting market growth?
Lack of Product Differentiation.
8. Can you provide examples of recent developments in the market?
March 2022: Apple stated that all US small businesses can now access Apple Business Essentials. The new service combines iCloud storage, 24/7 Apple support, and device management into customizable subscription options. AppleCare+ for Business Essentials choices that may be added to any plan were also revealed by Apple. All clients, including those using Apple Business Essentials in beta, will also have access to a two-month free trial.
9. What pricing options are available for accessing the report?
Pricing options include single-user, multi-user, and enterprise licenses priced at USD 4750, USD 5250, and USD 8750 respectively.
10. Is the market size provided in terms of value or volume?
The market size is provided in terms of value, measured in Million.
11. Are there any specific market keywords associated with the report?
Yes, the market keyword associated with the report is "PCaaS Market," which aids in identifying and referencing the specific market segment covered.
12. How do I determine which pricing option suits my needs best?
The pricing options vary based on user requirements and access needs. Individual users may opt for single-user licenses, while businesses requiring broader access may choose multi-user or enterprise licenses for cost-effective access to the report.
13. Are there any additional resources or data provided in the PCaaS Market report?
While the report offers comprehensive insights, it's advisable to review the specific contents or supplementary materials provided to ascertain if additional resources or data are available.
14. How can I stay updated on further developments or reports in the PCaaS Market?
To stay informed about further developments, trends, and reports in the PCaaS Market, consider subscribing to industry newsletters, following relevant companies and organizations, or regularly checking reputable industry news sources and publications.
Methodology
Step 1 - Identification of Relevant Samples Size from Population Database


Step 2 - Approaches for Defining Global Market Size (Value, Volume* & Price*)

Note*: In applicable scenarios
Step 3 - Data Sources
Primary Research
- Web Analytics
- Survey Reports
- Research Institute
- Latest Research Reports
- Opinion Leaders
Secondary Research
- Annual Reports
- White Paper
- Latest Press Release
- Industry Association
- Paid Database
- Investor Presentations

Step 4 - Data Triangulation
Involves using different sources of information in order to increase the validity of a study
These sources are likely to be stakeholders in a program - participants, other researchers, program staff, other community members, and so on.
Then we put all data in single framework & apply various statistical tools to find out the dynamic on the market.
During the analysis stage, feedback from the stakeholder groups would be compared to determine areas of agreement as well as areas of divergence
