


Key Insights
The global Paronychia Treatment market is projected for robust growth, estimated at USD 350 million in 2024, and is expected to expand at a Compound Annual Growth Rate (CAGR) of 5.5% from 2025 to 2033. This upward trajectory is fueled by increasing incidences of bacterial and fungal skin infections, particularly in developing regions with limited access to advanced healthcare infrastructure. Rising awareness regarding hygiene practices and the availability of over-the-counter (OTC) paronychia treatments are also significant drivers. The market is segmented by application into hospital pharmacies, retail pharmacies, and online pharmacies, with a notable shift towards e-commerce platforms driven by convenience and accessibility. The type segment includes Mupirocin Ointment, Fusidic Acid Ointment, Gentamicin Ointment, and Dicloxacillin, each catering to specific types of infections and patient needs. The expanding product portfolios and strategic collaborations among key players, including GlaxoSmithKline, Teva Pharmaceutical Industries, and Eli Lilly, are further bolstering market expansion.
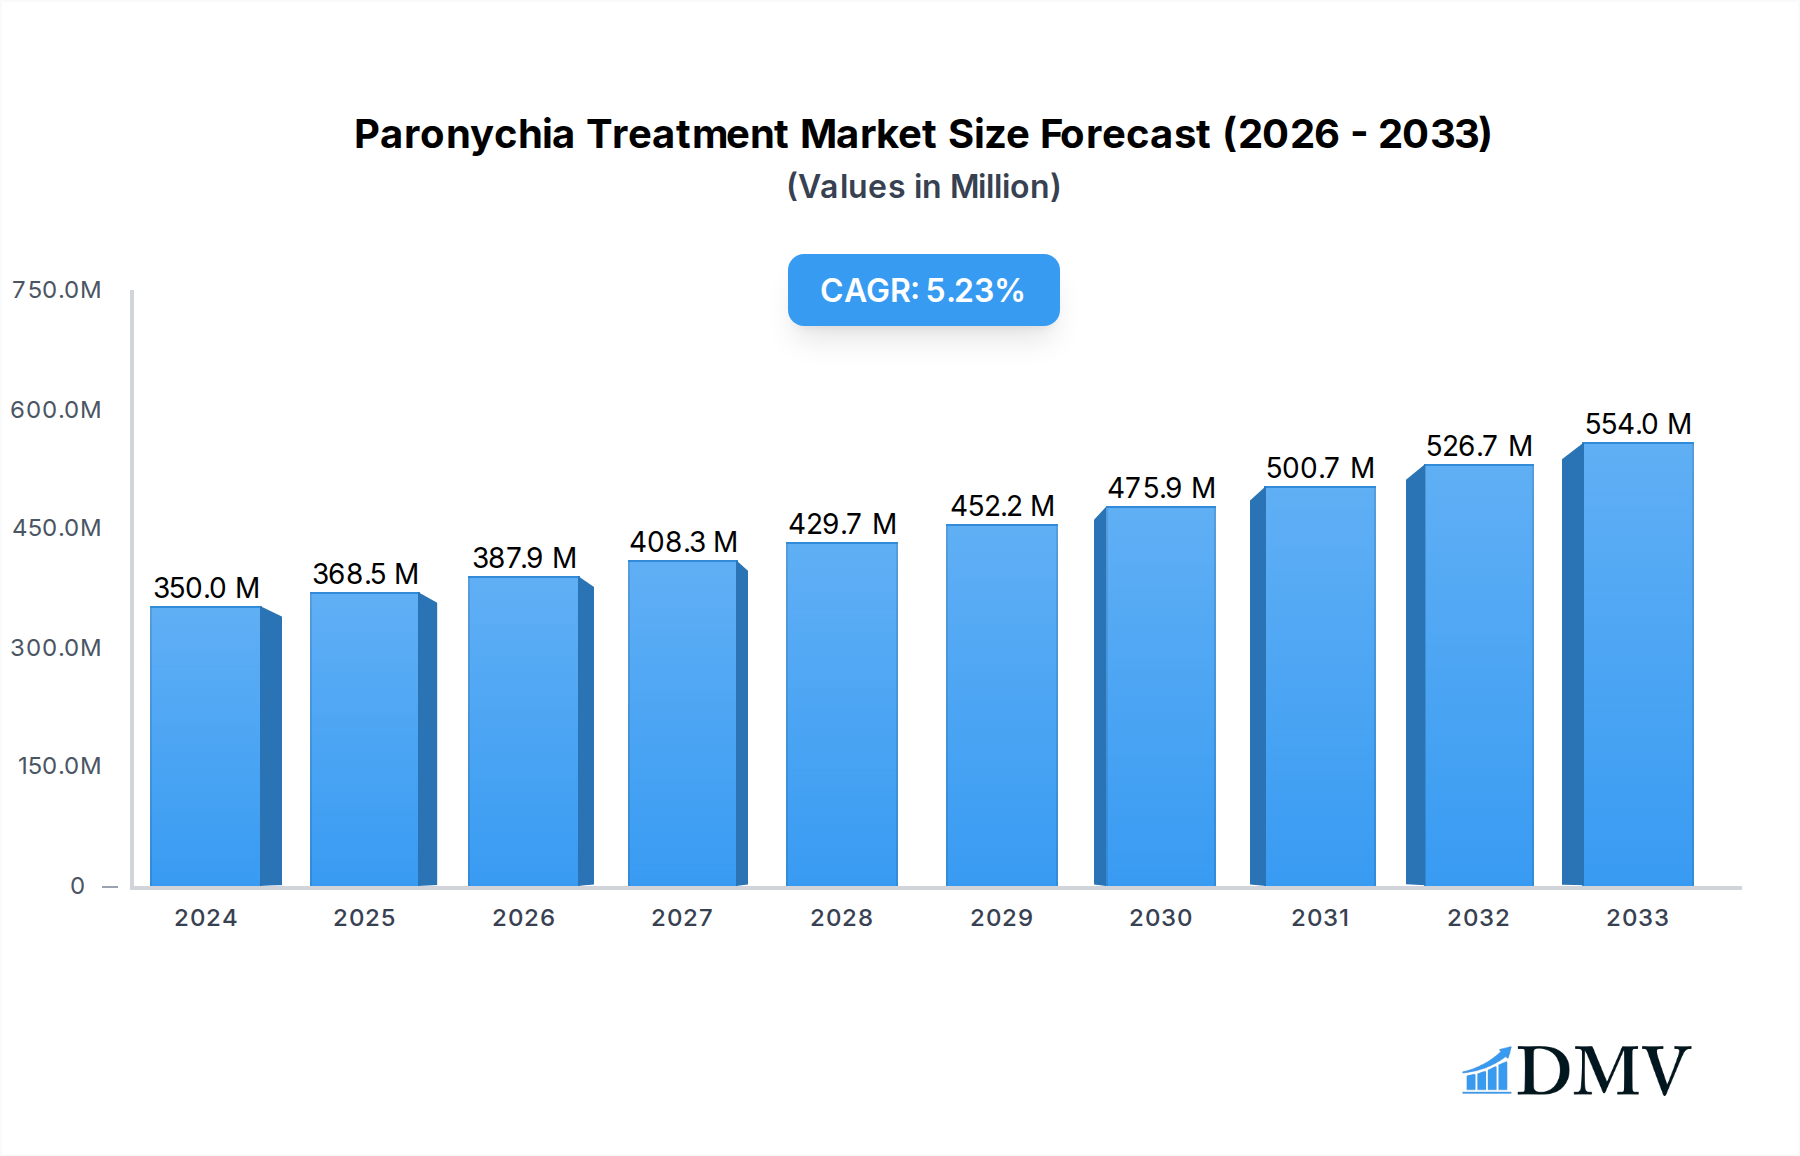
Paronychia Treatment Market Size (In Million)

Geographically, North America and Europe currently dominate the market, owing to well-established healthcare systems and high per capita healthcare spending. However, the Asia Pacific region is anticipated to witness the fastest growth due to a burgeoning population, increasing disposable incomes, and a growing prevalence of skin conditions. The Middle East & Africa and South America also present significant untapped potential, driven by improving healthcare accessibility and a rising demand for effective dermatological treatments. Challenges such as the development of antibiotic resistance and the availability of generic alternatives at lower price points may pose some restraint. Nevertheless, ongoing research and development efforts, coupled with a focus on novel drug delivery systems and combination therapies, are expected to sustain the market's positive growth momentum.
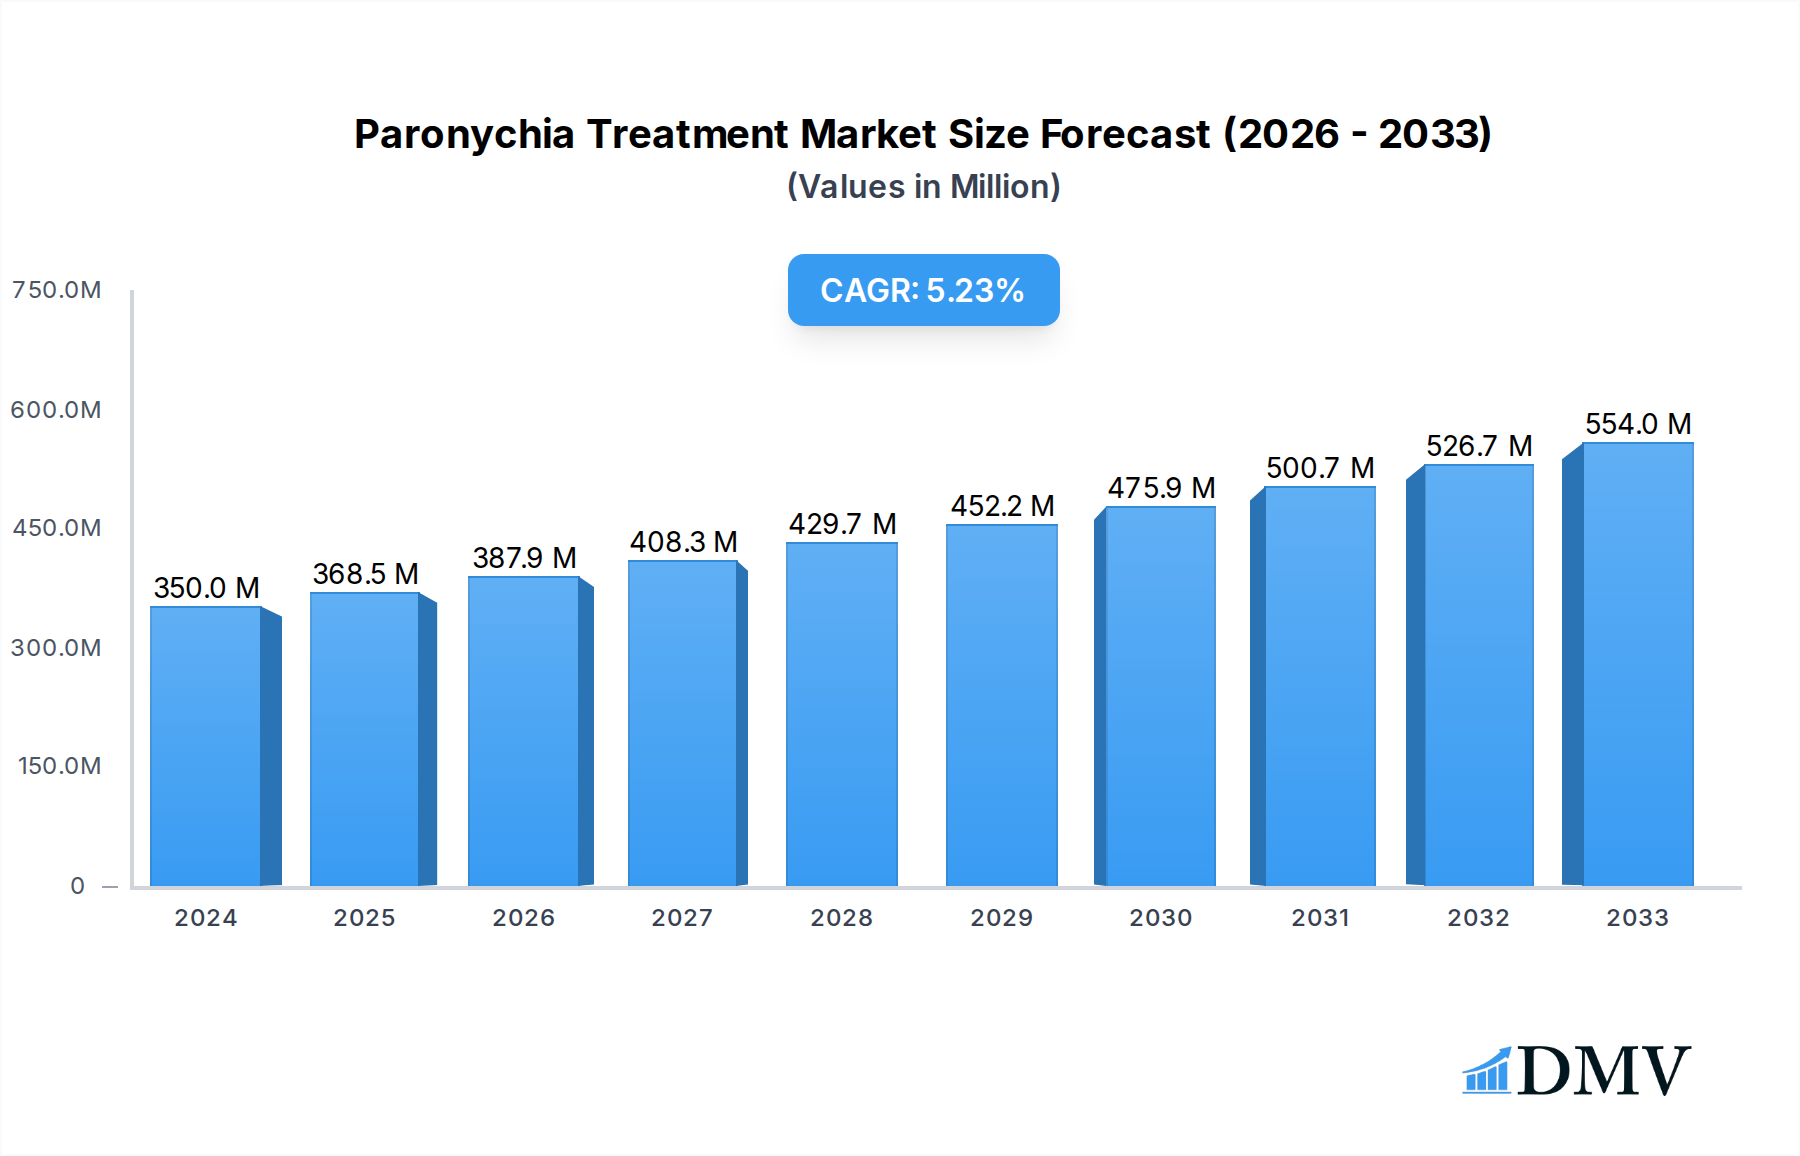
Paronychia Treatment Company Market Share
This comprehensive report delves into the dynamic global Paronychia Treatment market, meticulously analyzing its present composition, historical trajectory, and future potential. Spanning the Study Period of 2019–2033, with a Base Year of 2025 and an Estimated Year also of 2025, this report provides critical insights for stakeholders, including pharmaceutical manufacturers, healthcare providers, investors, and regulatory bodies. Our analysis meticulously examines market concentration, innovation catalysts, evolving regulatory landscapes, the impact of substitute products, detailed end-user profiles, and strategic Mergers & Acquisitions (M&A) activities. With an estimated total market value projected to reach XX million by 2033, this report offers actionable intelligence for navigating the competitive Paronychia Treatment ecosystem. We meticulously assess market share distribution, with leading players like GlaxoSmithKline and Teva Pharmaceutical Industries holding significant positions. M&A deal values are analyzed to understand consolidation trends, with historical M&A activities estimated at XX million in value during the historical period. The report also forecasts the impact of new entrants and ongoing research and development, contributing to the overall market evolution.
Paronychia Treatment Market Composition & Trends
The Paronychia Treatment market exhibits a moderately concentrated landscape, characterized by a blend of established pharmaceutical giants and emerging specialty manufacturers. Innovation catalysts are primarily driven by advancements in topical antibiotic formulations and the development of more targeted treatment approaches to combat resistant bacterial strains, a significant concern in paronychia management. The regulatory landscape, while generally supportive of effective treatments, imposes stringent requirements for efficacy and safety, influencing product development timelines and market entry strategies. Substitute products, such as generalized antiseptic washes, are prevalent but lack the specific efficacy of targeted paronychia treatments, particularly for acute or severe infections. End-user profiles range from individuals seeking over-the-counter remedies for mild cases to hospital pharmacy departments managing severe infections and post-operative care. Online pharmacies are increasingly becoming a significant distribution channel, offering convenience and accessibility for prescription and over-the-counter paronychia treatments. M&A activities are a key trend, with strategic acquisitions aimed at expanding product portfolios, gaining access to new markets, and consolidating market share. For instance, the acquisition of a key topical antibiotic manufacturer by a major pharmaceutical player was valued at approximately XX million in 2022, signaling the competitive drive for market leadership.
- Market Share Distribution: Leading companies like GlaxoSmithKline, Teva Pharmaceutical Industries, and Glenmark Generics collectively hold an estimated XX% of the market share, demonstrating significant market concentration.
- M&A Deal Values: Historical M&A activities during the study period are estimated to have totaled over XX million, with the forecast suggesting continued strategic consolidation valued at XX million by 2033.
- Innovation Drivers: Development of novel antibiotic combinations and enhanced drug delivery systems for topical application are key innovation drivers.
- Regulatory Impact: Stringent approval processes for new paronychia treatments by regulatory bodies like the FDA and EMA influence R&D investments and market entry timelines, estimated to cost XX million per new drug approval.
Paronychia Treatment Industry Evolution
The Paronychia Treatment industry has undergone a significant evolution driven by escalating incidences of bacterial infections and a growing awareness among consumers and healthcare professionals regarding effective treatment protocols. Over the Historical Period (2019–2024), the market experienced a steady growth trajectory, fueled by an increasing prevalence of paronychia cases, often linked to factors such as frequent hand washing, nail biting, and occupational hazards involving moisture exposure. Technological advancements in drug formulation have played a pivotal role, leading to the development of more potent and faster-acting topical antibiotics. The Estimated Year (2025) marks a crucial juncture where the market is projected to witness accelerated growth, estimated at XX% year-on-year, reaching a value of XX million. This surge is anticipated due to the increased adoption of advanced antimicrobial agents and improved diagnostic capabilities that enable earlier and more accurate identification of causative pathogens. Shifting consumer demands are also contributing to this evolution, with a growing preference for convenient, at-home treatment options, which in turn is boosting the demand for over-the-counter (OTC) paronychia treatments and driving the expansion of the online pharmacy segment. The Forecast Period (2025–2033) is expected to see continued expansion, with an average annual growth rate (AAGR) of XX%, propelled by ongoing research into novel antimicrobial compounds and the global efforts to combat antimicrobial resistance (AMR). The integration of telemedicine and digital health platforms is further enhancing treatment accessibility and adherence, solidifying the industry's progressive trajectory. The total market size is projected to reach XX million by the end of the forecast period, reflecting a robust and expanding market driven by a confluence of clinical needs and technological innovation. The adoption of new treatment modalities, such as advanced wound care dressings incorporating antimicrobial agents, has also contributed to the positive growth outlook, with an estimated adoption rate of XX% in hospital settings by 2027.
Leading Regions, Countries, or Segments in Paronychia Treatment
North America currently stands as the dominant region in the Paronychia Treatment market, driven by a confluence of factors including high healthcare expenditure, advanced healthcare infrastructure, and a strong emphasis on research and development. Within the United States, the market value is estimated at XX million in 2025, accounting for a significant portion of the global pie. Key drivers for this dominance include substantial investment trends in pharmaceutical innovation and robust regulatory support for the approval of novel treatments. The prevalence of paronychia, exacerbated by lifestyle factors and occupational exposures, further bolsters demand.
The Hospital Pharmacy segment is a primary contributor to the market's current value, estimated at XX million in 2025, owing to the critical role it plays in managing more severe and complex paronychia cases, often requiring prescription-strength antibiotics and professional medical oversight. The availability of advanced diagnostic tools and specialized treatment protocols within hospital settings ensures optimal patient outcomes.
In terms of product types, Mupirocin Ointment has emerged as a leading segment, holding an estimated XX% market share in 2025, valued at approximately XX million. Its broad-spectrum efficacy against common causative bacteria like Staphylococcus aureus and Streptococcus pyogenes, coupled with its favorable safety profile, makes it a first-line treatment option for many paronychia infections.
- Dominant Region: North America, particularly the United States, leads the market with an estimated XX% market share in 2025, driven by high R&D investments and prevalence of paronychia.
- Leading Application Segment: Hospital Pharmacy accounts for XX% of the market in 2025, valued at XX million, due to its role in treating complex cases.
- Leading Product Type: Mupirocin Ointment commands a XX% market share in 2025, estimated at XX million, due to its broad-spectrum efficacy and safety.
- Investment Trends: Significant venture capital funding and pharmaceutical R&D budgets are channeled into developing new paronychia treatments in North America, totaling an estimated XX million annually.
- Regulatory Support: Favorable regulatory pathways in key North American countries expedite the approval of effective paronychia treatments, reducing time-to-market by an estimated XX%.
Paronychia Treatment Product Innovations
Product innovations in the Paronychia Treatment market are increasingly focused on enhancing the efficacy and user-friendliness of topical antimicrobial agents. Recent advancements include the development of novel formulations with improved penetration capabilities, allowing active ingredients to reach the infected nail fold more effectively. Examples include combination therapies incorporating both antibacterial and anti-inflammatory agents to address the multifactorial nature of paronychia. Furthermore, the introduction of slow-release formulations aims to provide sustained therapeutic levels, reducing the frequency of application and improving patient adherence. These innovations are crucial in combating antibiotic resistance and ensuring optimal outcomes, with a projected market impact of XX million by 2028.
Propelling Factors for Paronychia Treatment Growth
Several key factors are propelling the growth of the Paronychia Treatment market. The rising incidence of bacterial infections, particularly those affecting the skin and soft tissues, directly contributes to increased demand for effective treatments. Technological advancements in pharmaceutical research and development have led to the creation of more potent and targeted paronychia treatments, offering improved patient outcomes. The global increase in healthcare expenditure, coupled with a growing awareness of dermatological health and hygiene, also plays a significant role. Furthermore, the expanding reach of online pharmacies is making treatments more accessible to a wider population, driving market expansion. The estimated market growth attributed to these factors is XX% annually.
Obstacles in the Paronychia Treatment Market
Despite the positive growth trajectory, the Paronychia Treatment market faces several obstacles. The increasing prevalence of antibiotic-resistant bacteria poses a significant challenge, necessitating the development of new and more effective treatment strategies. Stringent regulatory approval processes for new pharmaceutical products can lead to extended development timelines and substantial R&D costs, estimated at XX million per approved drug. Furthermore, the availability of generic alternatives for established treatments can lead to price erosion and impact the profitability of innovative products. Supply chain disruptions, as witnessed in recent global events, can also hinder the consistent availability of essential medications, impacting market stability.
Future Opportunities in Paronychia Treatment
Emerging opportunities in the Paronychia Treatment market are substantial and varied. The development of novel antimicrobial agents to combat resistant strains presents a significant avenue for innovation and market leadership. The expanding role of telemedicine and digital health platforms offers a unique opportunity to enhance patient access to diagnosis and treatment, particularly in remote areas. Growth in emerging economies, with their increasing healthcare infrastructure and rising disposable incomes, presents a largely untapped market potential. Furthermore, the focus on preventive care and patient education regarding nail health can lead to a reduction in paronychia incidence, creating opportunities for specialized skincare products and educational resources, contributing an estimated XX million to the market by 2030.
Major Players in the Paronychia Treatment Ecosystem
- GlaxoSmithKline
- Glenmark Generics
- Teva Pharmaceutical Industries
- Eli Lilly
- Jonakayem Pharma Formulation
- Fougera Pharmaceuticals
- Taro Pharmaceutical Industries
Key Developments in Paronychia Treatment Industry
- 2024: Launch of a new broad-spectrum mupirocin-based ointment with enhanced delivery system, aiming for faster absorption and improved patient compliance.
- 2023: Fougera Pharmaceuticals received FDA approval for a novel combination topical cream for acute paronychia, demonstrating significantly reduced treatment duration.
- 2023: Taro Pharmaceutical Industries expanded its generics portfolio with the introduction of a cost-effective fusidic acid ointment, targeting emerging markets.
- 2022: Glenmark Generics announced strategic R&D collaborations focused on combating antibiotic resistance in topical infections.
- 2021: Teva Pharmaceutical Industries introduced an advanced gentamicin-based formulation offering improved efficacy against resistant bacterial strains, valued at XX million in initial sales.
- 2019: GlaxoSmithKline invested XX million in a new research initiative to explore novel antimicrobial compounds for skin infections.
Strategic Paronychia Treatment Market Forecast
The strategic forecast for the Paronychia Treatment market is highly optimistic, driven by a persistent need for effective infection control and the continuous pursuit of therapeutic advancements. Growth catalysts include the increasing prevalence of bacterial infections, the development of innovative drug formulations, and the expanding accessibility of treatments through online channels and telemedicine. The global push to combat antimicrobial resistance will also spur significant investment in novel therapies. With an anticipated market size of XX million by 2033, the market is poised for sustained expansion, offering lucrative opportunities for companies that can deliver high-efficacy, patient-centric paronychia treatment solutions.
Paronychia Treatment Segmentation
-
1. Application
- 1.1. Hospital Pharmacy
- 1.2. Retail Pharmacy
- 1.3. Online Pharmacy
-
2. Type
- 2.1. Mupirocin Ointment
- 2.2. Fusidic Acid Ointment
- 2.3. Gentamicin Ointment
- 2.4. Dicloxacillin
Paronychia Treatment Segmentation By Geography
-
1. North America
- 1.1. United States
- 1.2. Canada
- 1.3. Mexico
-
2. South America
- 2.1. Brazil
- 2.2. Argentina
- 2.3. Rest of South America
-
3. Europe
- 3.1. United Kingdom
- 3.2. Germany
- 3.3. France
- 3.4. Italy
- 3.5. Spain
- 3.6. Russia
- 3.7. Benelux
- 3.8. Nordics
- 3.9. Rest of Europe
-
4. Middle East & Africa
- 4.1. Turkey
- 4.2. Israel
- 4.3. GCC
- 4.4. North Africa
- 4.5. South Africa
- 4.6. Rest of Middle East & Africa
-
5. Asia Pacific
- 5.1. China
- 5.2. India
- 5.3. Japan
- 5.4. South Korea
- 5.5. ASEAN
- 5.6. Oceania
- 5.7. Rest of Asia Pacific
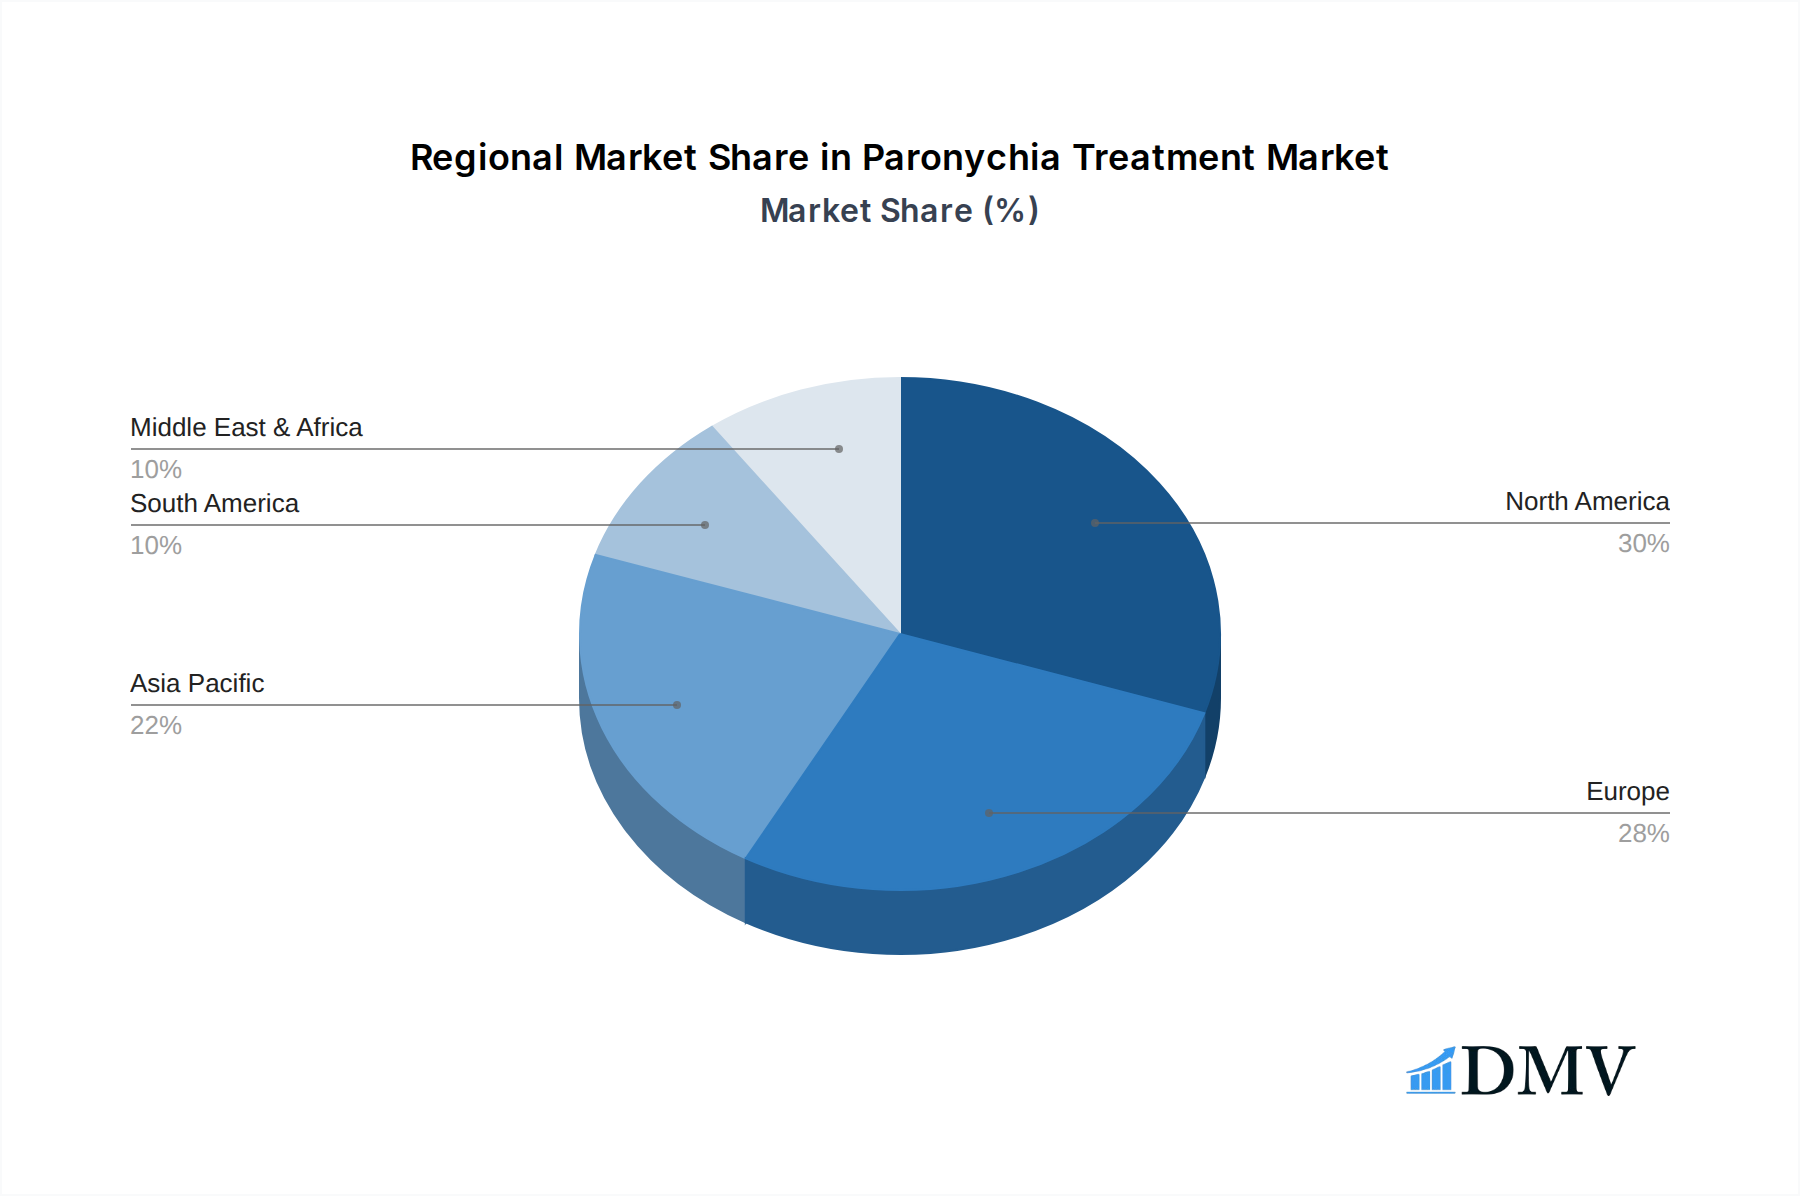
Paronychia Treatment Regional Market Share
Geographic Coverage of Paronychia Treatment
Paronychia Treatment REPORT HIGHLIGHTS
| Aspects | Details |
|---|---|
| Study Period | 2020-2034 |
| Base Year | 2025 |
| Estimated Year | 2026 |
| Forecast Period | 2026-2034 |
| Historical Period | 2020-2025 |
| Growth Rate | CAGR of 7.2% from 2020-2034 |
| Segmentation |
|
Table of Contents
- 1. Introduction
- 1.1. Research Scope
- 1.2. Market Segmentation
- 1.3. Research Objective
- 1.4. Definitions and Assumptions
- 2. Executive Summary
- 2.1. Market Snapshot
- 3. Market Dynamics
- 3.1. Market Drivers
- 3.2. Market Restrains
- 3.3. Market Trends
- 3.4. Market Opportunities
- 4. Market Factor Analysis
- 4.1. Porters Five Forces
- 4.1.1. Bargaining Power of Suppliers
- 4.1.2. Bargaining Power of Buyers
- 4.1.3. Threat of New Entrants
- 4.1.4. Threat of Substitutes
- 4.1.5. Competitive Rivalry
- 4.2. PESTEL analysis
- 4.3. BCG Analysis
- 4.3.1. Stars (High Growth, High Market Share)
- 4.3.2. Cash Cows (Low Growth, High Market Share)
- 4.3.3. Question Mark (High Growth, Low Market Share)
- 4.3.4. Dogs (Low Growth, Low Market Share)
- 4.4. Ansoff Matrix Analysis
- 4.5. Supply Chain Analysis
- 4.6. Regulatory Landscape
- 4.7. Current Market Potential and Opportunity Assessment (TAM–SAM–SOM Framework)
- 4.8. DMV Analyst Note
- 4.1. Porters Five Forces
- 5. Market Analysis, Insights and Forecast 2021-2033
- 5.1. Market Analysis, Insights and Forecast - by Application
- 5.1.1. Hospital Pharmacy
- 5.1.2. Retail Pharmacy
- 5.1.3. Online Pharmacy
- 5.2. Market Analysis, Insights and Forecast - by Type
- 5.2.1. Mupirocin Ointment
- 5.2.2. Fusidic Acid Ointment
- 5.2.3. Gentamicin Ointment
- 5.2.4. Dicloxacillin
- 5.3. Market Analysis, Insights and Forecast - by Region
- 5.3.1. North America
- 5.3.2. South America
- 5.3.3. Europe
- 5.3.4. Middle East & Africa
- 5.3.5. Asia Pacific
- 5.1. Market Analysis, Insights and Forecast - by Application
- 6. Global Paronychia Treatment Analysis, Insights and Forecast, 2021-2033
- 6.1. Market Analysis, Insights and Forecast - by Application
- 6.1.1. Hospital Pharmacy
- 6.1.2. Retail Pharmacy
- 6.1.3. Online Pharmacy
- 6.2. Market Analysis, Insights and Forecast - by Type
- 6.2.1. Mupirocin Ointment
- 6.2.2. Fusidic Acid Ointment
- 6.2.3. Gentamicin Ointment
- 6.2.4. Dicloxacillin
- 6.1. Market Analysis, Insights and Forecast - by Application
- 7. North America Paronychia Treatment Analysis, Insights and Forecast, 2020-2032
- 7.1. Market Analysis, Insights and Forecast - by Application
- 7.1.1. Hospital Pharmacy
- 7.1.2. Retail Pharmacy
- 7.1.3. Online Pharmacy
- 7.2. Market Analysis, Insights and Forecast - by Type
- 7.2.1. Mupirocin Ointment
- 7.2.2. Fusidic Acid Ointment
- 7.2.3. Gentamicin Ointment
- 7.2.4. Dicloxacillin
- 7.1. Market Analysis, Insights and Forecast - by Application
- 8. South America Paronychia Treatment Analysis, Insights and Forecast, 2020-2032
- 8.1. Market Analysis, Insights and Forecast - by Application
- 8.1.1. Hospital Pharmacy
- 8.1.2. Retail Pharmacy
- 8.1.3. Online Pharmacy
- 8.2. Market Analysis, Insights and Forecast - by Type
- 8.2.1. Mupirocin Ointment
- 8.2.2. Fusidic Acid Ointment
- 8.2.3. Gentamicin Ointment
- 8.2.4. Dicloxacillin
- 8.1. Market Analysis, Insights and Forecast - by Application
- 9. Europe Paronychia Treatment Analysis, Insights and Forecast, 2020-2032
- 9.1. Market Analysis, Insights and Forecast - by Application
- 9.1.1. Hospital Pharmacy
- 9.1.2. Retail Pharmacy
- 9.1.3. Online Pharmacy
- 9.2. Market Analysis, Insights and Forecast - by Type
- 9.2.1. Mupirocin Ointment
- 9.2.2. Fusidic Acid Ointment
- 9.2.3. Gentamicin Ointment
- 9.2.4. Dicloxacillin
- 9.1. Market Analysis, Insights and Forecast - by Application
- 10. Middle East & Africa Paronychia Treatment Analysis, Insights and Forecast, 2020-2032
- 10.1. Market Analysis, Insights and Forecast - by Application
- 10.1.1. Hospital Pharmacy
- 10.1.2. Retail Pharmacy
- 10.1.3. Online Pharmacy
- 10.2. Market Analysis, Insights and Forecast - by Type
- 10.2.1. Mupirocin Ointment
- 10.2.2. Fusidic Acid Ointment
- 10.2.3. Gentamicin Ointment
- 10.2.4. Dicloxacillin
- 10.1. Market Analysis, Insights and Forecast - by Application
- 11. Asia Pacific Paronychia Treatment Analysis, Insights and Forecast, 2020-2032
- 11.1. Market Analysis, Insights and Forecast - by Application
- 11.1.1. Hospital Pharmacy
- 11.1.2. Retail Pharmacy
- 11.1.3. Online Pharmacy
- 11.2. Market Analysis, Insights and Forecast - by Type
- 11.2.1. Mupirocin Ointment
- 11.2.2. Fusidic Acid Ointment
- 11.2.3. Gentamicin Ointment
- 11.2.4. Dicloxacillin
- 11.1. Market Analysis, Insights and Forecast - by Application
- 12. Competitive Analysis
- 12.1. Company Profiles
- 12.1.1 GlaxoSmithKline
- 12.1.1.1. Company Overview
- 12.1.1.2. Products
- 12.1.1.3. Company Financials
- 12.1.1.4. SWOT Analysis
- 12.1.2 Glenmark Generics
- 12.1.2.1. Company Overview
- 12.1.2.2. Products
- 12.1.2.3. Company Financials
- 12.1.2.4. SWOT Analysis
- 12.1.3 Teva Pharmaceutical Industries
- 12.1.3.1. Company Overview
- 12.1.3.2. Products
- 12.1.3.3. Company Financials
- 12.1.3.4. SWOT Analysis
- 12.1.4 Eli Lilly
- 12.1.4.1. Company Overview
- 12.1.4.2. Products
- 12.1.4.3. Company Financials
- 12.1.4.4. SWOT Analysis
- 12.1.5 Jonakayem Pharma Formulation
- 12.1.5.1. Company Overview
- 12.1.5.2. Products
- 12.1.5.3. Company Financials
- 12.1.5.4. SWOT Analysis
- 12.1.6 Fougera Pharmaceuticals
- 12.1.6.1. Company Overview
- 12.1.6.2. Products
- 12.1.6.3. Company Financials
- 12.1.6.4. SWOT Analysis
- 12.1.7 Taro Pharmaceutical Industries
- 12.1.7.1. Company Overview
- 12.1.7.2. Products
- 12.1.7.3. Company Financials
- 12.1.7.4. SWOT Analysis
- 12.1.1 GlaxoSmithKline
- 12.2. Market Entropy
- 12.2.1 Company's Key Areas Served
- 12.2.2 Recent Developments
- 12.3. Company Market Share Analysis 2025
- 12.3.1 Top 5 Companies Market Share Analysis
- 12.3.2 Top 3 Companies Market Share Analysis
- 12.4. List of Potential Customers
- 13. Research Methodology
List of Figures
- Figure 1: Global Paronychia Treatment Revenue Breakdown (undefined, %) by Region 2025 & 2033
- Figure 2: North America Paronychia Treatment Revenue (undefined), by Application 2025 & 2033
- Figure 3: North America Paronychia Treatment Revenue Share (%), by Application 2025 & 2033
- Figure 4: North America Paronychia Treatment Revenue (undefined), by Type 2025 & 2033
- Figure 5: North America Paronychia Treatment Revenue Share (%), by Type 2025 & 2033
- Figure 6: North America Paronychia Treatment Revenue (undefined), by Country 2025 & 2033
- Figure 7: North America Paronychia Treatment Revenue Share (%), by Country 2025 & 2033
- Figure 8: South America Paronychia Treatment Revenue (undefined), by Application 2025 & 2033
- Figure 9: South America Paronychia Treatment Revenue Share (%), by Application 2025 & 2033
- Figure 10: South America Paronychia Treatment Revenue (undefined), by Type 2025 & 2033
- Figure 11: South America Paronychia Treatment Revenue Share (%), by Type 2025 & 2033
- Figure 12: South America Paronychia Treatment Revenue (undefined), by Country 2025 & 2033
- Figure 13: South America Paronychia Treatment Revenue Share (%), by Country 2025 & 2033
- Figure 14: Europe Paronychia Treatment Revenue (undefined), by Application 2025 & 2033
- Figure 15: Europe Paronychia Treatment Revenue Share (%), by Application 2025 & 2033
- Figure 16: Europe Paronychia Treatment Revenue (undefined), by Type 2025 & 2033
- Figure 17: Europe Paronychia Treatment Revenue Share (%), by Type 2025 & 2033
- Figure 18: Europe Paronychia Treatment Revenue (undefined), by Country 2025 & 2033
- Figure 19: Europe Paronychia Treatment Revenue Share (%), by Country 2025 & 2033
- Figure 20: Middle East & Africa Paronychia Treatment Revenue (undefined), by Application 2025 & 2033
- Figure 21: Middle East & Africa Paronychia Treatment Revenue Share (%), by Application 2025 & 2033
- Figure 22: Middle East & Africa Paronychia Treatment Revenue (undefined), by Type 2025 & 2033
- Figure 23: Middle East & Africa Paronychia Treatment Revenue Share (%), by Type 2025 & 2033
- Figure 24: Middle East & Africa Paronychia Treatment Revenue (undefined), by Country 2025 & 2033
- Figure 25: Middle East & Africa Paronychia Treatment Revenue Share (%), by Country 2025 & 2033
- Figure 26: Asia Pacific Paronychia Treatment Revenue (undefined), by Application 2025 & 2033
- Figure 27: Asia Pacific Paronychia Treatment Revenue Share (%), by Application 2025 & 2033
- Figure 28: Asia Pacific Paronychia Treatment Revenue (undefined), by Type 2025 & 2033
- Figure 29: Asia Pacific Paronychia Treatment Revenue Share (%), by Type 2025 & 2033
- Figure 30: Asia Pacific Paronychia Treatment Revenue (undefined), by Country 2025 & 2033
- Figure 31: Asia Pacific Paronychia Treatment Revenue Share (%), by Country 2025 & 2033
List of Tables
- Table 1: Global Paronychia Treatment Revenue undefined Forecast, by Application 2020 & 2033
- Table 2: Global Paronychia Treatment Revenue undefined Forecast, by Type 2020 & 2033
- Table 3: Global Paronychia Treatment Revenue undefined Forecast, by Region 2020 & 2033
- Table 4: Global Paronychia Treatment Revenue undefined Forecast, by Application 2020 & 2033
- Table 5: Global Paronychia Treatment Revenue undefined Forecast, by Type 2020 & 2033
- Table 6: Global Paronychia Treatment Revenue undefined Forecast, by Country 2020 & 2033
- Table 7: United States Paronychia Treatment Revenue (undefined) Forecast, by Application 2020 & 2033
- Table 8: Canada Paronychia Treatment Revenue (undefined) Forecast, by Application 2020 & 2033
- Table 9: Mexico Paronychia Treatment Revenue (undefined) Forecast, by Application 2020 & 2033
- Table 10: Global Paronychia Treatment Revenue undefined Forecast, by Application 2020 & 2033
- Table 11: Global Paronychia Treatment Revenue undefined Forecast, by Type 2020 & 2033
- Table 12: Global Paronychia Treatment Revenue undefined Forecast, by Country 2020 & 2033
- Table 13: Brazil Paronychia Treatment Revenue (undefined) Forecast, by Application 2020 & 2033
- Table 14: Argentina Paronychia Treatment Revenue (undefined) Forecast, by Application 2020 & 2033
- Table 15: Rest of South America Paronychia Treatment Revenue (undefined) Forecast, by Application 2020 & 2033
- Table 16: Global Paronychia Treatment Revenue undefined Forecast, by Application 2020 & 2033
- Table 17: Global Paronychia Treatment Revenue undefined Forecast, by Type 2020 & 2033
- Table 18: Global Paronychia Treatment Revenue undefined Forecast, by Country 2020 & 2033
- Table 19: United Kingdom Paronychia Treatment Revenue (undefined) Forecast, by Application 2020 & 2033
- Table 20: Germany Paronychia Treatment Revenue (undefined) Forecast, by Application 2020 & 2033
- Table 21: France Paronychia Treatment Revenue (undefined) Forecast, by Application 2020 & 2033
- Table 22: Italy Paronychia Treatment Revenue (undefined) Forecast, by Application 2020 & 2033
- Table 23: Spain Paronychia Treatment Revenue (undefined) Forecast, by Application 2020 & 2033
- Table 24: Russia Paronychia Treatment Revenue (undefined) Forecast, by Application 2020 & 2033
- Table 25: Benelux Paronychia Treatment Revenue (undefined) Forecast, by Application 2020 & 2033
- Table 26: Nordics Paronychia Treatment Revenue (undefined) Forecast, by Application 2020 & 2033
- Table 27: Rest of Europe Paronychia Treatment Revenue (undefined) Forecast, by Application 2020 & 2033
- Table 28: Global Paronychia Treatment Revenue undefined Forecast, by Application 2020 & 2033
- Table 29: Global Paronychia Treatment Revenue undefined Forecast, by Type 2020 & 2033
- Table 30: Global Paronychia Treatment Revenue undefined Forecast, by Country 2020 & 2033
- Table 31: Turkey Paronychia Treatment Revenue (undefined) Forecast, by Application 2020 & 2033
- Table 32: Israel Paronychia Treatment Revenue (undefined) Forecast, by Application 2020 & 2033
- Table 33: GCC Paronychia Treatment Revenue (undefined) Forecast, by Application 2020 & 2033
- Table 34: North Africa Paronychia Treatment Revenue (undefined) Forecast, by Application 2020 & 2033
- Table 35: South Africa Paronychia Treatment Revenue (undefined) Forecast, by Application 2020 & 2033
- Table 36: Rest of Middle East & Africa Paronychia Treatment Revenue (undefined) Forecast, by Application 2020 & 2033
- Table 37: Global Paronychia Treatment Revenue undefined Forecast, by Application 2020 & 2033
- Table 38: Global Paronychia Treatment Revenue undefined Forecast, by Type 2020 & 2033
- Table 39: Global Paronychia Treatment Revenue undefined Forecast, by Country 2020 & 2033
- Table 40: China Paronychia Treatment Revenue (undefined) Forecast, by Application 2020 & 2033
- Table 41: India Paronychia Treatment Revenue (undefined) Forecast, by Application 2020 & 2033
- Table 42: Japan Paronychia Treatment Revenue (undefined) Forecast, by Application 2020 & 2033
- Table 43: South Korea Paronychia Treatment Revenue (undefined) Forecast, by Application 2020 & 2033
- Table 44: ASEAN Paronychia Treatment Revenue (undefined) Forecast, by Application 2020 & 2033
- Table 45: Oceania Paronychia Treatment Revenue (undefined) Forecast, by Application 2020 & 2033
- Table 46: Rest of Asia Pacific Paronychia Treatment Revenue (undefined) Forecast, by Application 2020 & 2033
Frequently Asked Questions
1. What is the projected Compound Annual Growth Rate (CAGR) of the Paronychia Treatment?
The projected CAGR is approximately 7.2%.
2. Which companies are prominent players in the Paronychia Treatment?
Key companies in the market include GlaxoSmithKline, Glenmark Generics, Teva Pharmaceutical Industries, Eli Lilly, Jonakayem Pharma Formulation, Fougera Pharmaceuticals, Taro Pharmaceutical Industries.
3. What are the main segments of the Paronychia Treatment?
The market segments include Application, Type.
4. Can you provide details about the market size?
The market size is estimated to be USD XXX N/A as of 2022.
5. What are some drivers contributing to market growth?
N/A
6. What are the notable trends driving market growth?
N/A
7. Are there any restraints impacting market growth?
N/A
8. Can you provide examples of recent developments in the market?
N/A
9. What pricing options are available for accessing the report?
Pricing options include single-user, multi-user, and enterprise licenses priced at USD 3950.00, USD 5925.00, and USD 7900.00 respectively.
10. Is the market size provided in terms of value or volume?
The market size is provided in terms of value, measured in N/A.
11. Are there any specific market keywords associated with the report?
Yes, the market keyword associated with the report is "Paronychia Treatment," which aids in identifying and referencing the specific market segment covered.
12. How do I determine which pricing option suits my needs best?
The pricing options vary based on user requirements and access needs. Individual users may opt for single-user licenses, while businesses requiring broader access may choose multi-user or enterprise licenses for cost-effective access to the report.
13. Are there any additional resources or data provided in the Paronychia Treatment report?
While the report offers comprehensive insights, it's advisable to review the specific contents or supplementary materials provided to ascertain if additional resources or data are available.
14. How can I stay updated on further developments or reports in the Paronychia Treatment?
To stay informed about further developments, trends, and reports in the Paronychia Treatment, consider subscribing to industry newsletters, following relevant companies and organizations, or regularly checking reputable industry news sources and publications.
Methodology
Step 1 - Identification of Relevant Samples Size from Population Database



Step 2 - Approaches for Defining Global Market Size (Value, Volume* & Price*)

Note*: In applicable scenarios
Step 3 - Data Sources
Primary Research
- Web Analytics
- Survey Reports
- Research Institute
- Latest Research Reports
- Opinion Leaders
Secondary Research
- Annual Reports
- White Paper
- Latest Press Release
- Industry Association
- Paid Database
- Investor Presentations

Step 4 - Data Triangulation
Involves using different sources of information in order to increase the validity of a study
These sources are likely to be stakeholders in a program - participants, other researchers, program staff, other community members, and so on.
Then we put all data in single framework & apply various statistical tools to find out the dynamic on the market.
During the analysis stage, feedback from the stakeholder groups would be compared to determine areas of agreement as well as areas of divergence